Sample Category Title
Japan’s Tertiary Industry Index Unexpectedly Declined In December
For the 24 hours to 23:00 GMT, the USD declined 0.59% against the JPY and closed at 108.73.
In the Asian session, at GMT0400, the pair is trading at 108.97, with the USD trading 0.22% higher against the JPY from yesterday's close.
Earlier today, data showed that Japan's tertiary industry index surprisingly fell 0.2% MoM in December, defying market expectations for an advance of 0.2%. In the prior month, the index had risen 1.1%.
The pair is expected to find support at 108.39, and a fall through could take it to the next support level of 107.8. The pair is expected to find its first resistance at 109.67, and a rise through could take it to the next resistance level of 110.36.
Looking forward, traders would keep a close watch on Japan's 4Q GDP data, the sole important release next week.
The currency pair is showing convergence with its 20 Hr moving average and trading below its 50 Hr moving average.

Swiss Franc Trading On A Weaker Footing, Ahead Of Swiss Unemployment Rate Data
For the 24 hours to 23:00 GMT, the USD declined 0.78% against the CHF and closed at 0.9360.
In the Asian session, at GMT0400, the pair is trading at 0.9377, with the USD trading 0.18% higher against the CHF from yesterday’s close.
The pair is expected to find support at 0.9327, and a fall through could take it to the next support level of 0.9278. The pair is expected to find its first resistance at 0.9448, and a rise through could take it to the next resistance level of 0.9520.
Moving ahead, traders would focus on Switzerland’s unemployment rate data for January, slated to release in a while.
The currency pair is trading below its 20 Hr and 50 Hr moving averages.

Canada’s Housing Starts Slightly Declined In January
For the 24 hours to 23:00 GMT, the USD rose 0.32% against the CAD and closed at 1.2595.
On the data front, Canada's seasonally adjusted housing starts fell less-than-anticipated to a level of 216.2K in January, compared to a revised reading of 216.3K in the previous month. Markets were expecting housing starts to ease to a level of 210.0K. Additionally, the nation's new housing price index remained flat on a monthly basis in December, against market expectations for an advance of 0.1%. In the prior month, the index had recorded a rise of 0.1%.
In the Asian session, at GMT0400, the pair is trading at 1.2600, with the USD trading a tad higher against the CAD from yesterday's close.
The pair is expected to find support at 1.256, and a fall through could take it to the next support level of 1.2520. The pair is expected to find its first resistance at 1.2627, and a rise through could take it to the next resistance level of 1.2654.
Ahead in the day, investors would monitor Canada's unemployment rate data for January, to gauge the strength in Canadian labour market.
The currency pair is showing convergence with its 20 Hr moving average and trading above its 50 Hr moving average.

Elliott Wave View: DXY Near Turn
DXY Short Term Elliott Wave view suggests that Intermediate wave (3) ended at 88.44. Up from there, Intermediate wave (4) bounce is in progress as a triple three Elliott Wave structure. Rally to 89.64 ended Minor wave W, Minor wave X ended at 88.55, Minor wave Y ended at 90.03 and Minor second wave X ended at 89.48. Cycle from 1/26 low is mature and Intermediate wave (4) can end any moment. However, near term, while pullbacks stay above 89.48, Index has scope to extend higher to 90.67 – 90.95 area to end wave Z of (4) before the decline resumes. We don’t like buying the Index and expect sellers to appear from the above area for a 3 waves pullback at least
DXY 1 Hour Elliott Wave Chart
BOE Sent Hawkish Signal, Rate Hike Might Come As Early As In May
The BOE left the Bank Rate unchanged at 0.5% and the asset purchase program unchanged at 435B pound. The members voted unanimously (9-0) for the decision. What caught the market attention most is the comment that the“monetary policy would need to be tightened somewhat earlier and by a somewhat greater extent over the forecast period than anticipated at the time of the November Report”. The market has raised bets to 70% for a May rate hike and 80% for August. On the economic growth outlook, the staff raised the GDP growth forecasts for both 2018 and 2019. Inflation would remain strong in coming years and is expected to remain persistently above target at 2.2% in 1Q20 and 2.1% in 1Q21.
On the updated economic forecasts, the members lifted the GDP growth forecast to +1.8% (previous: +1.6%) for 2018 and to +1.8% for 2019 (previous: +1.7%). The members have also turned more upbeat over the employment situation. As such, they have revised lower the NAIRU, the equilibrium unemployment rate, to about 4.25%, from 4.5% previously. Meanwhile the overall slack within the economy is expected to be just below under 0.25% of GDP.
Inflation should remain firm and persistently above the +2% target over forecast horizon. The members forecast inflation to reach +2.2% in 1Q20 before easing slightly to +2.1% in 1Q21. Overshooting of inflation has been a concern of the central bank, even triggering it to increase the interest rate last November, although economic growth and confidence level remained soft. The minutes for the February meeting noted that it is “appropriate to set monetary policy so that inflation returns sustainably to its target at a more conventional horizon”. It is believed that the central bank now focuses on a 2-year horizon, rather than three. Note that the central bank has revised the inflation outlook higher for the near term, thanks to the recent rise in oil prices. Inflation after this year is revised lower after the strong oil impact fades. Depreciation of British pound would continue to have impact on the general price level but the effect is diminishing.
On the monetary policy outlook, the BOE noted that it would “need to be tightened somewhat earlier and by a somewhat greater extent over the forecast period” than anticipated in November. Yet, it added that any rate hike would be “limited” and “gradual”. The market has now priced in 70% chance for a May rate hike and 80% for August.
USD/JPY Struggle To Break 110.00-110.40 Continues
Key Highlights
- The US Dollar struggled a lot recently to break an important resistance near 110.00-110.40 against the Japanese Yen.
- There is a crucial bearish trend line in place with resistance at 109.95 on the 4-hours chart of USD/JPY.
- The US Initial Jobless Claims for the week ending Feb 3rd, 2018 declined from 230K to 221K.
- China's CPI increased 1.5% in Jan 2018, similar to the forecast of 1.5% (YoY).
USDJPY Technical Analysis
The US Dollar failed this week to break a crucial resistance near 110.00-110.40 against the Japanese Yen. The USD/JPY pair is likely approaching a key break either above 110.00 or below 108.50.
This past week, we discussed a major resistance near 110.00-110.40 in USD/JPY. The pair struggled many times around the same resistance and declined towards 108.60. It seems like there were mostly ranging moves between 108.50 and 110.40.
The market consolidated for many sessions and now it seems like the pair is preparing for the next break. On the upside, there is a crucial bearish trend line in place with resistance at 109.95 on the 4-hours chart.
The pair has to break the trend line resistance at 109.95 and settle above the 100 simple moving average (red, 4-hours) to gain upside momentum. However, a proper close above 110.30-40 is must for a follow through towards 111.00.
The 61.8% Fib retracement level of the last decline from the 111.22 high to 108.28 low at 111.10 would act as an intermediate resistance. On the flip side, if the pair fails to move past 110.40, it may perhaps move down and break the lower end of the range at 108.50.
US Initial Jobless Claims
Recently, the US Initial Jobless Claims figure for the week ending Feb 3rd, 2018 was released by the US Department of Labor. The forecast was slated for an increase in claims from the last reading of 230K to 232K.
The actual result was better than the forecast, as there was a decline in claims from 230K to 221K. The report mentioned that:
The 4-week moving average was 224,500, a decrease of 10,000 from the previous week's unrevised average of 234,500. This is the lowest level for this average since March 10, 1973 when it was 222,000.
Overall, the market sentiment is favoring more gains in the US Dollar. Therefore, there are chances of an upside move in USD/JPY, and on the other hand, declines in EUR/USD and GBP/USD.
Market Morning Briefing: Dow Came Off To Re-Test 24000
STOCKS
Overall view remains bearish for the near term. After a day of slight recovery, most indices are back into the red today and the bears may continue to take charge of the movements for the next few sessions.
Dow (23860.46, -4.15%) came off to re-test 24000 indicating that the fall may not be over yet. Decent support is visible in the 23600-24000 region which may hold for a few sessions.
Dax (12260.29, -2.62%) came off as expected with the resistance near 12700 holding well. We need to see if the price falls below 12200 to test 12000 in the coming sessions. A break below 12200 could take it down to the next support levels near 11870.
Nikkei (21185.76, -3.22%) came back to test support near 21000 visible on the 3-day candles. While this holds, there could be some scope of a bounce back towards 23000. But a break on the downside, if seen could make the index vulnerable to a fall towards 20500 or lower in the medium term.
Shanghai (3090.34, -5.26%) continues to fall sharply, breaking below the weekly support below 3300. While the fall continues, the index could be headed towards 3050-3000 in the next couple of sessions.
Nifty (10576.85, +0.96%) and Sensex (34413.16, +0.97%) recovered slightly but could again plunge to lower levels today. The indices are likely to re-tests immediate supports near 10380 and 33750 respectively or even lower in the next few sessions.
COMMODITIES
Brent (64.32) and WTI (60.53) are down in line with our expectation.
The crude prices look bearish for the coming sessions with Brent likely to test 63-62 levels in the near term. WTI on the other hand may move down towards 59-58, if a break below 60 is seen. We do not expect a fall below 62 and 58 respectively for now and may expect a bounce from these levels.
Gold (1317.31) tested 1310 on the downside before coming back to levels above 1315. We need to see if 1310-1315 holds in the coming sessions; else a gradual fall towards 1300 or lower could be possible next week. A bounce from 1310-1315 could take it higher towards 1340 again which would reduce possibility of coming down to 1300.
Copper (3.0665) has surprisingly broken below immediate daily support near 3.07. But note that the 3.00-3.05 could act as a medium term support which if holds could bring a bounce in the coming sessions. A break below 3, if seen could be surprising and may indicate further weakness for the medium term.
FOREX
Dollar Index (90.255) has been moving in a very narrow range (90.2-90.3) after touching a high of 90.57 yesterday. As mentioned yesterday as well, a test of resistance just below 91 (as seen on the daily candles and weekly line charts) could happen next week.
Euro (1.2259) is trading below support near 1.2275 and even saw a low of 1.2212 yesterday. The earlier mentioned lower support near 1.22 on the 3 day line chart and near 1.215-1.22 on the daily candles, could be the next target early next week. These should provide decent support.
As predicted yesterday, Dollar Yen (109) tested support at 108.5 today (this support is seen on daily, 3 day and weekly candles and on the weekly line chart as well) and is now trading above that support level. We could now see it moving towards 110.5-111 in the next week. There is resistance near 110.5-111 on the weekly line charts.
Contrary to our expectation, Euro Yen (133.59) broke support near 134 yesterday and reached lows near 132.94 yesterday. This has happened on back of Euro weakness against the dollar and corresponding Yen strength. As both Euro and Yen could weaken against the Dollar in the coming week, it needs to be seen how Euro Yen responds.
The downtrend of the last 5 days has paused for Pound (1.3940) as it even saw a high of 1.4067 yesterday. There could be some consolidation around 1.39 for the Pound before the downtrend towards support near 1.37 on daily candles resumes.
Dollar Rupee (64.40) - Important resistance to watch at 64.50-64.40 on USDINR, break of which would take it higher to 64.60.
INTEREST RATES
US 10 Year Yield (2.8312), US 30 year Yield (3.1357), US 5 year yield (2.5448), US 2 year yield (2.1054) : US longer term yields moved up 2 basis points while the nearer term yields consolidated around yesterday’s levels. Our expectation for the 4 yields to respect their long term resistance levels (2.85, 3.15, 2.6 and 2.2 respectively) and not see further volatility in this month is holding up for now. There is some likelihood for the US govt shutdown to happen again, in which case there could be some volatility for a few days.
Both US 30-10 Year Yield Spread (0.304) and US 10-5 Year Yield Spread (0.2864) have moved up further and could continue this upmove gradually in the coming days. There could be some resistance near 0.33 for the 10-5 Year yield spread in the weeks to come.
German 10 Year bond yield (0.76) is testing resistance near 0.76 on the medium term chart currently and should keep ranging between 0.7 and 0.76.
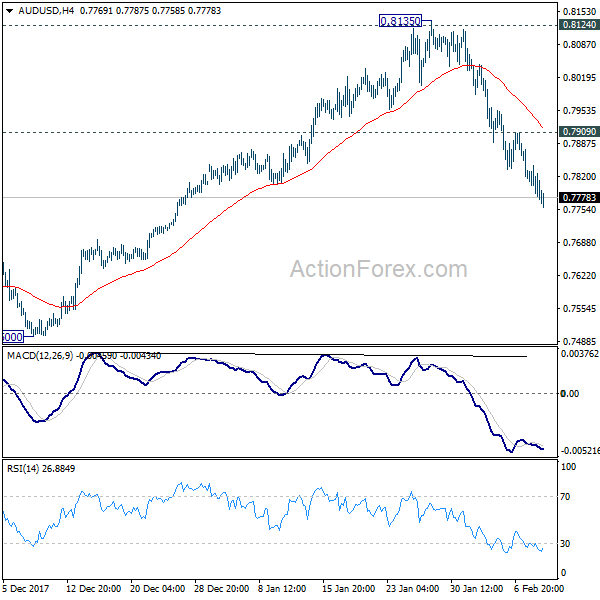
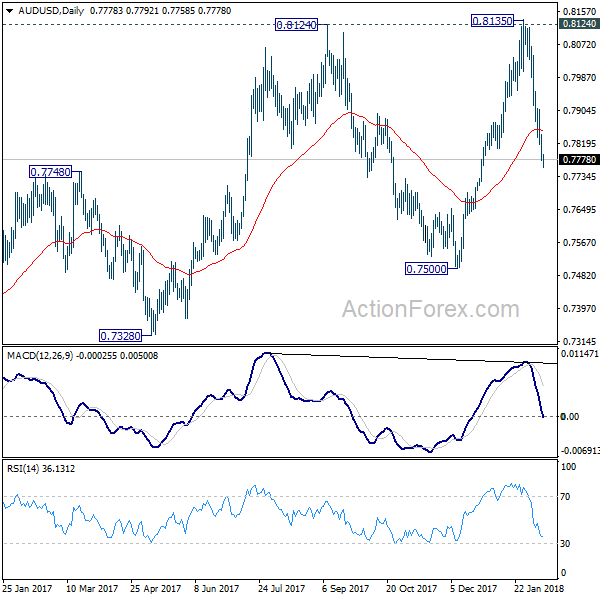
AUD/USD Daily Outlook
Daily Pivots: (S1) 0.7756; (P) 0.7800; (R1) 0.7824; More...
AUD/USD's fall from 0.8135 is still in progress and intraday bias remains on the downside for retesting 0.7500 support. At this point, there is no clearly sign of larger trend reversal yet. Hence, we'd look for strong support from 0.7500 to contain downside and bring rebound. On the upside, above 0.7909 minor resistance will turn bias back to the upside for retesting 0.8135 high.
In the bigger picture, medium term rebound from 0.6826 is seen as a corrective move. It might still extend higher but we'd expect strong resistance from 38.2% retracement of 1.1079 to 0.6826 at 0.8451 to limit upside to bring long term down trend resumption. On the downside, break of 0.7500 support will now be an important signal that such corrective rebound is completed.
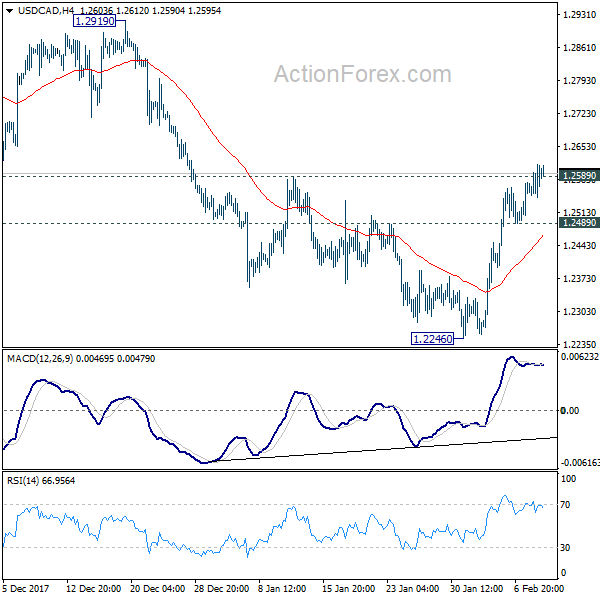
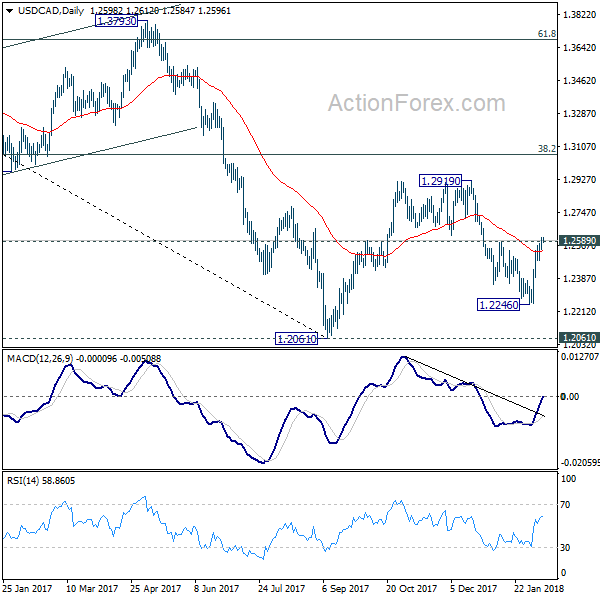
USD/CAD Daily Outlook
Daily Pivots: (S1) 1.2561; (P) 1.2587; (R1) 1.2628; More...
USD/CAD's rise from 1.2246 resumed after brief consolidation and intraday bias is back on the upside. Sustained trading above 1.2589 resistance will indicate that pull back from 1.2919 has completed and would bring retest of this resistance. On the downside, below 1.2489 minor support will turn focus back to 1.2246 instead.
In the bigger picture, rebound from 1.2061 is likely completed completed at 1.2919, rejected by 55 week EMA and kept below 38.2% retracement of 1.4689 to 1.2061 at 1.3065. The development also suggests that long term fall from 1.4689 is not completed yet. Decisive break of 1.2061 low will target 61.8% retracement of 0.9406 to 1.4689 at 1.1424. This will now be the favored case as long as 1.2919 resistance holds.
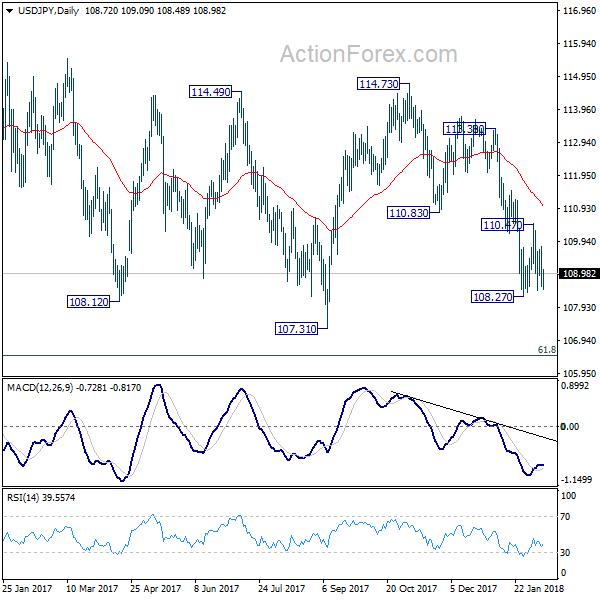
USD/JPY Daily Outlook
Daily Pivots: (S1) 108.29; (P) 109.03; (R1) 109.50; More...
USD/JPY is still bounded in range of 108.27/110.47 and intraday bias remains neutral. As noted before, larger decline from 114.73 is possibly still in progress. Break of 108.27 will also resume the medium term correction from 118.65. That will send USD/JPY through 107.31 to 106.48 fibonacci level. Nonetheless, above 110.47 will turn intraday bias back to the upside and bring stronger rebound.
In the bigger picture, current development argues that the corrective pattern from 118.65 is extending. There is risk of dropping further to 61.8% retracement of 98.97 to 118.65 at 106.48. But this level should provide strong support to contain downside and bring resumption of rise from 98.97. However, sustained break of 106.48 will now likely send USD/JPY through 98.97 to resume the corrective fall from 125.85 (2015 high).