
Sample Category Title
USD/CHF Daily Outlook
Daily Pivots: (S1) 0.9320; (P) 0.9394; (R1) 0.9435; More...
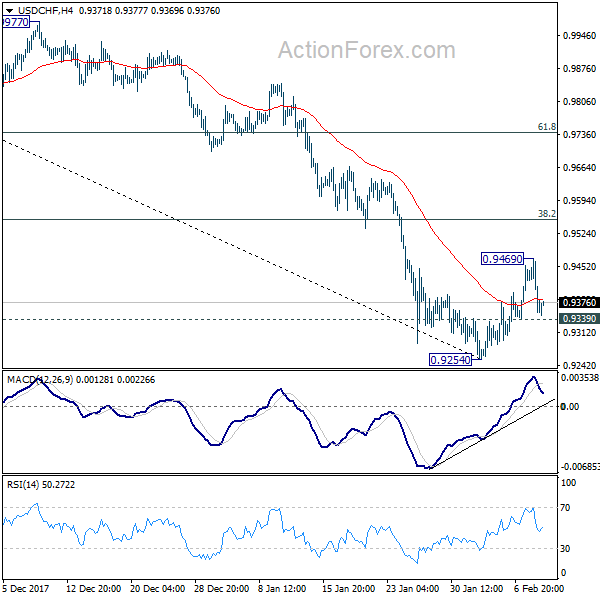
USD/CHF formed a temporary top at 0.9469 and intraday bias is turned neutral first. Above 0.9469 will extend the rebound form 0.9254. But at this point, there is no clear sign of trend reversal yet. We'd be cautious on strong resistance from 38.2% retracement of 1.0037 to 0.9254 at 0.9553 to limit upside and bring decline resumption. On the downside, below 0.9339 minor support will turn bias to the downside for 0.9254. Nonetheless, firm break of 0.9553 will bring stronger rebound to 55 day EMA (now at 0.9616).
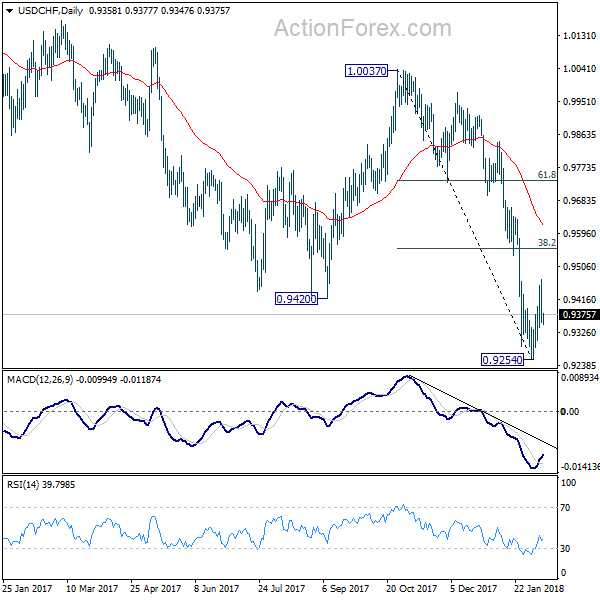
In the bigger picture, the strong break of 0.9420 support suggests that fall from 1.0342 is developing into a medium term down trend. Deeper fall should be seen to 100% projection of 1.0342 to 0.9420 from 1.0037 at 0.9115. Break will target 161.8% projection at 0.8545. In any case, break of 0.9640 resistance is needed to be the first sign of medium term bottoming. Otherwise, outlook will stay bearish even in case of strong rebound.
GBP/USD Daily Outlook
Daily Pivots: (S1) 1.3814; (P) 1.3940; (R1) 1.4035; More.....
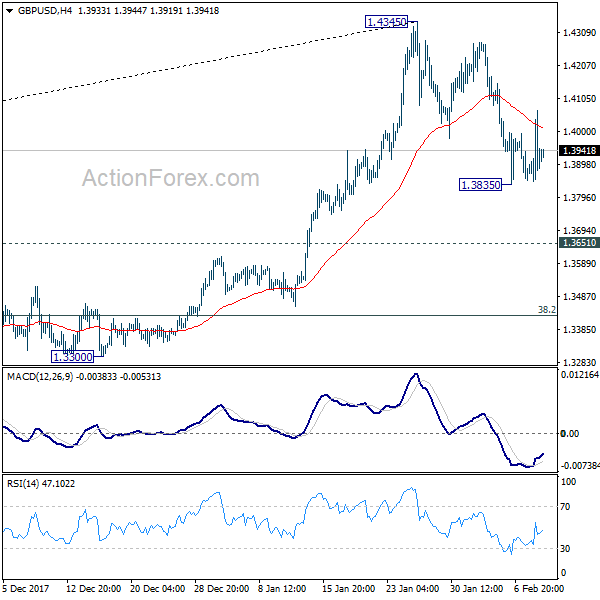
Intraday bias in GBP/USD remains neutral for the moment. At this point, it's still unsure whether decline from 1.4345 is correcting rise from 1.3038, or that from 1.1946, or it's reversing the trend. But another fall will remain in favor as long as 1.4345 resistance holds. Below 1.3835 will target 1.3651 resistance turned support first. Break of 1.3651 will turn focus to key fibonacci level at 1.3429.
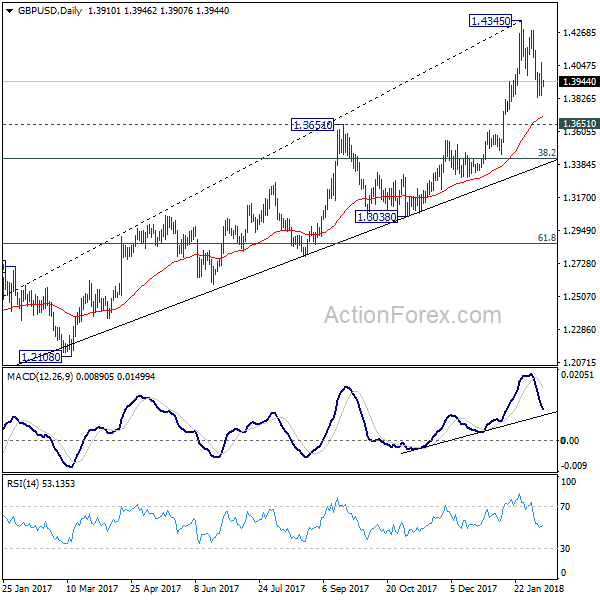
In the bigger picture, sustained break of 1.3835 key resistance level indicates that rebound from 1.1946 is at least correcting the long term down from from 2007 high at 2.1161. Further rise should now be seen back to 38.2% retracement of 2.1161 (2007 high) to 1.1946 (2016 low) at 1.5466. Medium term outlook will stay bullish 38.2% retracement of 1.1946 to 1.4345 at 1.3429, in case of deep pull back.
EUR/USD Daily Outlook
Daily Pivots: (S1) 1.2207; (P) 1.2250 (R1) 1.2290; More....
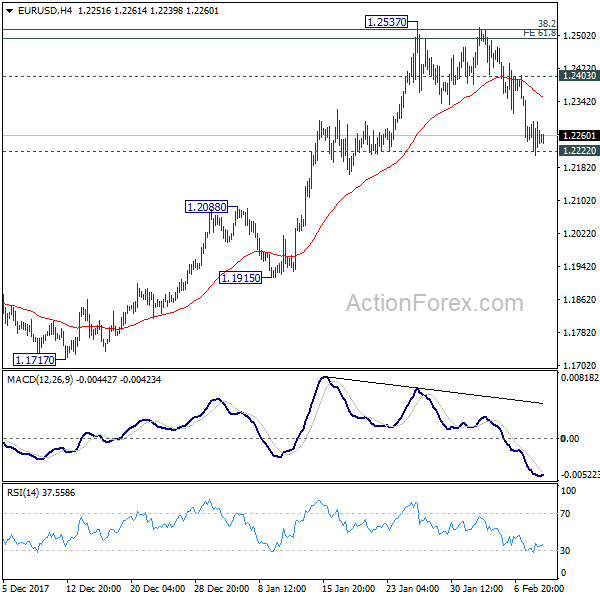
EUR/USD breached 1.222 key support but there is no follow through selling yet. Nonetheless, there is also no sign of bottoming and intraday bias remains on the downside. Sustained break of 1.2222 should confirm rejection from 1.2494/2516 key fibonacci level, as well as near term reversal, on bearish divergence condition in 4 hour MACD. That could also signal completion of medium term up trend from 1.0339. In that case, near term outlook will be turned bearish for 1.2091 resistance turned support first. On the upside, though, above 1.2403 minor resistance will revive bullishness and turn focus back to 1.2537.
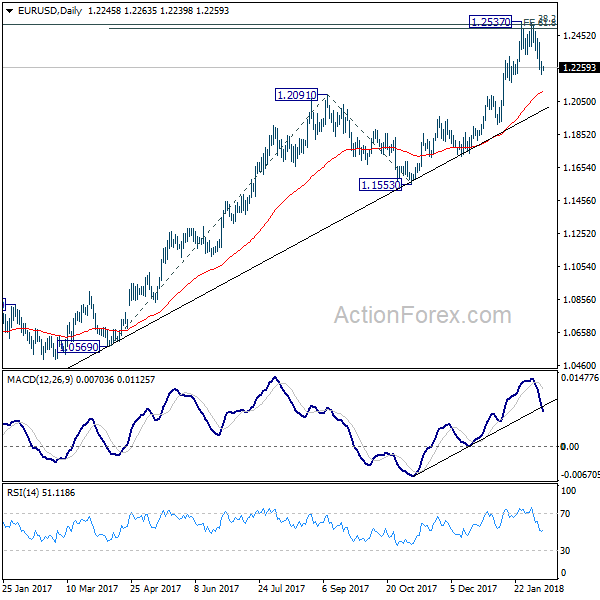
In the bigger picture, rise from 1.0339 medium term bottom is still seen as a corrective move for the moment. But key fibonacci level at 38.2% retracement of 1.6039 (2008 high) to 1.0339 (2017 low) at 1.2516 is looking vulnerable. Sustained break of 1.2516 will carry larger bullish implication and target 61.8% retracement of 1.6039 to 1.0339 at 1.3862. Nonetheless, rejection from 1.2516 will maintain long term bearish outlook and keep the case for retesting 1.0039 alive.
DOW Posted Another 1000 pts Drop, EUR/USD Pressing 1.22 Key Support
Stocks suffered another round of steep selloff overnight. DOW dropped more than -1000 pts for the second time in just four days, scoring the second biggest point drop ever. DOW lost -1035.89 pts, or -4.15% to close at 23860.46. This week's low at 23778.74 was not breached yet. But it looks vulnerable as two other major indices made new lows already. S&P 500 lost -100.66 pts or -3.75% to close at 2581.0, below prior weekly low at 2593.07. NASDAQ dropped -274.82 pts or -3.9% to 6777.16, also below prior weekly low at 6824.82. That is, recent selloff is resuming and the indices will likely head further lower before closing the week. In Asian markets, Nikkei follows by losing -3.2% at the time of writing, HK HSI is down -3.65%.
In the currency markets, Yen is leading the way up, followed by Dollar as the second strongest for the week. Aussie is the worst performer, followed by Euro, Canadian and Kiwi. Sterling is mixed as it got some boost from yesterday's hawkish BoE announcement. Technically, 1.2222 is EUR/USD is the key level to watch today. The pair breached this level briefly yesterday but quickly turned sideway. Firm break of 1.2222 will be a strong sign of rejection of 1.2516 long term fibonacci resistance and trend reversal.
Fed George: Three hikes a reasonable baseline
Kansas City Fed President Esther George warned that the impact of the government's fiscal stimulus on the economy is uncertain. In the background, the labor market appears to be tight, and inflation risks are on the rise. Therefore, "it is important that the [Fed] continues on its current path of policy normalization with gradual increases in the target federal funds rate." She added that rates are important to "sustain the expansion without pushing the economy beyond its capacity limits and creating inflationary pressures." And, in her view, three hikes this year is "a reasonable baseline unless the outlook changes materially."
RBA lowered unemployment forecast
In the monetary statement published today, RBA lowered unemployment rate forecasts but kept projections on growth and inflation unchanged. Year average GDP growth is projected to be at 3% in 2018 and 3.25% in 2019. CPI is projected to be at 2.25% by the end of 2018 and stay at 2.25% by the end of 2019. Unemployment rate, though, is forecast to drop from current 5.5% to 5.25% by the end of 2018, revised down from 5.50%. Unemployment is forecast to stay at 5.25% till end of 2019.
RBA noted that "financial market volatility has picked up in recent days, most notably in equity markets as market participants have begun to reassess the outlook for global inflation and the withdrawal of monetary accommodation". And, "an important consideration for the outlook is how far inflation picks up as the global economy strengthens." It added that "a larger-than-expected increase in inflation would have implications both for financial market pricing and exchange rates."
Also from Australia, home loans dropped more than expected by -2.3% mom in December.
Elsewhere
Japan M2 rose 3.4% yoy in January. China CPI slowed to 1.5% yoy in January, PPI slowed to 4.3% yoy. Swiss will release unemployment rate in European session. But main focus will be on UK data, where productions and trade balance are featured. Later in the data, Canada employment will take center stage.
EUR/USD Daily Outlook
Daily Pivots: (S1) 1.2207; (P) 1.2250 (R1) 1.2290; More....
EUR/USD breached 1.222 key support but there is no follow through selling yet. Nonetheless, there is also no sign of bottoming and intraday bias remains on the downside. Sustained break of 1.2222 should confirm rejection from 1.2494/2516 key fibonacci level, as well as near term reversal, on bearish divergence condition in 4 hour MACD. That could also signal completion of medium term up trend from 1.0339. In that case, near term outlook will be turned bearish for 1.2091 resistance turned support first. On the upside, though, above 1.2403 minor resistance will revive bullishness and turn focus back to 1.2537.
In the bigger picture, rise from 1.0339 medium term bottom is still seen as a corrective move for the moment. But key fibonacci level at 38.2% retracement of 1.6039 (2008 high) to 1.0339 (2017 low) at 1.2516 is looking vulnerable. Sustained break of 1.2516 will carry larger bullish implication and target 61.8% retracement of 1.6039 to 1.0339 at 1.3862. Nonetheless, rejection from 1.2516 will maintain long term bearish outlook and keep the case for retesting 1.0039 alive.
Economic Indicators Update
| GMT | Ccy | Events | Actual | Forecast | Previous | Revised |
|---|---|---|---|---|---|---|
| 23:50 | JPY | Japan Money Stock M2+CD Y/Y Jan | 3.40% | 3.60% | 3.60% | |
| 00:30 | AUD | Home Loans M/M Dec | -2.30% | -1.00% | 2.10% | 1.60% |
| 00:30 | AUD | RBA Monetary Policy Statement | ||||
| 01:30 | CNY | CPI Y/Y Jan | 1.50% | 1.50% | 1.80% | |
| 01:30 | CNY | PPI Y/Y Jan | 4.30% | 4.20% | 4.90% | |
| 04:30 | JPY | Tertiary Industry Index M/M Dec | 0.10% | 1.10% | ||
| 06:45 | CHF | Unemployment Rate Jan | 3.00% | 3.00% | ||
| 09:30 | GBP | Industrial Production M/M Dec | -0.90% | 0.40% | ||
| 09:30 | GBP | Industrial Production Y/Y Dec | 0.40% | 2.50% | ||
| 09:30 | GBP | Manufacturing Production M/M Dec | 0.30% | 0.40% | ||
| 09:30 | GBP | Manufacturing Production Y/Y Dec | 1.20% | 3.50% | ||
| 09:30 | GBP | Construction Output M/M Dec | -0.10% | 0.40% | ||
| 09:30 | GBP | Visible Trade Balance (GBP) Dec | -11.5B | -12.2B | ||
| 12:00 | GBP | NIESR GDP Estimate Jan | 0.50% | 0.60% | ||
| 13:30 | CAD | Net Change in Employment Jan | 10K | 78.6K | ||
| 13:30 | CAD | Unemployment Rate Jan | 5.80% | 5.70% | ||
| 15:00 | USD | Wholesale Inventories M/M Dec F | 0.20% | 0.20% |
EURGBP – Sells Off Further, Eyes Key Support
EURGBP - The pair weakened further on Thursday leaving risk of a move lower on the cards. Support lies at the 0.8700 level where a violation will turn focus to the 0.8650 level. A break will expose the 0.8600 level. Its daily RSI is bearish and pointing lower suggesting further weakness. On the upside, resistance resides at the 0.8800 level where a violation if seen will turn risk towards the 0.8850 level. Further up, resistance resides at 0.8900 level followed by the 0.8950 level. All in all, EURGBP remains biased to the downside.
GBPUSD – Vulnerable, Risk Remains To The Downside
GBPUSD - The pair looks to weaken further as it continues to hold on to its downside pressure. Support lies at the 1.3850 level where a break will turn attention to the 1.3800 level. Further down, support lies at the 1.3800 level. Below here will set the stage for more weakness towards the 1.3750 level. Conversely, resistance stands at the 1.3900 levels with a turn above here allowing more strength to build up towards the 1.3950 level. Further out, resistance resides at the 1.4000 level followed by the 1.4050 level. On the whole, GBPUSD looks to move further lower on pullbacks.
Stocks Threatened by Bonds
In last week's piece, I asked if rising bond yields could threaten gold prices. Today's question asks whether the rise in bond yields will endanger equity indices. As I write this, US equity indices are finally posting declines of more than 5-7% from their peaks, something not seen since autumn 2015 when equity markets feared uncertainty ahead of the US presidential elections.
Unlike the major selloffs in indices of the past 2 years — which were mostly caused by worries about a China slowdown, the current market decline is the manifestation of prolonged selloff in bond markets (tumbling prices and sharp ascent in yields). The fear that rising bond yields in and out of the US will endanger companies' future profitability as well as sovereign's budget deficits.
Fundamental Arguments
We could engage in a long fundamental discussions as to whether the 45% increase in US 10 year bond yields of the past five months to its highest level in four years (2.83%) will introduce a considerably higher risk premium to stocks valuation. Some could argue that depends on sectors, size of companies' capitalisation, profitability and cash balances.
Others will indicate that 3.00% on the US 10-year yields is the more relevant level to watch because it presents a threat to the level of GDP growth as well as its role as a crucial technical level on the price charts.
Bond Yields Relative to Equity Indices
One key metric I am watching is the extent to which US bond yields have risen relative to the S&P500 index. The chart shows the SP500 / 10-year yield ratio falling to its lowest level since March 2017: Here is what it means and imply:
- The sell-off in equity indices is surpassing the selloff in bonds (advance in bond yields), in a manner not seen since summer 2016.
- Over the last 5 years, the chart shows there have been three episodes when stocks fell sharply relative to bond yields (Spring-Summer 2013, Spring 2015 and Summer-autumn 2016), each of which was brought about by an aggressive liftoff in bond yields. The catalysts to those gains were fears of faster tightening from the Federal Reserve, improved inflation data outside the United States bringing causing fears that central banks other than the US Federal Reserve will also be tightening monetary policy.
- Taking a closer look at the chart, we note that head-&-shoulders formation (technical analysis) is underway. If the pattern is valid, then it could portend further sharp declines ahead, with sombre implications for the price of equity indices. A 3% print on yields is highly likely at this point, in which case could extend the S&P500 to 2450 on the S&P500 from the current level of 2666.
Bank of Canada’s Wilkins Worries about the Inequality Implications of Technology
The Bank of Canada's Senior Deputy Governor, Carolyn Wilkins, spoke at the G7 Symposium on Innovation and Inclusive Growth. Her speech reflected the theme of the symposium, focusing on the inequality of growth and other challenges associated with recent technological innovations.
Wilkins pointed out that the world has enjoyed a significant run of economic growth and associated reductions in international poverty over the last 70 years, thanks to ongoing advancements in technology. But, at the same time, inequality has risen in advanced economies, which can result in sub-optimal economic outcomes. More shocks appear to be on the horizon, with nearly half of tasks currently done by workers potentially becoming automated using technology that exists today.
The speech was broken into three key areas of discussion:
- That the technologies may be different, but innovation is not new, and lessons can be drawn from the past. Experience suggests that rising inequality comes from the characteristics of innovations: First, technology tends to benefit skilled workers, leading to divergent labour market outcomes. Second, some forms of technology lead to rising market concentration and 'superstar' firms – the classic example are early telephone monopolies, but in the modern context, data can be used as a source of monopoly power, while digital products make taxation more challenging. And finally, that technology has also made it easier to separate work into discrete tasks, enabling greater use of short-term jobs to maintain flexibility.
- These implications don't have to hold. That is, policymakers (though, not the Bank of Canada) can help address these negatives through increasing the skills of their workforces, including on-the-job training. The technology itself can also serve to improve outcomes: workers with disabilities (roughly 10% of the labour force across the G7) represent a largely untapped resource, but new technologies, such as chat and email have already made workplaces more accessible, while other technologies such as self-driving cars may improve mobility.
- We are unlikely to get the full benefits of innovation if market power is left unchecked. Particular focus was given to the tech industry, where firm concentration raises potential concerns regarding monopoly power. Data in particular are seen as creating a potential 'wall', reducing firm creation and market contestability. Wilkins suggests that solutions may lie in the modernization of anti-trust policy, changes in the treatment of user data ownership, and potentially, patents. Also of concern are the growing operational risks posed by the concentration of service providers in areas such as cloud services, which have traditionally fallen outside of current regulatory areas.
Bringing it closer to home, the Senior Deputy Governor suggested that regulators can follow the Bank of Canada's lead in testing and implementing new technologies, both to understand and benefit from them.
Key Implications
If you were looking for guidance on the path of interest rates, this was not a speech for you. That said, while this speech may not have been typical fare for the Bank of Canada, it was nonetheless an excellent discussion, providing a fascinating insight into how the Bank of Canada thinks about the implications of ongoing technological advances and how policymakers might respond.
Today's speech is also of particular note as the next Federal budget is likely not far away, and likely to focus on addressing similar themes, notably inclusive growth. To the extent that the government is communicating with the Bank of Canada on these issues, the advice they'd receive hews closer to a European-style, interventionist bent, rather than a more laissez-faire approach.
These issues are complex, and many potential solutions exist, although some may debate whether some of these outcomes are problems at all. Ultimately, there is likely one piece of advice that all will agree on: gaining hands-on knowledge of and experience with new technologies is bound to lead to more informed, and thus better, decision-making.
Hawks Coming Home to Roost
Equity markets were trounced on the back of Global yields parading to multi-year highs Thursday. Indeed, it was less dovish Fed speak that continued to be the driver, and the BoE provided a hawkish bounty for good measure.
The ruckus in the bond pits these days appears hell-bent on marching towards 3 % 10Year UST yields much quicker than anyone had suspected which suggest equity markets will come under the hammer for some time to come. Yields are becoming the real storyline as a combination of tighter monetary policy and the US burdening deficit leading to more supply, suggests we have crossed a 2.75 % 10Y UST bridge of no return, and the ride could get bumpier for equity investors.
The issue is not so much the 3% level but rather the pace that Bond yields have been rising in the US that is sending the markets into disarray. The rapidity of the moves has caught the markets by surprise, and we are going through the predictable panicked repricing of most asset classes.
Oil Markets
Crude prices continued to tank overnight as the commodity complex has suffered dearly due to the uptick in market volatility. But the toxic combination of rising US output and a stronger US dollar has nullified OPEC production cut momentum.
With the markets factoring in US crude production to continue hitting new record highs through 2018, the supply dynamics suggest a move below $ 60 WTI is in the offing.
Gold Markets
Gold toppled to a five-week low after the Bank of England whispered a sooner and more substantial rate rises after revising their growth and inflation forecast. The quicker than expected shift on Central Bank Monetary Policy outlooks coupled with the rapid increase in US bond yields continues to dampen investor sentiment. However, Gold prices quickly recovered as the equity market drawdowns continue to attract risk off hedges while the Syria Standoff with Turkey is offering support on the geopolitical front.
Currency Markets
The Australian Dollar
The rise in US bond yields has toppled the Aussie dollar and dented risk sentiment as global equity market continues to tumble.
Market volatility is weighing negatively on commodities, add in a dose of dovish RBA rhetoric, and therein lies the heart of the Aussie dollar woes.
Also, the Aussie was trampled on when USDCNH shot up from 6.3050 to 6.3750 as it seems that China is opening up more channels for outflows to slow RMB appreciation. (See below)
The Aussie dollar tends not to flourish in these types of markets.
The $ Bull in the China Shop: Chinese Yuan
The dollar bull was let loose in the China shop yesterday as a confluence of events had trader paring back short US dollar risk from the morning fix.
The fix came in a bit higher than expected which usually causes a bit of a move higher but, it was the article in China Economic Daily that was creating the most noise as the report urges corporates to enhance FX risk management. (Nudge Nudge) China has also resumed its Qualified Domestic Limited Partnership plan after a two-year halt, granting licenses to about a dozen global money managers that can raise funds in China for overseas investments. While it does not have a massive Foreign Exchange flow impact, and more symbolic than anything else, it is none the less suggestive that the Pboc is less sensitive to capital outflow
Given that positions were skewed short US dollar, the confluence of events had traders covering positions aggressively knowing that liquidity will be sure to dry up the closer we get to Lunar New Year.
The China trade numbers were perceived disappointing ( I have opposite view) which contributed to some currency negativity.
But from any logical perspective, it was hard to ignore the Mainland equity fire sales this week which certainly had a negative bias on currency sentiment
The Malaysian Ringgit
Negative regional currency signals abound.
The rapid repricing higher in US bond yields has taken investors by surprise. Moreover, with US yields looking to push higher, we could be in for a bit more pain before the markets find some solid footing.
Higher US yields are supporting the USD and weighing on global equity sentiment which is hurting overall regional risk appetite.
US record crude production continues to weigh negatively on oil prices.
The proximity of Chinese Lunar New year has traders paring back risk.
The market, at least for now, is hedging against the Fed potentially leaning more hawkish, which is explaining the uptick in USD, US Yields and lower equity markets.
Pound Gains Ground as BoE Hints at Rate Increase
The British pound has posted gains in the Thursday session, erasing the losses seen on Wednesday. In North American trade, GBP/USD is trading at 1.3919, up 0.29% on the day. On the release front, the Bank of England maintained interest rates at 0.50%, but hinted at earlier and larger rate hikes. In the US, unemployment claims dropped to a sparkling 221 thousand, well below the estimate of 232 thousand.
The BoE was in the spotlight on Thursday. The Bank made no changes to interest rates or quantitative easing, and both moves were unanimous (9-0). There was some surprise however, at the hawkish tone of policymakers, who said that interest rates could rise "earlier" and by a "somewhat greater extent" than they predicted at their previous meeting in November. Bottom line? We could see an interest rate in the first half of 2018, with analysts circling May as the most likely date. At the same time, the effect that Brexit is having on the economy is difficult to predict, and if the economic conditions worsen, the BoE could delay a rate hike.
It's been a rough week for the pound, which is down 1.5 percent. The US dollar has posted gains against the pound and the other majors, after a massive sell-off on global stock markets on Monday. The sell-off was precipitated by strong US nonfarm payrolls and wage growth reports on Friday. This triggered concerns that higher inflation was on the way, which in turn would result in more rate hikes this year. Higher interest rates make the dollar more attractive for investors, at the expense of other currencies. If the turbulence in the stock markets continue, the pound could resume its downward movement.