
Sample Category Title
GBP/USD Technical: BoE’s Hawkish Cut Priced In, But GBP Bulls Now Approaching Key Resistance
- GBP/USD has rallied by 2.1% from Monday, 3 February swing low.
- The 2-year yield premium shrinkage between UK sovereign fixed income over the US Treasury Note may trigger a bearish reversal on the GBP/USD.
- Watch the key medium-term resistance of 1.2610 on the GBP/USD.
Since its swing low of 1.2249 printed on Monday, 3 February, the GBP/USD has rallied for three consecutive sessions with a gain of 2.1% and hit an intraday high of 1.2550 on Wednesday, 5 February.
UK-US trade deal optimism and BoE’s gradual approach in cutting rates support a recent firmer GBP
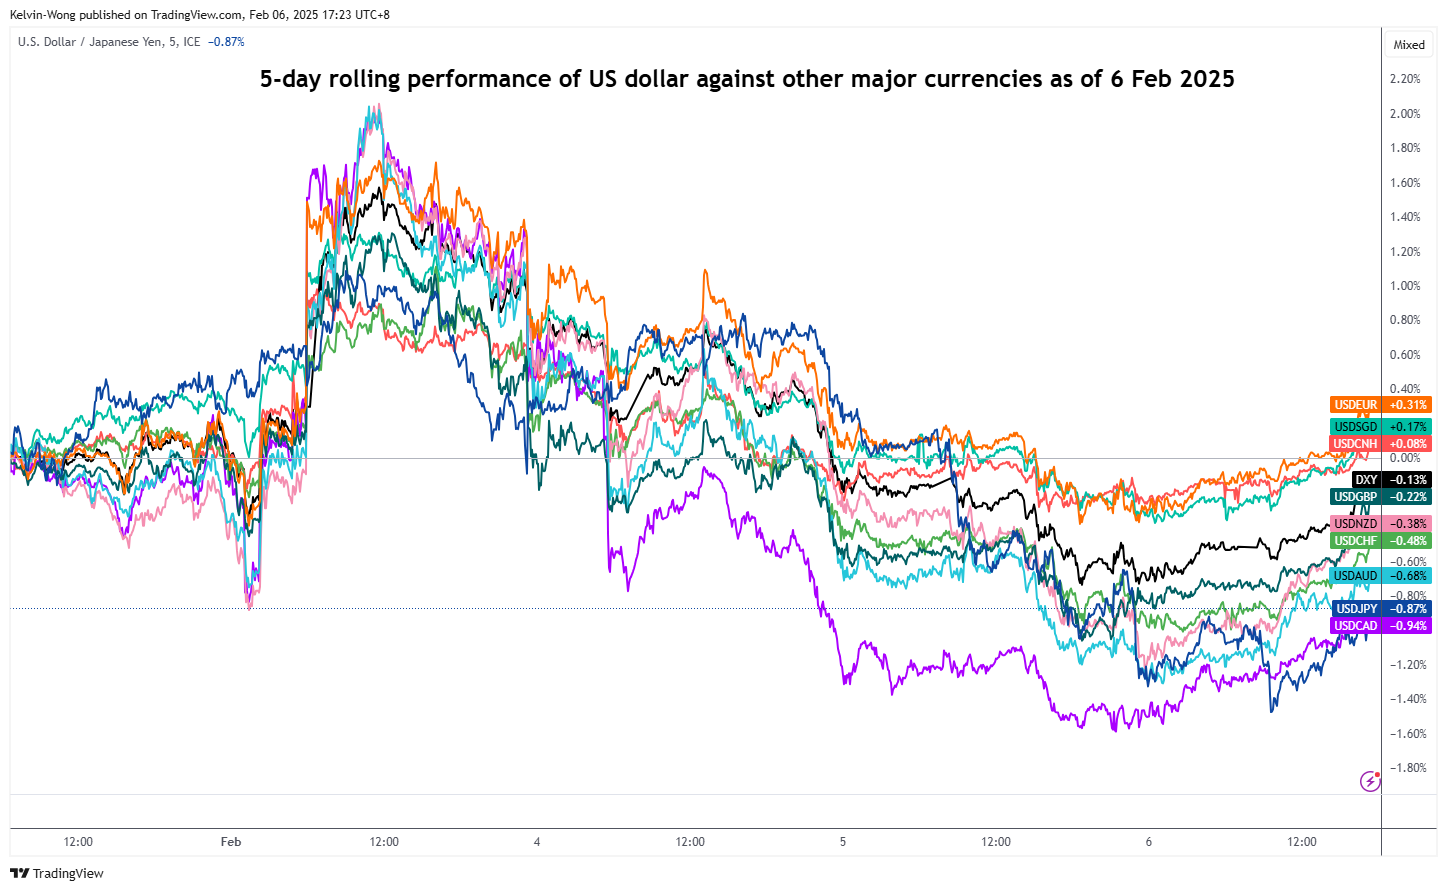
Fig 1: 5-day rolling performance of US dollar against major currencies as of 6 Feb 2025 (Source: TradingView, click to enlarge chart)
The recent push-up in the GBP/USD has been attributed to two key factors. Firstly, on the ongoing trade tensions between the US and its major trading partners, US President Trump has remarked that a potential trade deal could be worked out between the US and the UK which has lowered the odds of US trade tariffs being imposed on UK goods.
Secondly, it is now widely expected that the Bank of England (BoE) will likely enact its third interest cut of 25 basis points since August last year on Thursday, 6 February to bring the policy bank rate down further to 4.5%.
Interestingly, the market participants seem to be pricing in some form of “hawkish cut” in today’s BoE monetary policy decision as its new economic forecasts for the UK economy may see a downgrade on growth prospects for 2025 while inflation pressures face the risk of an upside revival due to UK Chancellor Reeves’s recent expansionary budget.
Therefore, these potential lowered growth and higher inflation forecasts are likely to reinforce stagflation fears in the UK economy, in turn raising the likelihood of BoE adopting a “gradual approach” stance towards loosening monetary policy in the near term.
GBP/USD at risk of bearish reversal below 1.2610
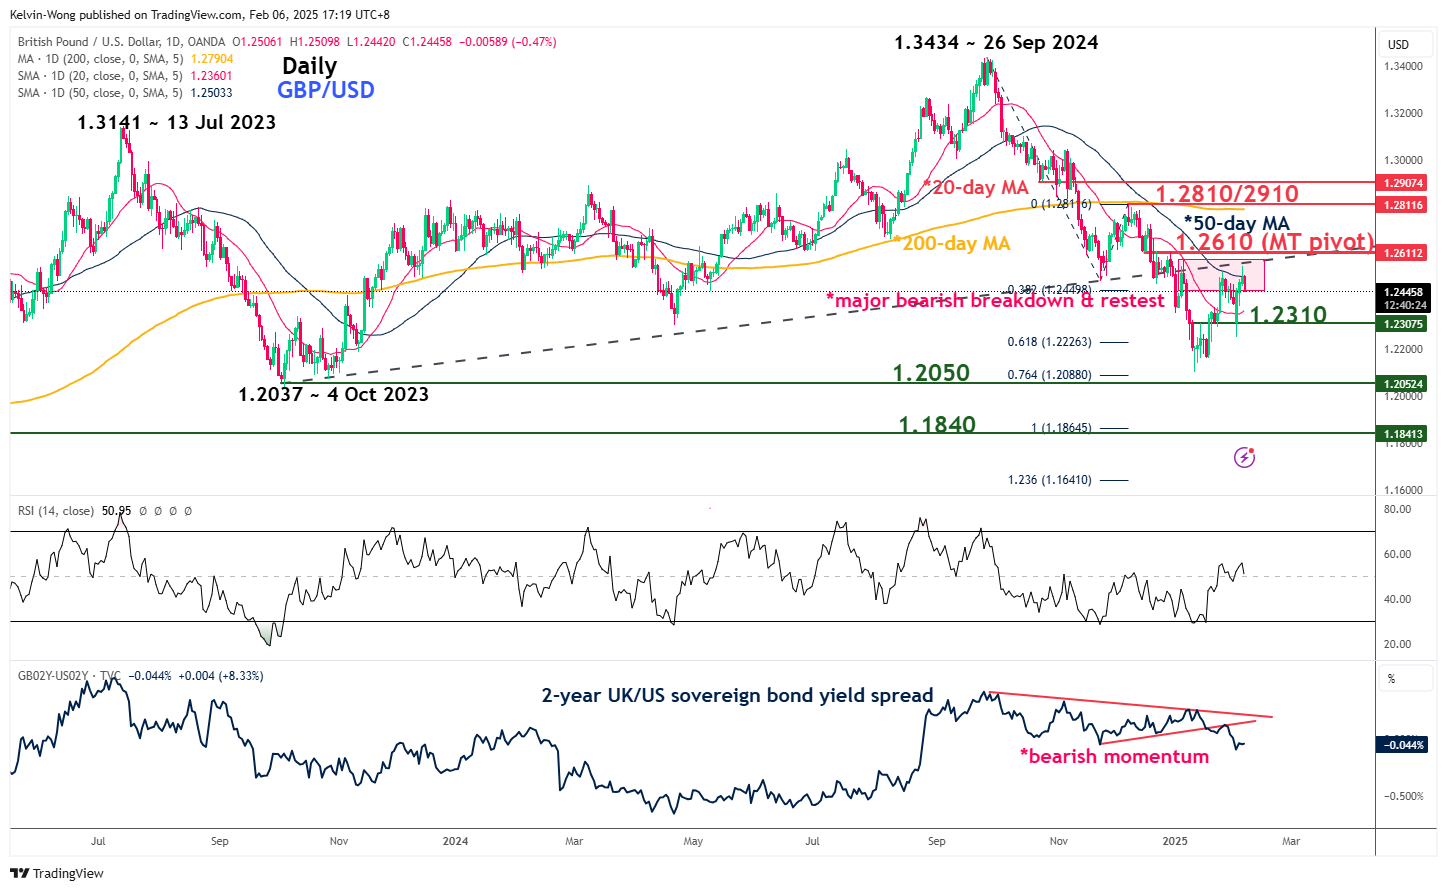
Fig 2: GBP/USD medium-term trend as of 6 Feb 2025 (Source: TradingView, click to enlarge chart)
On the contrary from a technical analysis standpoint, the recent multi-week rebound seen in the GBP/USD from its 13 January swing low of 1.2100 is likely to be a corrective upmove sequence within its medium-term downtrend phase that remains intact.
Intermarket technical analysis using the yield spread between the 2-year UK sovereign bond over the 2-year US Treasury Note has flashed a bearish momentum condition which suggests that there are higher opportunity costs of holding onto medium-term UK fixed income instruments versus US fixed income due to a potential reduction in UK yield premium (see Fig 2).
These observations suggest the British pound may continue to see further downside pressure against the US dollar in the medium term.
Watch the 1.2610 key medium-term pivotal resistance, and a breakdown below 1.2310 support suggests a potential continuation of its impulsive down move sequence to expose the next medium-term supports of 1.2050 and 1.1840 over a medium-term horizon (multi-week).
However, a clearance above 1.2610 invalidates the bearish scenario for a squeeze up towards the long-term pivotal resistance zone of 1.2810/2910 (also the 200-day moving average & 61.8% Fibonacci retracement of the medium downtrend phase from 26 September 2024 high to 13 January 2025 low).
GBP/USD at a Crossroads as BoE Rate Decision Looms
- GBP/USD stabilizes near 50-SMA as traders await BoE rate cut.
- Technical signals cannot guarantee bullish continuation.
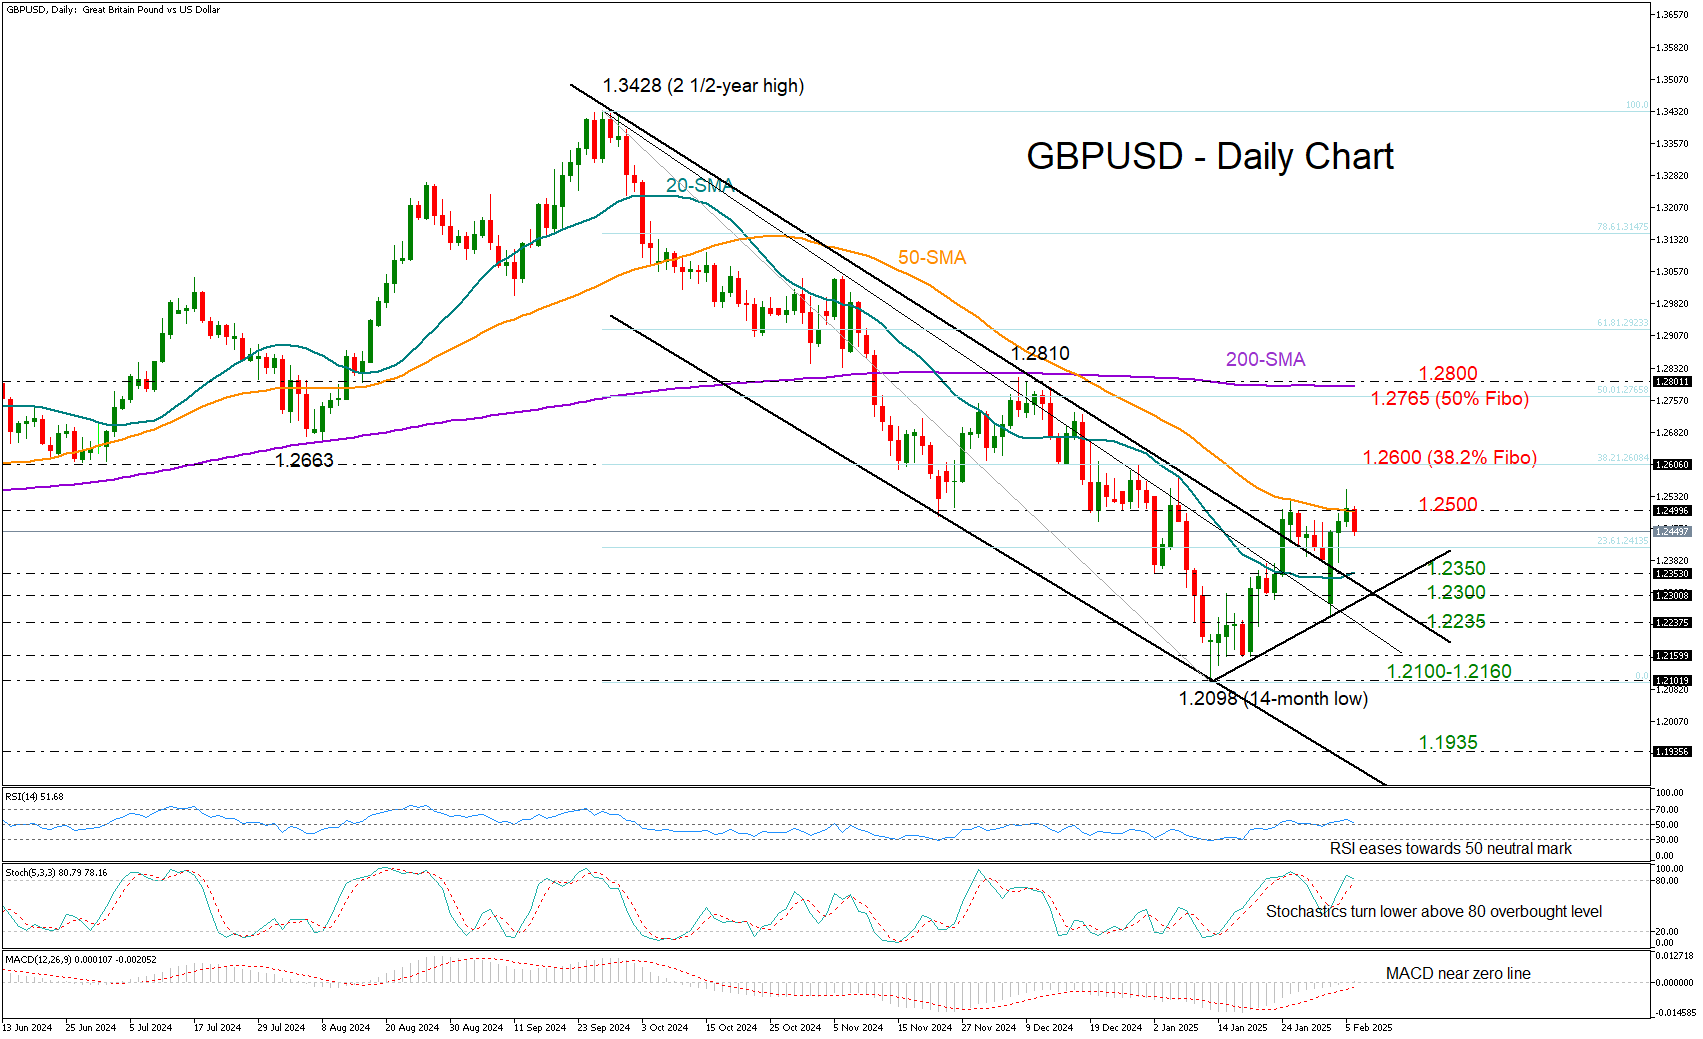
GBP/USD is facing a pivotal moment near the 1.2500 round level and its 50-day simple moving average (SMA) just a few hours before the Bank of England’s policy announcement at 12:00 GMT. A decisive break above this psychological barrier could fuel optimism that the recent rebound from the 14-month low of 1.2098 is something more than a fleeting recovery.
From a technical standpoint, caution is warranted as the rise in the RSI seems fragile and the Stochastic oscillator is already near its 80 overbought level, hinting at easing buying interest. If the bears take over, the price could slide towards the 20-day SMA at 1.2350 and then retest the support trendline from January at 1.2300. A continuation lower and beneath 1.2235 could target the crucial area of 1.2100-1.2160.
If the bulls successfully claim the 1.2500 border, the next barrier could lie around the 1.2600 mark, which overlaps with the 38.2% Fibonacci retracement of the latest downtrend. A step higher could trigger a fast rally towards the 50% Fibonacci of 1.2765 and the 200-day simple moving average (SMA).
In brief, GBP/USD is searching for a fresh bullish catalyst to extend its recovery and shift the trend decisively upward. A clear close above 1.2500 could bring new buyers into the market, while a drop beneath 1.2300 may increase selling activity.
Bitcoin Strengthens as Crypto Falls
Market Picture
The cryptocurrency market is in no hurry to recover. Trading near $3.3 trillion in capitalisation, the crypto market is consolidating at a lower level. Before that, there was consolidation near $3.5 trillion, and a fortnight ago, it was just below $3.8 trillion.
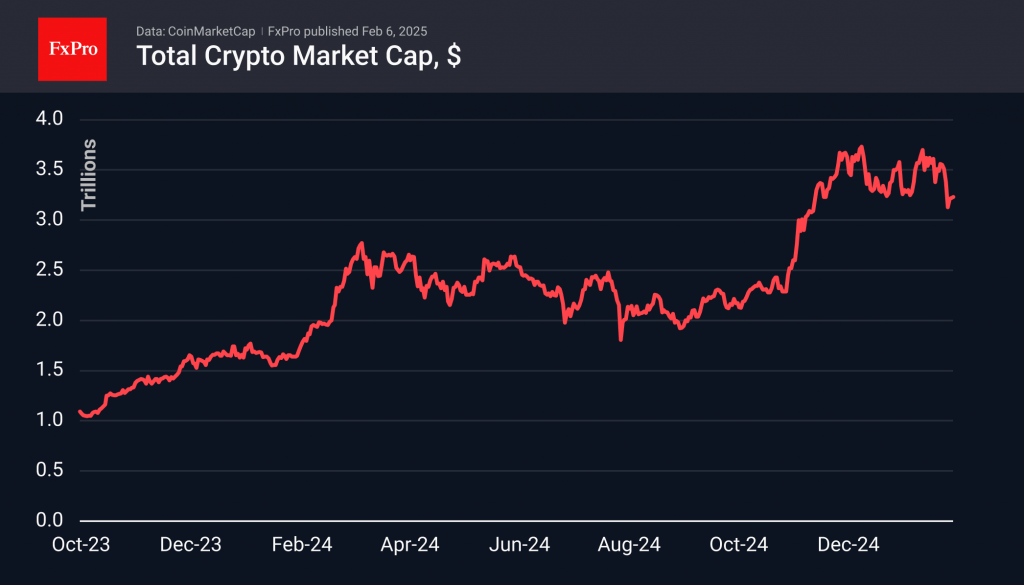
It looks like we saw another ‘sell on fact’ as growth stopped after Trump’s inauguration, which crypto enthusiasts were optimistic about. The sentiment index rolled back into neutral territory by the end of the first week of February.
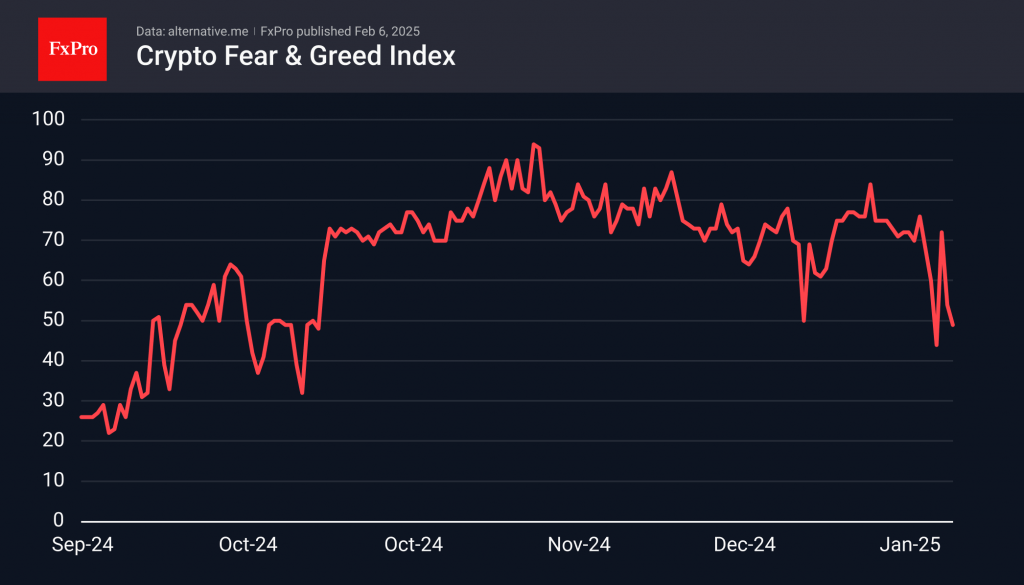
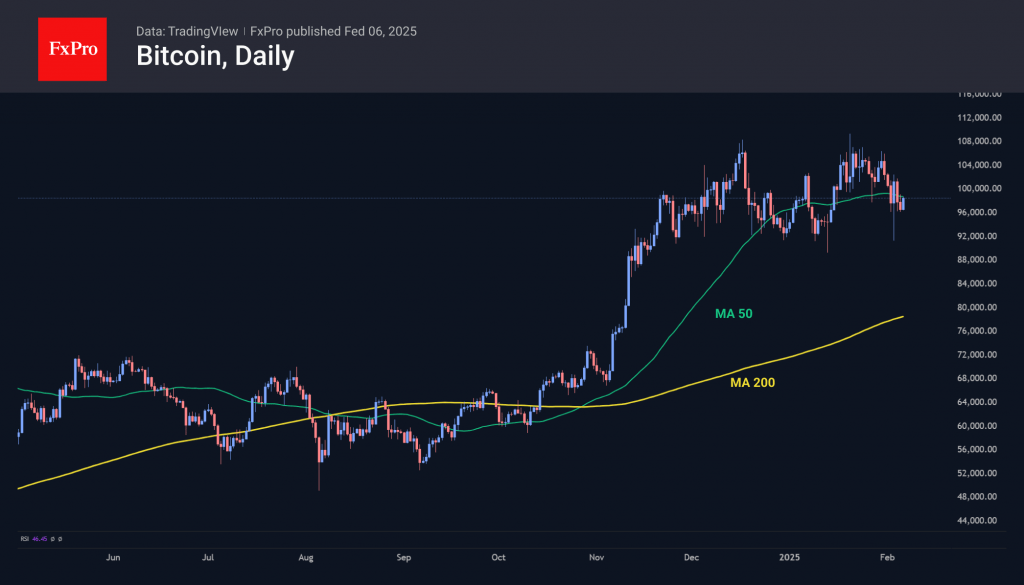
Bitcoin is trading at 98,500, having lost over 6% in the last seven days. The bulls failed to organise a quick rebound after Monday’s collapse. Corporates and private speculators seem to be buying BTC during downturns. It is not enough to refresh historical records, but it is causing Bitcoin’s dominance to grow above 60%—the highest since March 2021.
News Background
Crypto investors are frustrated by the lack of progress on creating a US Bitcoin reserve. The day before, David Sachs, head of the Digital Asset Markets Task Force, called the evaluation of creating a Bitcoin reserve a priority but did not provide details.
Former BitMEX exchange head Arthur Hayes said the US, China and other nations will soon be forced to print money, driving Bitcoin to new records.
El Salvador has bought 20 more BTC over the past week, taking advantage of the price drop. On 4 February, the country bought 11 BTC at once, bringing the national bitcoin stockpile to 6,067 BTC.
Technology company Semler Scientific also continues to add to its Bitcoin reserve. It has purchased 871 BTC in the past three weeks and has a total of 3,192 BTC.
Ethereum issuance has grown to 120,521,725 ETH. Comparable levels were last seen in September 2022, before The Merge update. The rise in supply casts a shadow on the narrative of Ethereum as a deflationary asset.
A bill has been introduced in the U.S. Senate to regulate stablecoins, which could boost demand for U.S. Treasuries and spur financial innovation.
USD/CAD Exchange Rate Stabilises
As we reported on 3 February, the decision by the US president to impose 25% tariffs on goods imported from Canada sent the USD/CAD rate soaring to a 22-year high.
However, after a round of negotiations between Donald Trump and Justin Trudeau, the tariff implementation was postponed by a month, which was reflected in the USD/CAD exchange rate chart.
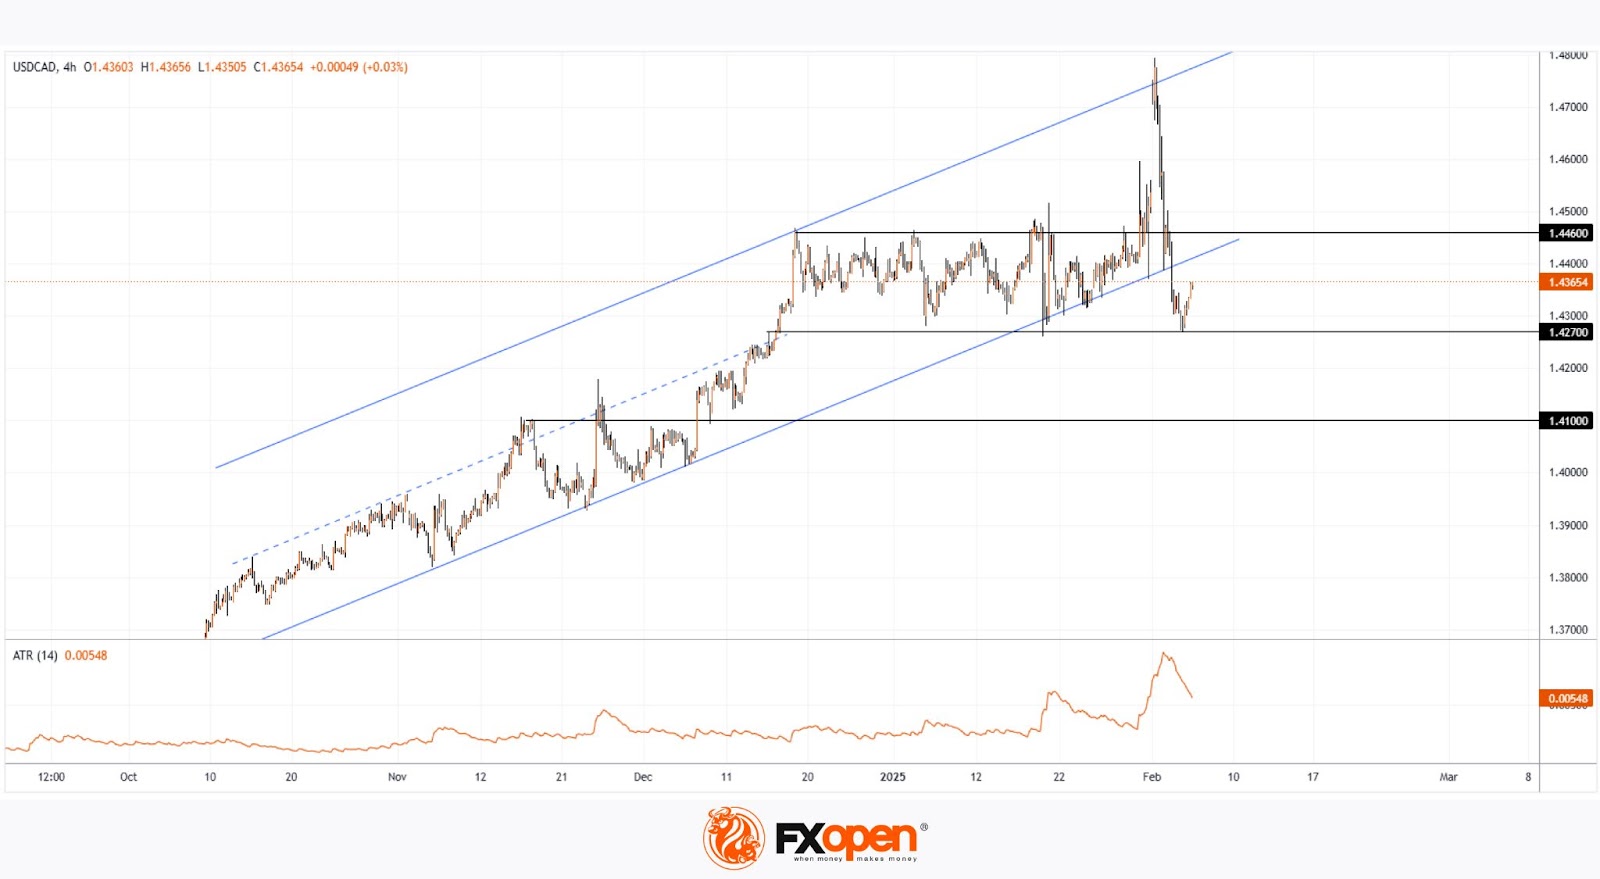
Current USD/CAD Chart Analysis:
→ The price has retreated from the upper boundary of the ascending channel identified three days ago and has now dropped below its lower boundary.
→ The price has returned to and remains within the broad 1.4270 – 1.4460 range.
→ The ATR indicator has reversed from its peak and is trending downward.
Given these factors, it is reasonable to say that USD/CAD is stabilising after recent volatility. But what lies ahead?
The exchange rate may fluctuate within the 1.4270 – 1.4460 range, reacting sensitively to any news on Trump’s tariff policies and his startling suggestion of making Canada the 51st US state.
Trade over 50 forex markets 24 hours a day with FXOpen. Take advantage of low commissions, deep liquidity, and spreads from 0.0 pips. Open your FXOpen account now or learn more about trading forex with FXOpen.
This article represents the opinion of the Companies operating under the FXOpen brand only. It is not to be construed as an offer, solicitation, or recommendation with respect to products and services provided by the Companies operating under the FXOpen brand, nor is it to be considered financial advice.
Eurozone retail sales falls -0.2% mom in Dec, EU down -0.3% mom
Eurozone retail sales slipped by -0.2% mom in December, missing market expectations of -0.1% decline and pointing to continued weakness in consumer demand. The drop was largely driven by -0.7% contraction in food, drinks, and tobacco sales, while non-food products saw a modest 0.3% increase. Automotive fuel sales in specialized stores also ticked up 0.2%, providing some offset to the broader decline.
At the EU-wide level, retail sales fell even further, down 0.3% mom. The country-level breakdown highlights stark contrasts in retail activity. Slovenia (-2.2%), Germany (-1.6%), and Poland (-1.5%) saw the sharpest contractions, while Slovakia (+8.2%), Finland (+2.1%), and Spain (+1.4%) registered solid gains.
GBP/USD Analysis: Bank of England Decision Looms – What to Expect?
- The Bank of England (BoE) is expected to announce a 25 bps rate cut on February 6, 2025.
- Weak UK Data and ongoing trade war and geopolitical risks pose threat to BoE policy.
- Key levels to watch are 1.2500 (resistance) and 1.2466 (support).
- Governor Bailey comments and press conference are key to future policy hints.
The Bank of England (BoE) is set to announce its latest monetary policy decision on February 6, 2025, in what is shaping up to be one of the most closely watched meetings in recent months. The central bank faces a delicate balancing act as it navigates a mix of economic challenges and opportunities.
The seesaw price action experienced by the British Pound over recent weeks was initially down to uncertainty surrounding Britain’s inflation, interest rate and fiscal challenges. That is not to downplay the US and its role in the recent uncertainty in global markets.
What is Expected from the Bank of England (BoE)?
According to LSEG Workspace data, market participants are pricing in a 97% probability of a 25 bps cut tomorrow. Such a move would hardly come as a big surprise for anyone following developments in the UK over the past few months.
The bigger question will be whether the outlook moving forward will strike a dovish tone which could see the British Pound surrender some of its recent gains. I am not sure if such a statement will materialize though, largely on the back of a shaky jobs market and the prospect of lower services inflation.
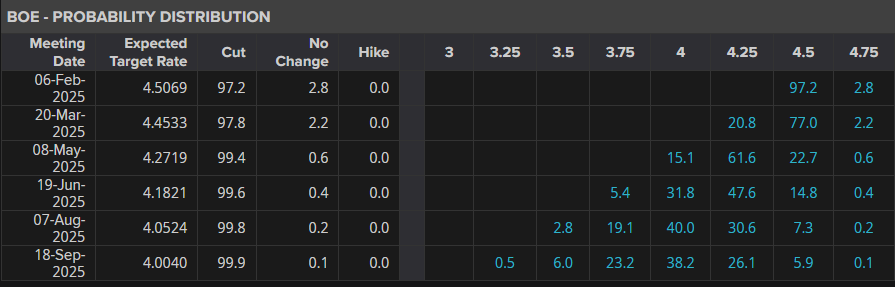
Source: LSEG
If the BoE delivers a 25 bps cut and discusses any further cuts as being gradual and the number of cuts to be expected in 2025, the market reaction could be relatively muted. A definitive change in stance with any hint regarding speeding up of rate cuts could send the British Pound sliding.
At this stage, market participants are pricing in around 83 bps of cuts through December 2025, however a dovish message by Governor Bailey and this could increase to markets expecting a rate cut every quarter. This would mean 100 bps of cuts in 2025.
UK Data and the Picture it Paints
Inflation in services, a key focus for the BoE, dropped a lot in December. This could be temporary since it might rise back to 5% in January, but overall, it is clearly going down. By the second quarter, it’s expected to fall below 4%, and it’ll look even better once less important categories are excluded.
The jobs market is also showing signs of weakness. Private-sector employment slowly dropped in 2024, and job openings have decreased a lot. While wage growth has been stubborn, surveys suggest it will slow down as the year progresses.
These factors certainly paint a picture that may require further rate cuts. Now of course there is the shadow of a potential trade war which could kick off another round of inflation and play a role in BoE decision making going forward.
On the geopolitical side we still do not have a resolution in Russia-Ukraine while President Trump’s call for Gazans to be moved has added a fresh new dimension to the Middle East as well. A further deterioration in these conflicts could lead to sticky inflation rearing its ugly head once more.
Technical Analysis – GBP/USD
From a technical point of view, Cable has staged an impressive recovery this week.
Following a gap lower over the weekend on tariffs being implemented, the British Pound has gained around 300 pips against the greenback, peaking yesterday at 1.25500 before pulling back to trade below the 1.2500 psychological level.
Looking at the daily chart below and as you can see the medium-term descending trendline remains intact thanks to Monday’s swift recovery.
A daily candle close above the 1.2500 handle may embolden bulls but if any move is to take place, it will likely come after the BoE meeting.
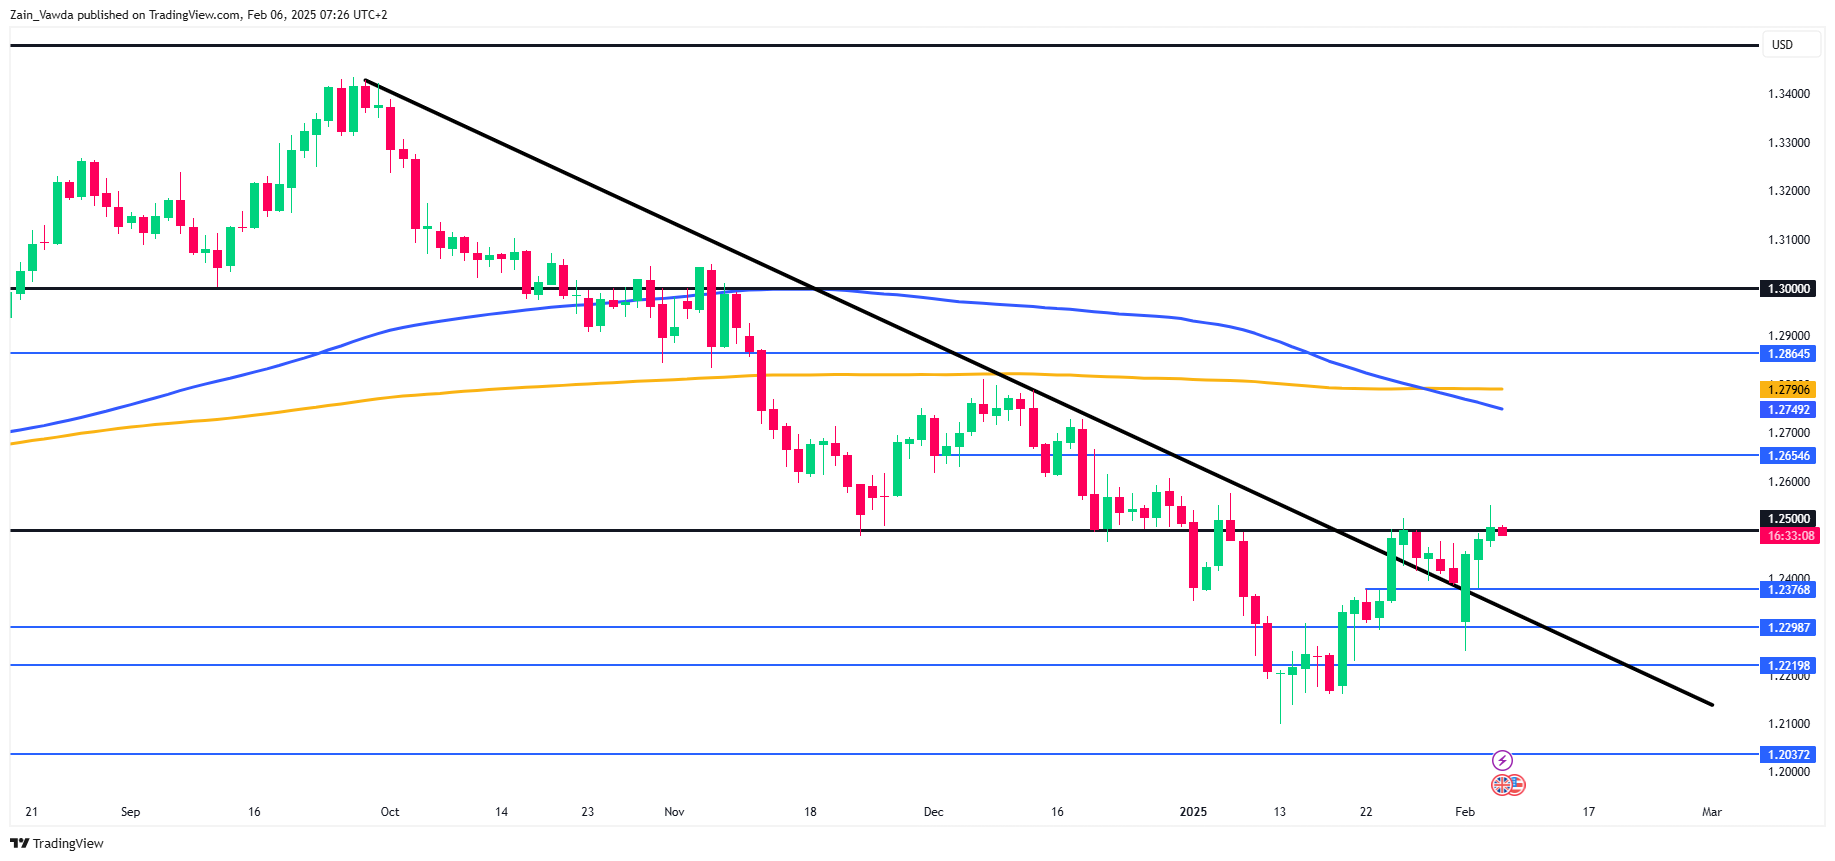
Source: TradingView (click to enlarge)
Dropping down to a H4 and the bullish trend remains intact without a four-hour candle close below the 1.2466 handle.
A close below this handle will result in a change of the four-hour structure and open the door for bears to push price toward support at 1.2400, where the 200-day MA rests.
The possibility of a deeper correction toward 1.2350 may provide a better risk to reward opportunity for potential bulls should it materialize. I expect that barring any surprises today, for any moves relating to GBP/USD to remain short-lived.
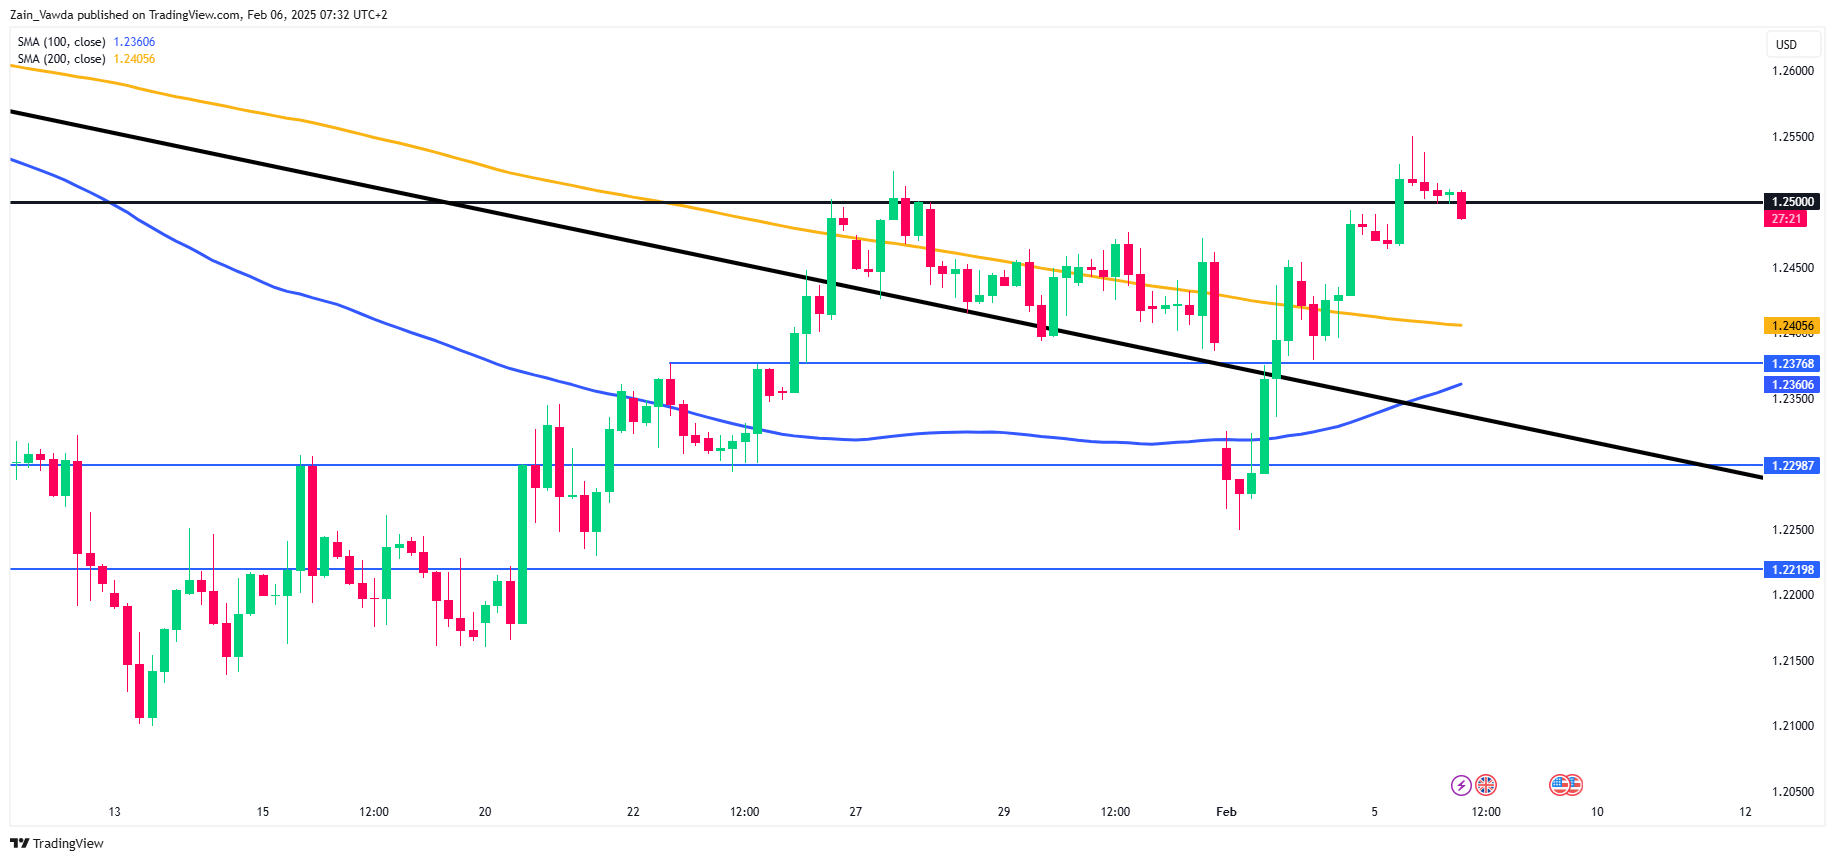
Source: TradingView (click to enlarge)
Support
- 1.2466
- 1.2405
- 1.2360
Resistance
- 1.2550
- 1.2750
- 1.2864
USDCAD: Rebound
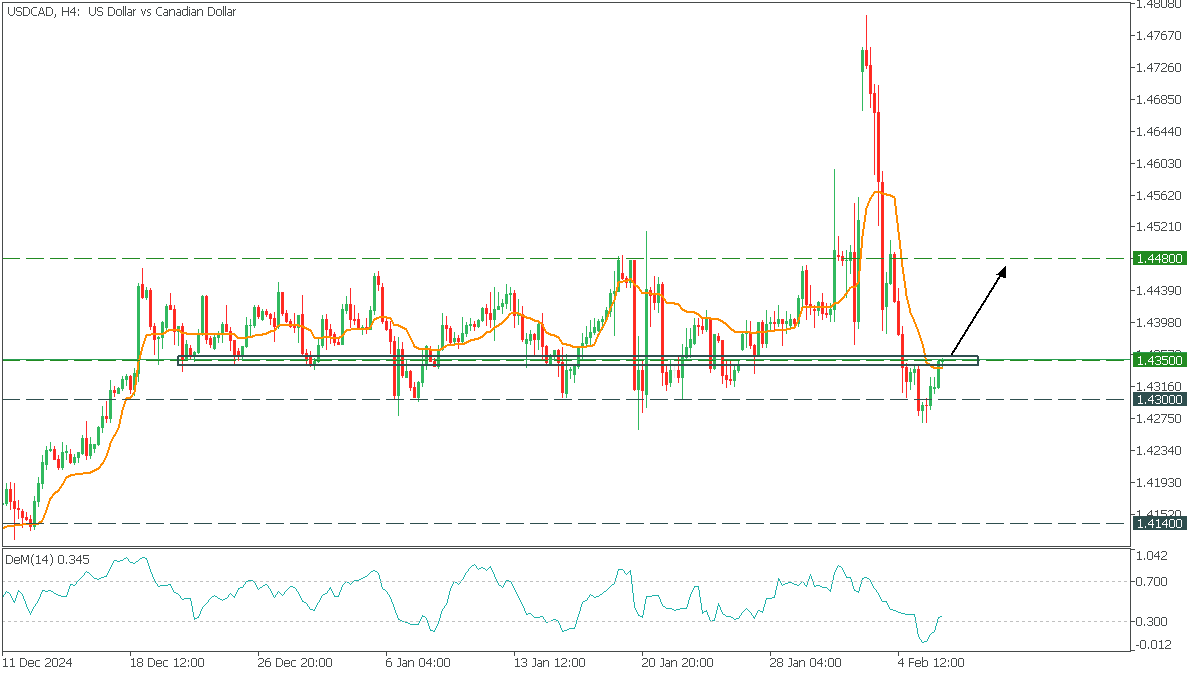
USDCAD, H4
On the H4, USDCAD, after a sharp fall, reached a critical support area and rebounded. DeMarker came out of the oversold zone, which makes a slight rise possible on a break above the AMA.
- We may consider buying USDCAD on a break above 1.4350 with a target of 1.4480;
ECB’s Cipollone open to March cut, flags risks of full US-China trade war
ECB Executive Board member Piero Cipollone indicating that while "there is still room for adjusting rates downwards", the March decision remains uncertain. He stated that ECB must be "extremely careful" in its assessment, and he will enter the meeting "with an open mind".
Discussing the concept of the neutral rate in a Reuters interview, Cipollone downplayed its practical significance in policy setting. He pointed out that when estimates for the neutral rate vary widely—such as between 1.75% and 2.25%—it becomes "not terribly useful for setting monetary policy." If ECB operates near either end of the range, it could risk either undershooting or overshooting its inflation target.
Cipollone also raised concerns about the evolving global trade situation. The immediate impact of US tariffs depends on European retaliation and specific product categories affected, He warned that a "full trade war" between the US and China poses a more significant threat.
With China accounting for 35% of global manufacturing capacity, broad trade restrictions could flood European markets with Chinese goods. This would create a dual challenge— "deflationary" pressures from lower-priced imports and a "contractionary" effect as European producers struggle to compete.
US Treasury Kept Current Auction Sizes at Unchanged Levels
Markets
US Treasury Secretary Bessent seems to manifest himself as the voice of reason for US President Trump’s chaotic, sometimes illogic, burst of thoughts. In an interview with Fox Business he elaborated on/clarified themes like the ones spelled out by Trump in his WEF-address when he urged OPEC+ to lower oil prices and suggested to be doing a better job than Fed Chair Powell at the helm of the Fed. Centre piece in Bessent’s reasoning remains the 3-3-3 programme which he put forward in the run-up to last year’s elections: getting the fiscal deficit down to 3% of GDP from above 6% in recent year, lifting oil production by 3mn b/d and achieving economic growth of 3%. Getting gasoline and heating oil prices down is key as the energy component is one of the surest indicators for long-term inflation expectations. Consumers will not only be saving money, but their optimism for the future will help them rebuild from the years of high inflation, he argues. Bessent and Trump’s focus is on the 10-year Treasury (yield) according to the Treasury Secretary, rather than the Fed’s benchmark rate. “He (Trump) is not calling for the Fed to lower rates”. Bessent doesn’t say it out loud, but that’s what eventually will happen if they manage such growth rates in a non-inflationary environment resulting in a “good interest-rate cycle”. The final pillar in helping long term bond yields lower is DOGE. “We cut the spending, we cut the size of the government and we get more efficiency in government.” Bessent even takes it one step further by suggesting that the bond market is already recognizing the above-mentioned ploy. While long term US Treasuries effectively outperformed since Trump’s inauguration (bull flattening with front end losing around 15 bps and very long end up to 25 bps), we must add that this is solely due to a drop in real rates while inflation expectations remained sticky just below 2.5%. Our reading (from the bond market) at the moment is one where investors start contemplating a scenario in which Trump’s explosive policy mix risks backfiring to the US economy at a moment when the Fed committed itself to a more/too hawkish monetary policy to fend off inflationary threats (which might end up hurting the economy even more). Some early growth worries are causing the correction in LT bond yields rather than anticipation on a less restrictive monetary policy or a shift lower in inflation expectations. It’s still too early days to draw any firms conclusions with Trump known to be very sensitive to economic growth/the stock market and the administration still having some aces up their sleeves like making 2017 tax cuts permanent.
News & Views
US Treasury kept the current auction sizes at unchanged levels for the February to April quarter in the updated quarterly refunding statement released yesterday. It believes they “leave it [the US Treasury] well positioned to address potential changes to the fiscal outlook and to the pace and duration of future SOMA redemptions” adding that based on the current projected borrowing needs it anticipates maintaining these auction sizes for at least the next several quarters as well. Treasury will kick off the funding quarter with a combined $125bn sale next week, consisting of a $58bn 3-yr, $42bn 10-yr and a $25bn 30-yr Note sale. It plans to maintain the February 30-yr TIPS new issue auction size ($9bn) but increase the 10-yr auction size in March as well as the 5-yr one in April to $18bn and $25bn respectively. In terms of buybacks, Treasury anticipates that over the course of the upcoming quarter it will purchase up to $30bn securities across buckets for liquidity support and up to $59.5bn in the 1-month to 2-year bucket for cash management purposes.
Italy’s budget watchdog UPB lowered growth estimates for the country from 1% to 0.8% this year. It also marginally clipped the 2024 estimate from 0.8% to 0.7%. This compares to the 1% for 2024 and 1.2% in 2025 that the Italian Treasury had penciled in. UPB said the downward revision mainly followed on higher gas prices and trade tensions with the risk of US tariffs for Europe looming. Italy is also particularly vulnerable to energy shocks since it imports around 95% of annual gas consumption. Treasury will be reviewing its growth estimates in April. Preliminary growth figures released end-January showed the Italian economy stagnating in Q4 for the second quarter straight.
JPY: Is This The Time It Sticks?
Sentiment across Europe and the US improves on waning trade tensions with the US. Most major indices ended the session in the green, but gains in the US were questionable due to the underwhelming set of earnings from big companies including Google, AMD and Ford, and a better than expected ADP report that showed that the US economy added 183’000 new private jobs in January, comfortably more than around 148’000 pencilled in by analysts, meanwhile the S&P’s services and composite PMI numbers hinted at a faster-than-expected growth in the US activity in January. Happily, for the Federal Reserve (Fed) doves, the ISM numbers looked softer-than-expected and along with the US Treasury’s announcement that it does not anticipate increasing auction sizes for nominal coupon and floating-rate notes ‘for at least the next several quarters’ gave relief to bond traders and sent the US 10-year yield 12bp lower, the 2-year yield eased as well. As such, the S&P500 gained 0.39% with around 350 companies eking out gains, Nasdaq 100 extended gains despite disappointment in Google. Nvidia jumped 5% given that Big Tech companies like Meta and Google - that made up to 50% of its revenue in Q3 - insisted that they will spend more on AI this year. Collectively, Alphabet, Meta, and Microsoft are projected to spend around $228 billion on capital expenditures in 2025 – that’s around 75% more than they spent last year, and a part of that cash will flow directly into the pockets of Nvidia. Elsewhere, Qualcomm topped expectations yesterday after the bell but the stock fell nearly 5% AH due to a slight miss in intellectual property licensing revenue and lower-than-expected licensing revenue guidance. And Amazon is due to report its holiday season earnings today after the bell, with all eyes on its cloud revenue – expected to post a nearly 20% year-over-year increase, which would be the largest growth in two years.
Speaking of AI and tech, Chinese AI and robot companies are doing well due to the DeepSeek push. The CSI’s Artificial Intelligence index rallied 2.40% yesterday and is up by more than 13% since January 13, while the CSI Robot index jumped more than 5% yesterday to the highest since last July. Chinese AI has potential to attract more gains on the convergence narrative with the highly-valued US peers. After all, if the European stocks are good to buy due to convergence, why not the Chinese AI?
That brings me to Europe – where the picture didn’t change much yesterday after a set of weaker-than-expected PMI numbers mostly confirmed the gloomy economic outlook in the old continent and reinforced the idea that the European Central Bank (ECB) should to more to support the underlying economies. Good news is that France has a budget and a PM. It doesn’t change the reality of instable politics of France but it does contribute to narrowing the spread between the German and French yields, and that’s positive for sentiment. As such, the Stoxx 600 gained while the EURUSD rebounded yesterday. But the rebound in euro versus the US dollar was more due to a broad-based weakness in the US dollar following a sharp fall in the US yields than the French political news. The EURUSD tested the 50-DMA offers but couldn’t clear it, Cable tested its own 50-DMA but attracted top sellers above this level. If the US dollar eases more this week on the back of waning trade tensions and ideally soft jobs data (that would support the Fed doves), both euro and sterling could find room to extend recovery without necessarily damaging their medium-term bearish trend. On Friday, the US jobs data should give a clearer short-term direction. A softer-than-expected report could lead to a further dollar weakness in the immediate future. As such, short-term tactical traders could take advantage of a potential temporary relief in euro and sterling against the dollar, while medium-term traders will seek topselling opportunities to strengthen their bearish positions. Note that the EURUSD will remain in the medium-term bearish trend below 1.06, and Cable should remain downbeat below 1.2650. After all, the Bank of England BoE) is expected to lower its rates by 25bp today, as Rachel Reeves growth plans are clouded by the country’s restricted finances and the economy calls for BoE support.
In Japan, the yen got a nice energy boost after the Bank of Japan’s (BoJ) Tamura said that Japan's neutral rate is at least 1% and added that rates must reach that level by the second half of this fiscal, ‘when the outcome of annual wage negotiations will likely confirm broad-based pay increases including for small firms’. His comments strengthened the hawkish BoJ expectations and pulled the USDJPY to below 152 level shortly. Provided the way the things look at the BoJ, the way – this time – is certainly open for a sustainable slide below the 150 level. Note that the USDJPY will step into the medium-term bearish consolidation zone if it slides below 151.20 – the major 38.2% Fibonacci retracement on September to January rebound.
Elsewhere, recovery in AUD and CAD remain particularly vulnerable to Trump trade news. And despite waning tensions, UPS decided yesterday to halt deliveries from mainland China and Hong Kong due to tariff delays... China pointed its finger at Apple and its app store as the continuation of the escalation of the trade war, gold extended gains while crude oil tanked more than 2% to below its 100-DMA after the EIA data showed that the US crude inventories popped almost 9mio barrels last week. The outlook for oil remains negative, price rallies should see resistance within the 73/75pb range, including two Fibonacci retracements and the 200-DMA.