Sample Category Title
Ouch
Sometimes, the truth is hard to say—and even harder to hear. The Federal Reserve (Fed) announced another 25bp cut as widely expected and priced in, but hinted that there will be just about two rate cuts throughout next year. The GDP forecasts for this year and the next were revised higher, the unemployment rate lower, and more importantly, the inflation projections were sensibly higher compared to the September projections. The verdict was clear: the Fed must slow down. Powell said that they’re ‘at or near a point at which it will be appropriate to slow the pace of further adjustments’. Fun fact: they have started cutting rates just three months ago – with a jumbo cut. I think I’ve rarely seen a Fed team acting this erratic.
The market reaction was very aggressive, of course. The US 2-year yield spiked past the 4.35%, the 10-year spiked past 4.50%. The S&P500 dropped nearly 3%, Nasdaq 100’s more rate-sensitive, growth stocks tumbled 3.60% and the Dow Jones smashed more than 2.50%, and extended losses to more than 6% since the beginning of December for the 10th straight session – apparently its longest since 1974. Note that the Dow Jones has been diverging negatively from its tech-heavy peers since the beginning of the month - signalling a renewed concentration on tech stocks. But this time, even the rising stars of the tech couldn’t swim against the tide. Broadcom tumbled nearly 7% yesterday, while Nvidia lost 1.14%. Altogether, the Magnificent 7 stocks gave back a hefty 4.40% after the Fed announcement.
The Fed may have spoiled this year’s Santa rally, as its hawkish shift could trigger a deeper correction across US equity markets—which have enjoyed two stellar years largely thanks to Big Tech. Excluding these giants, the S&P 493 delivered solid, albeit far less impressive, performance. Non-tech sectors have been waiting for Fed rate cuts to claim their share of the pie. Unfortunately, the latest equity rally may fade before it extends to these overlooked corners of the market.
In FX and commodities, the US dollar rallied aggressively across the board, the dollar index jumped more than 1% and gold tipped a toe below the $2600 per ounce and below its 100-DMA. Higher US yields increase the opportunity cost of holding the non-interest bearing gold, yet an accelerated selloff and a prolonged weakness in equity markets could drive capital toward the safety of the yellow metal.
The EURUSD tumbled to 1.0344 on the back of a sharp hawkish shift from the Fed, and the bears are now eyeing the parity as their next big target. On the way, the 1.02 - 61.8% Fibonacci retracement on post-pandemic rebound - should provide the last major support to the EURUSD.
In Japan, the Bank of Japan (BoJ) maintained its policy rate unchanged. Only one out of 9 members voted to hike rates today. The others said they needed more time to assess the risks from Trump policies and the wage outlook. As such, the USDJPY rallied above the 155 level, and is supported by the combination of more hawkish Fed and less hawkish BoJ.
The Bank of England (BoE) is the next major central bank to announce its policy verdict later today. The British policymakers are expected maintain rates unchanged at today’s MPC meeting. The BoE had turned relatively bearish earlier this year, before the Autumn Budget announcement. But the higher government spending plans gave cold feet to Mr Bailey, who immediately stepped back from his ‘more aggressive rate cut’ plans. The problem is, the benefits of higher government spending will probably kick in after the pain of higher taxes to finance it. And the BoE may have to give its support during this period without fuelling inflation – that’s started giving signs of heating up over the past two months. It’s complicated. As per sterling, Cable was hit by a broadly stronger US dollar yesterday. A cautious stance from the BoE may slow down but not reverse the negative trend provided that the UK’s economy – which performed surprisingly well this year – could feel the pinch of higher taxes before it enjoys the benefits of improved growth. The ‘pain before gain’ scenario could keep the sterling bulls on the sidelines.
In energy, the Fed’s hawkish shift dampened an early rebound in oil prices yesterday. The rebound had been supported by lower-than-expected US oil inventories last week, but the barrel of US crude slipped back to $70 per barrel. The Fed’s cautious stance, coupled with a weak demand outlook and ample supply, lent further strength to the bears. We anticipate rangebound trading within the $67–$70 per barrel range.
RBNZ OCR Change of Call: Weak GDP Implies a Lower Trough in the OCR
- The OCR looks set to end 2025 at 3.25% - lower than previously thought.
- We continue to see a 50bp cut in February but now think it will be followed up with 25bp cuts in April and May 2025.
- GDP printed sharply lower in Q2 and Q3 2024 – falling a cumulative 2.1%.
- The RBNZ is likely to estimate a weaker starting point for the output gap – even after accounting for upward revisions to historical GDP.
- We still see growth turning modestly positive in Q4 as higher frequency indicators suggest.
- The degree of pick up that occurs will be critical in determining the size and number of cuts that occur after February.
Weaker starting point implies a more pressing case to ultimately cut further.
Recent months have seen accumulating evidence that the economy has started to turn the corner, with the significant cuts to the OCR made by the RBNZ since August supporting consumption, investment and the housing market. Today’s ANZ Business Outlook survey provided further evidence of that turnaround, as did earlier data this week on the service sector PMI and our own consumer confidence survey. Forward indicators of housing market activity also look more encouraging.
However, today’s GDP data tell us that this recovery is following a much steeper downturn in the middle quarters of this year. The cumulative 2.1% fall in GDP over the June and September quarters were much more than had been thought – indeed, outside of Covid, the steepest two-quarter downturn since 1991 – and tell us that past interest rate increases were biting harder into the economy than generally appreciated.
A full analysis of the GDP data will be released later today. However, our initial read of this data strongly suggests the RBNZ will be even more confident that more interest rate cuts will be required after February 2025. GDP growth was revised higher in 2022 and 2023, implying stronger productivity growth over that period than estimated previously. Even so, the weaker than expected growth in mid-2024 means that the economy is likely to be starting from a position of greater excess capacity than the RBNZ previously thought. So even though today’s data has no bearing on the recovery that we now believe to be underway, that recovery will take longer to remove the excess capacity now evident in the economy.
All else equal, that implies slightly less pressure on domestic inflation. Hence the RBNZ will likely be more confident that it can continue to ease policy and that the case for moving policy closer to a fully neutral setting is strengthened. The RBNZ’s view is that the neutral OCR is around 3% - this data will likely tell them they need to get there faster. Likely, they will want to be there by mid- 2025. All else equal we can see their revised forecasts in February reflecting that view.
Of course, all else may not be equal. The exchange rate is appropriately falling sharply and there are many unknowns in how the global environment, terms of trade and trade environment more generally will evolve.
But for now, it looks more likely that the OCR will trough a bit lower than previously thought. Following a 50bps rate cut at the 19 February meeting, we have pencilled in an extra 25bp cut in the April meeting to join the one already envisaged in May 2025. This will take the OCR to a trough of 3.25%.
Ahead of the RBNZ’s next meeting in February, there are several key pieces of domestic data that could be important for the RBNZ policy stance and our own forecast. That includes the Quarterly Survey of Business Opinion on 14 January, the CPI on 19 January and the Q4 labour market update on 5 February. Adjustments to the rates outlook in both directions are possible.
We have not revised our view of the neutral OCR – which remains at 3.75%. This means that the key consequence of this data is more stimulatory conditions by the end of 2025. That also lays the ground for an extra increase in the OCR later in 2026 to bring the OCR back to neutral levels. Hence, the view is starting to look a lot more like a normal interest rate cycle.
Our view remains that the mix of financial conditions is likely to tilt towards more easing being delivered in the form of a weaker exchange rate. Today’s FOMC meeting seemed to solidify the view that US interest rates will remain higher than seen pre-Covid, even as New Zealand short rates head down. We will reevaluate our exchange rate forecasts in the New Year once a bit more data becomes available. Fair to say though, downside risks to our published NZD/USD and Trade Weighted Index forecasts exist.
GBP/USD Approaches Critical Test: Can Bulls Push Higher?
Key Highlights
- GBP/USD is consolidating above the 1.2620 support zone.
- A major bearish trend line is forming with resistance at 1.2740 on the 4-hour chart.
- Gold prices could decline if it settles below the $2,620 support zone.
- The US GDP could grow 2.8% in Q3 2024.
GBP/USD Technical Analysis
The British Pound struggled above 1.2750 against the US Dollar. GBP/USD started a fresh decline and traded below the 1.2680 support zone.
Looking at the 4-hour chart, the pair remained stable above the 1.2600 zone. A low was formed at 1.2608 and the pair is now attempting a fresh increase. It surpassed the 1.2650 and 1.2660 levels.

There was a move above the 50% Fib retracement level of the downward move from the 1.2787 swing high to the 1.2608 low, and the 100 simple moving average (red, 4-hour). However, the bears are active below the 1.2750 level and the 200 simple moving average (green, 4-hour).
On the upside, the pair could face resistance near the 1.2740 level. There is also a major bearish trend line forming with resistance at 1.2740 on the same chart.
The trend line is close to the 61.8% Fib retracement level of the downward move from the 1.2787 swing high to the 1.2608 low. The next major resistance is near the 1.2780 level. A close above the 1.2780 level could set the tone for another increase.
The next major resistance could be the 1.2850 level, above which the price could climb higher toward the 1.2920 resistance. On the downside, immediate support sits near the 1.2660 level.
The next key support sits near the 1.2620 level. Any more losses could send the pair toward the 1.2550 level.
Looking at Gold, the price started a fresh decline and there is now a risk of a downside break below the $2,620 support zone.
Upcoming Economic Events:
- US Initial Jobless Claims - Forecast 230K, versus 242K previous.
- US Gross Domestic Product for Q3 2024 – Forecast 2.8% versus previous 2.8%.
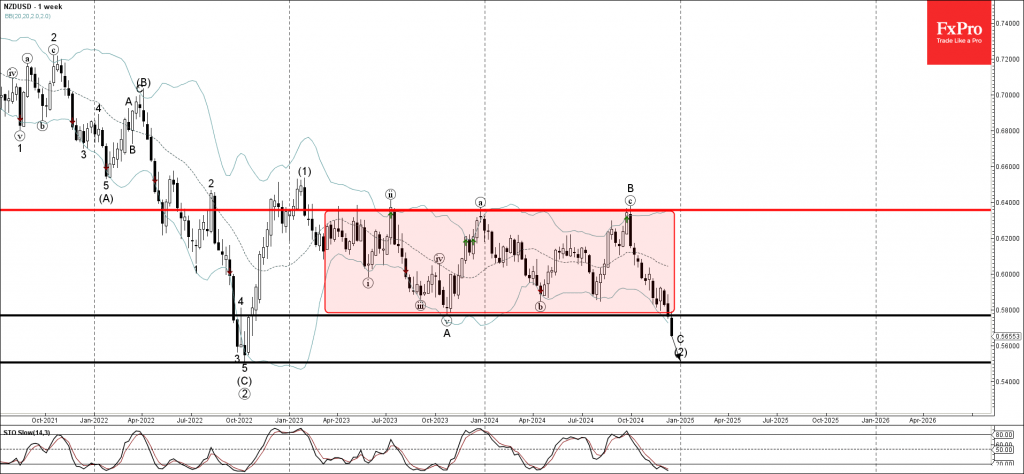
NZDUSD Wave Analysis
- NZDUSD broke long-term support level 0.5770
- Likely to fall to support level 0.5500
NZDUSD currency pair earlier broke below the long-term support level 0.5770 (which acted as the lower border of the weekly sideways price range inside which the pair has been trading from the start of 2023).
The breakout of the support level 0.5770 accelerated the active impulse wave C of extended downward ABC correction (2) from last year.
NZDUSD can be expected to fall further to the next support level 0.5500 (former multiyear low from 2022 and the target price for the completion of the active impulse wave C).
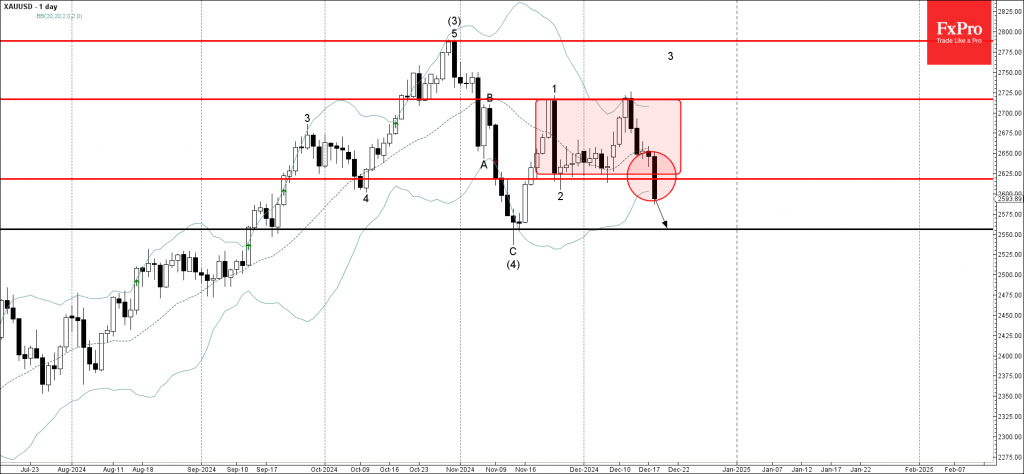
Gold Wave Analysis
- Gold under bearish pressure
- Likely to fall to support level 2555.00
Gold under the bearish pressure after the earlier breakout of the key support level 2617,00 (which is the lower border of the sideways price range inside which the price has been trading from November).
The breakout of the support level 2617,00 stopped the earlier impulse wave 3 of the higher order impulse wave (5) from last month.
Gold can be expected to fall further to the next support level 2555.00 (which stopped the earlier medium-term correction (4) in November).
FOMC Cuts Rates, but Pace of Easing Ahead Likely Will Slow
Summary
- As widely expected, the FOMC cut the target range for the federal funds rate by 25 bps at today's meeting. However, one Committee member, who preferred to keep rates on hold, dissented.
- Wording in the post-meeting statement was changed to signal that further easing may proceed at a slower pace.
- The median dot for 2025 in the so-called "dot plot" was raised by 50 bps. In September, the median FOMC member looked for 100 bps of policy easing next year. The median forecast today looks for only 50 bps of rate cuts next year.
- The wide dispersion in the dot plot for next year may reflect some uncertainty regarding the policy agenda that the incoming administration may pursue. Notably, the range of core PCE inflation forecasts for 2025 widened considerably.
Fed Cuts Rates but Forward Guidance Is Hawkish
As widely expected by market participants, the Federal Open Market Committee (FOMC) reduced its target range for the federal funds rate by 25 bps at its policy meeting today (Figure 1). The FOMC has now cut its target range by 100 bps from its peak of 5.25%-5.50% through moves of 50 bps in September, 25 bps in November and 25 bps today. Although the Committee eased policy today, we would characterize the decision as a "hawkish" rate cut.
For starters, Beth Hammack, the president of the Federal Reserve Bank of Cleveland, dissented today, voting to keep rates on hold instead. In that regard, Chair Powell noted in his post-meeting press conference that today was a "closer call" to cut rates by 25 bps than it was in November. Secondly, the Committee made a notable change to its post-meeting statement. The statement that was released following the last FOMC meeting on November 7 contained the following clause: "In considering additional adjustments to the target range for the federal funds rate..." This clause implied that the FOMC thought last month that it would continue to ease policy in coming months. That clause was changed to the following in today's statement: "In considering the extent and timing (emphasis ours) of additional adjustments to the target range for the federal funds rate..." This rewording of the clause implies to us that the FOMC may now pause in the next meeting or two to ascertain how much additional policy easing may be appropriate.
The FOMC also released its quarterly Summary of Economic Projections (SEP) today. As we projected in our recent Flashlight report, the median forecast for real GDP growth in 2025 was revised a touch higher, the unemployment rate forecast for the end of next year edged down from 4.4% in the September SEP to 4.3% in today's projections, while the core PCE inflation rate for 2025 was pushed up from 2.2% to 2.5%. Accordingly, the median dot in the so-called "dot plot" rose by 50 bps for 2025 (Figure 2). In September, the median FOMC member thought that a target range for the federal funds rate of 3.25%-3.50% would be appropriate at the end of 2025. The median FOMC member today now thinks that a range of 3.75%-4.00% will be appropriate. In other words, the median member now thinks that only 50 bps of additional easing next year will be warranted if conditions evolve as expected.

That said, the dots for next year are widely dispersed. The most dovish Committee member thinks that 125 bps of additional easing would be appropriate next year, while the most hawkish member sees no additional rate cuts from today's level. This dispersion may reflect uncertainty surrounding the policy agenda that the incoming Trump administration may pursue in 2025. Notably, the range of forecasts among FOMC members for core PCE inflation, which the Fed believes is the best measure of the underlying rate of consumer price inflation, widened meaningfully for next year between September and December. The range for 2025 core PCE inflation in the September projection was 2.1% to 2.5%. The range in today's SEP widened to 2.1% to 3.2%. Some FOMC members may be assuming that tariff hikes, should they go into effect, will raise inflation next year. (See the report we wrote in July for further discussion of the macroeconomic effects of tariffs.)
In sum, today's FOMC meeting leads us to believe that, barring some dramatic unexpected development, the Committee likely will keep rates on hold at its next meeting on January 29. However, we believe the FOMC will continue to ease policy next year, albeit at a slower pace than over the past few months. Chair Powell seemed to support this expectation when he noted in his presser that the stance of monetary policy is "significantly closer to neutral" than it was previously, but that policy is "still meaningfully restrictive."
Fed Cuts by 25 bps, Signals Slower Pace in 2025
The Federal Reserve Open Market Committee (FOMC) cut the federal funds rate to the 4.25% to 4.50% range and announced it would continue its balance sheet runoff.
The Fed maintained its language on growth and inflation, stating "economic activity has continued to expand at a solid pace", that the "labor market conditions have generally eased" and that "inflation has made progress toward the Committee's 2 percent objective but remains somewhat elevated."
On the future path of policy, the statement added more specificity that it is considering "the extent and timing" of additional adjustments to the target range. Seemingly setting up the possibility of a pause in interest rate cuts.
The Fed's Summary of Economic Projections was updated from September:
- The median projection for real GDP growth was upgraded to 2.5% in 2024, 2.1% in 2025, 2.0% in 2026, 1.9% in 2027, and 1.8% over the long run (from 2.0%, 2.0%, 2.0%, 2.0% and 1.8%).
- The median unemployment rate forecast was upgraded slightly to 4.2% in 2024, 4.3% in 2025, 4.3% in 2026, 4.3% in 2027, and 4.2% over the long run (from 4.4%, 4.4%, 4.3%, 4.2%, and 4.1%).
- On inflation, the median estimate for core PCE was raised to 2.8% in 2024, 2.5% in 2025, and 2.2% in 2026, and 2.0% in 2027 (from 2.6%, 2.2%, 2.0%, and 2.0%).
- The median projection for cuts to the fed funds rate was reduced by 50 basis points over 2025 and 2026. This raised the level of the fed funds rate to 3.9% in 2025, 3.4% in 2026, 3.1% in 2027, and the long-run neutral rate was assumed to be 3.0% (from 3.4%, 2.9%, 2.9% and 2.9%).
President of the Cleveland Fed, Beth Hammack, voted against today's decision, having preferred for the Fed to have paused at this meeting.
Key Implications
After confirming that the Fed followed through on its 25 bp cut, everyone immediately moved to see how the central bank's view on future rate cuts shifted. No surprise, the Fed expects to be more cautious in 2025 than it forecast prior to the election of President Trump. It has removed 50 bps in cuts, while it has marked up its outlook for inflation. We'd also note that more members are aligned to the median view of 50 basis points in cuts than were aligned on 100 bps in September.
Market pricing agrees with the Fed's more cautious approach, with an increasing likelihood that the Fed will have to pause rate cuts in January. While we don't think investors should rule out a January cut completely, with the Fed's preferred inflation rate stuck at 2.8% year-on-year, and expectations that President Trump will follow through on his inflationary political strategy, it makes sense that the Fed will be much more cautious come the New Year.
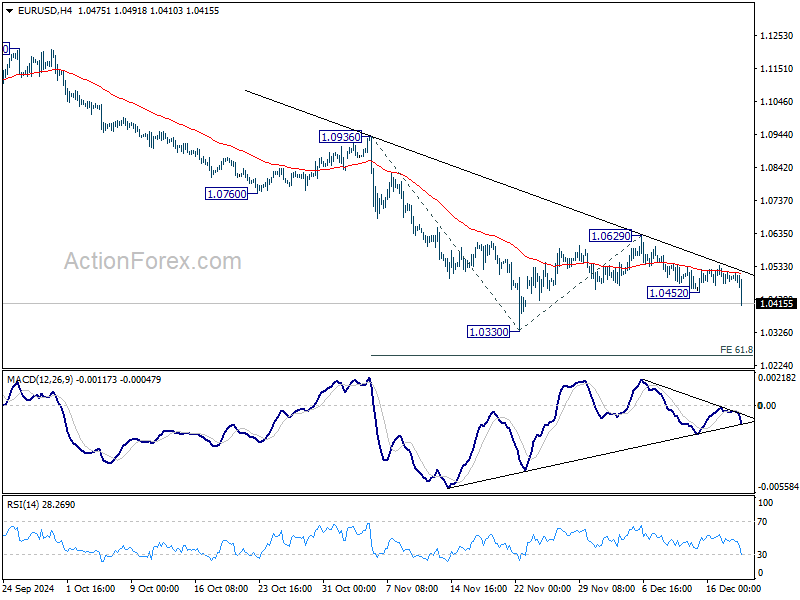
EUR/USD to fall towards 1.0330 after FOMC
Dollar jumps across the board after Fed's hawkish rate cut, with economic projections giving a strong nod to market expectations of slower policy easing, and a higher terminal rate.
EUR/USD's fall from 1.0629 resumed by breaking through 1.0452. Decline from 1.1213 might also be resuming and break of 1.0330 will target 61.8% projection of 1.0936 to 10330 from 1.0629 at 1.0254.
USD/CHF's breach of 0.8974 suggest that the brief retreat has completed. Further rise should be in progress as rally from 0.8374 resume to 61.8% projection of 0.8374 to 0.8956 from 0.8735 at 0.9095.

Fed cuts 25bps, projects slower easing Path amid higher inflation expectations
Fed lowered its benchmark interest rate by 25 bps to 4.25–4.50%, as widely expected. However, the decision was not unanimous, with Cleveland Fed President Beth Hammack dissenting, favoring a pause in rate cuts.
The updated median economic projections reflect a more cautious approach to easing.
Fed now expects rates to fall to 3.9% by the end of 2025, equivalent to just two additional 25bps cuts, a notable shift from the 3.4% projected in September.
Rates are forecast to decline further to 3.4% by the end of 2026 and 3.1% by 2027, both revised up from 2.9%. The longer-run neutral rate was also adjusted upward from 2.9% to 3.0%, indicating that the Fed anticipates rates will reach neutrality only by 2027, underlining a much slower easing pace.
Inflation projections also revised higher, justifying the Fed’s cautious outlook. The headline PCE inflation forecast for 2025 was raised from 2.1% to 2.5%, while core PCE inflation was increased from 2.2% to 2.5%, reflecting persistent inflationary pressures that warrant a more measured approach to policy normalization.