Sample Category Title
USD/JPY Rises to a Nearly 5-Month High
According to the USD/JPY chart today, the US dollar has climbed to 157 yen. This movement was driven by monetary policies of both countries' central banks.
The Federal Reserve took a hawkish stance, with Chair Jerome Powell suggesting the possibility of fewer rate cuts in 2025 than earlier expected.
On the other side, the Bank of Japan's Governor Kazuo Ueda, as reported by Reuters, made "surprisingly dovish" remarks. He delivered a cautious outlook on monetary policy following the central bank’s decision to maintain its interest rates unchanged.
He emphasised that:
→ Real interest rates remain very low.
→ New risks are emerging due to trade policies proposed by US President-elect Donald Trump.
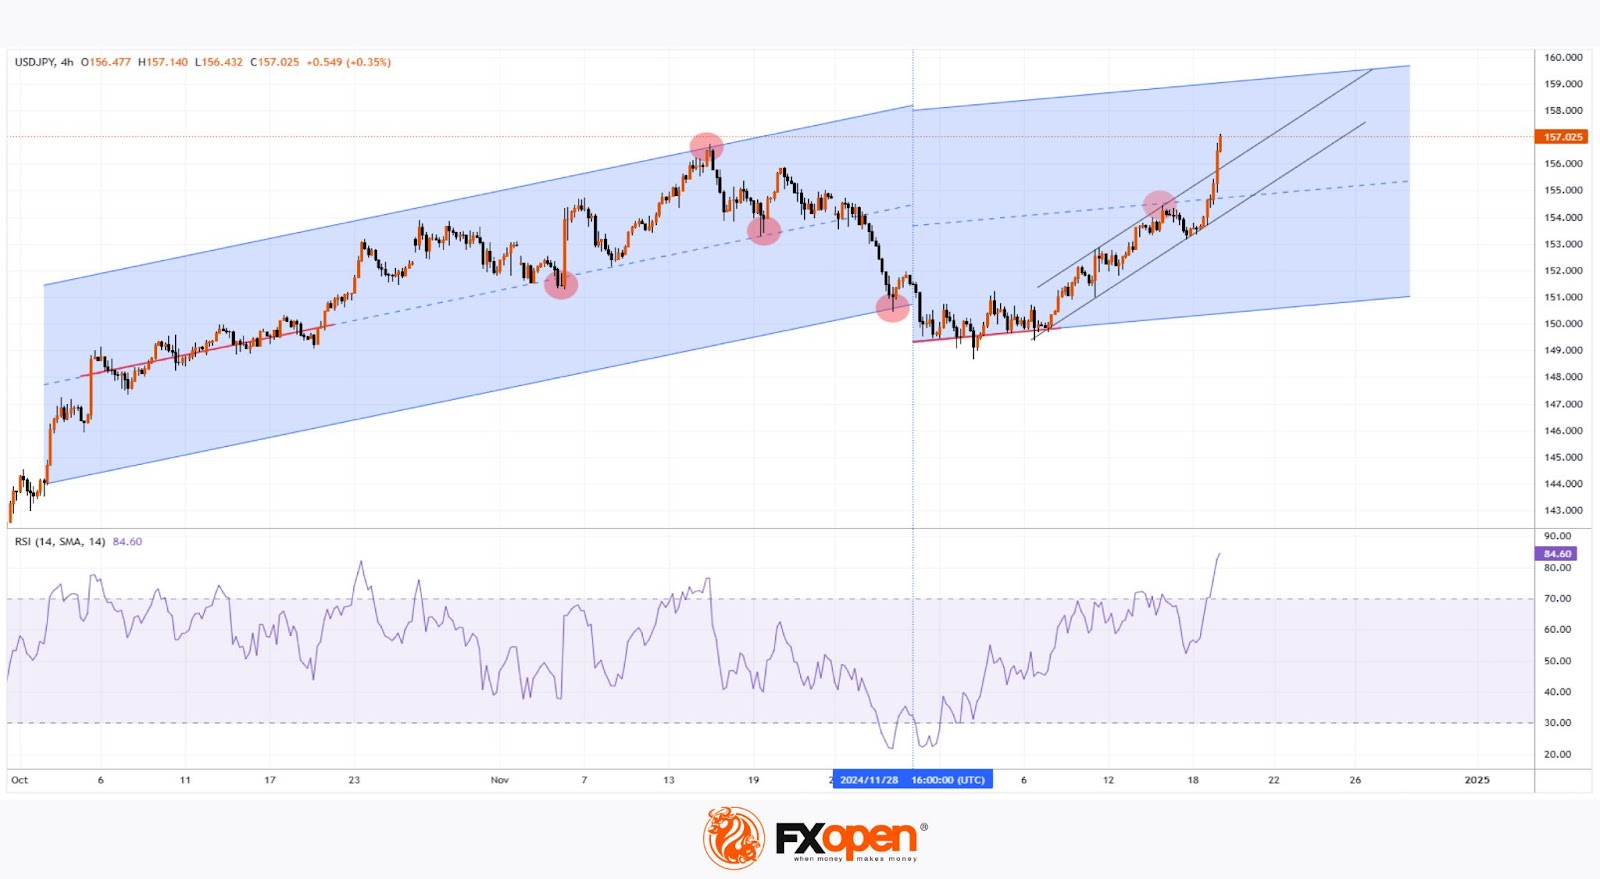
Technical analysis of the 4-hour USD/JPY chart shows that:
→ The pair moves in an upward trend, but based on pivot points (marked in red), the slope of the ascending channel might shift.
→ The RSI is at a multi-month high, and the black trendlines highlight significant demand strength in the market throughout December.
We can suggest that the US dollar is significantly overbought relative to the yen. Could a pullback, such as to the lower black trendline, be expected? Given the importance of fundamental factors such as central bank decisions, any potential pullback might not threaten the continuation of the current uptrend through the end of the year.
Trade over 50 forex markets 24 hours a day with FXOpen. Take advantage of low commissions, deep liquidity, and spreads from 0.0 pips. Open your FXOpen account now or learn more about trading forex with FXOpen.
This article represents the opinion of the Companies operating under the FXOpen brand only. It is not to be construed as an offer, solicitation, or recommendation with respect to products and services provided by the Companies operating under the FXOpen brand, nor is it to be considered financial advice.
GBP/JPY Daily Outlook
Daily Pivots: (S1) 193.90; (P) 194.84; (R1) 195.60; More...
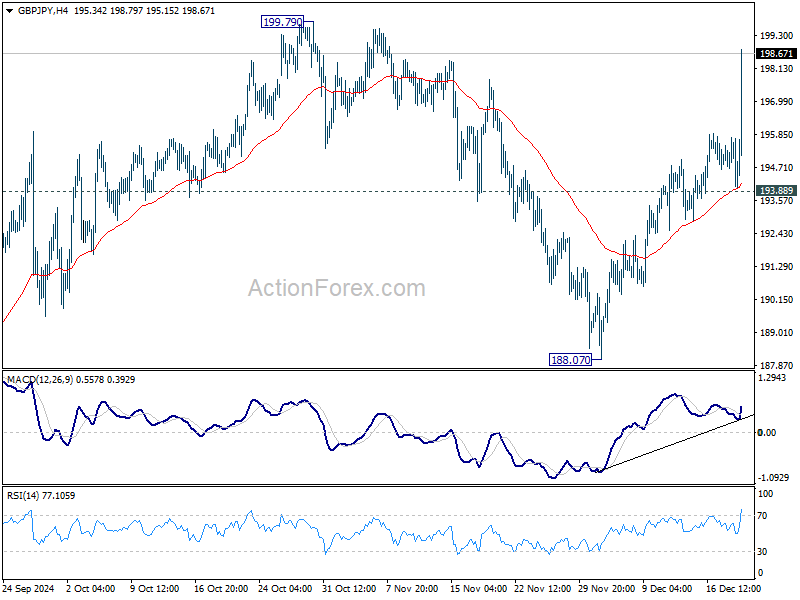
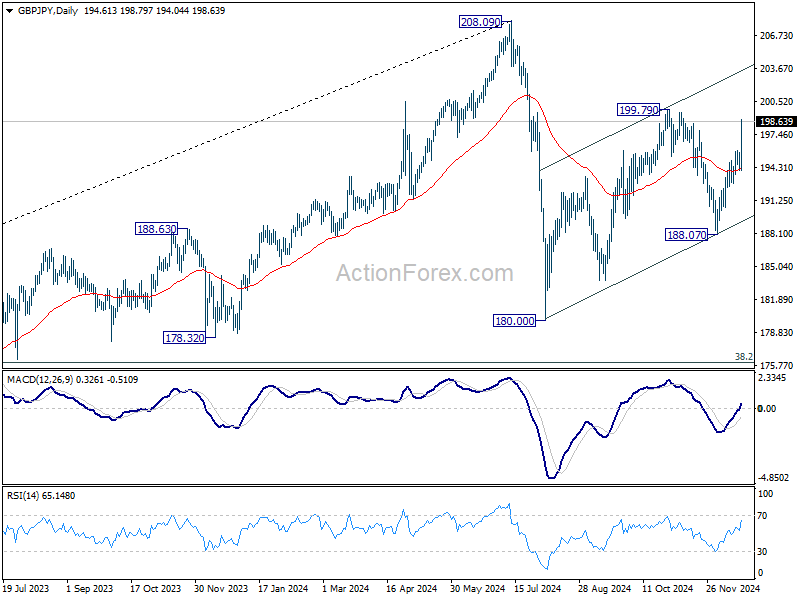
GBP/JPY's rally accelerates higher today and intraday bias stays on the upside for 199.79 resistance. Corrective pattern from 180.00 is extending, and break of 199.79 will target channel resistance (now at 202.84. For now, risk will stay on the upside as long as 193.88 support holds, in case of retreat.
In the bigger picture, price actions from 208.09 are seen as a correction to whole rally from 123.94 (2020 low). The range of consolidation should be set between 38.2% retracement of 123.94 to 208.09 at 175.94 and 208.09. However, decisive break of 175.94 will argue that deeper correction is underway.
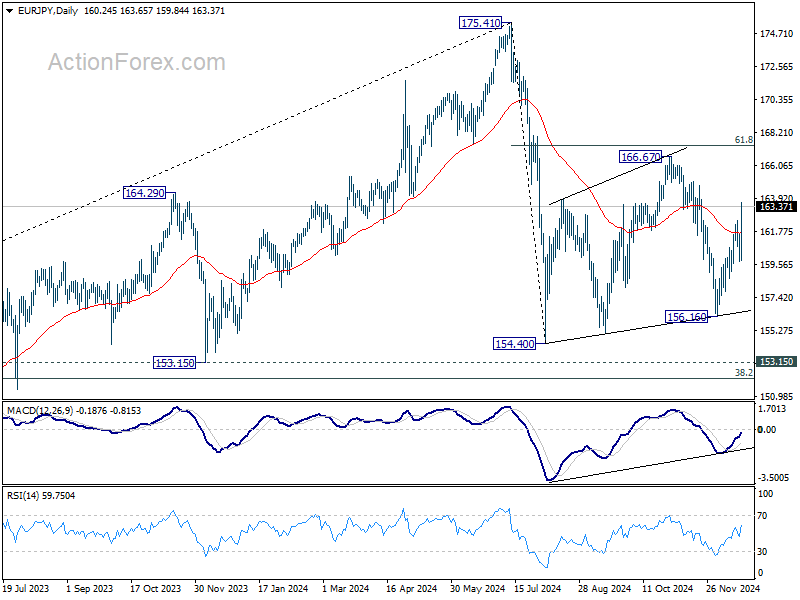
EUR/JPY Daily Outlook
Daily Pivots: (S1) 159.49; (P) 160.52; (R1) 161.24; More...
EUR/JPY's rally from 156.16 resumed after brief retreat and intraday bias is back on the upside. Corrective pattern from 154.40 is extending with another up-leg. Further rise should be seen to 166.67 resistance and possibly above. For now, risk will stay on the upside as long as 159.79 support holds, in case of retreat.
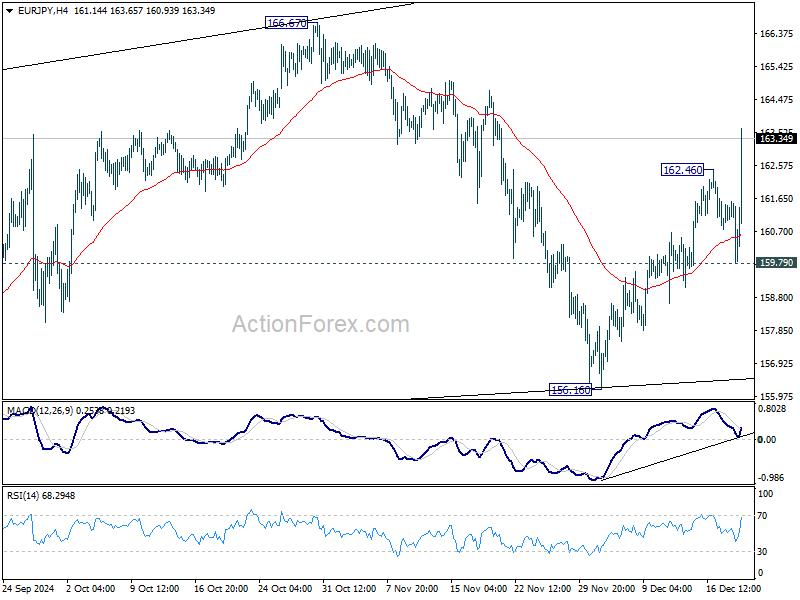
In the bigger picture, price actions from 175.41 are seen as correction to rally from 114.42 (2020 low). The range of consolidation should have been set between 38.2% retracement of 114.42 to 175.41 at 152.11 and 175.41 high. However, decisive break of 152.11 would argue that deeper correction is underway.
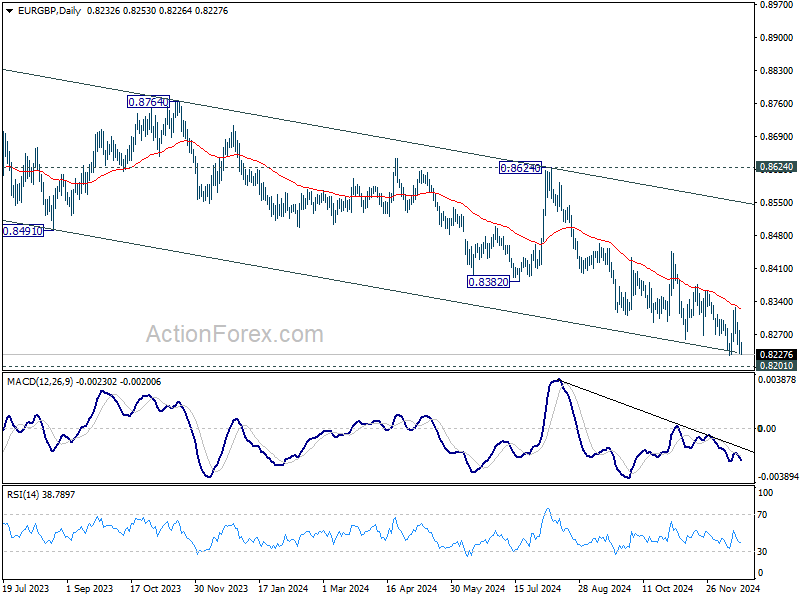
EUR/GBP Daily Outlook
Daily Pivots: (S1) 0.8216; (P) 0.8247; (R1) 0.8265; More...
No change in EUR/GBP's outlook and intraday bias stays on the downside. Firm break of 0.8224 will resume larger down trend to 0.8201 key support. Strong support could be seen there to bring rebound. But break of 0.8326 resistance is needed to confirm short term bottoming. Meanwhile, sustained break of 0.9201 will carry larger bearish implications.
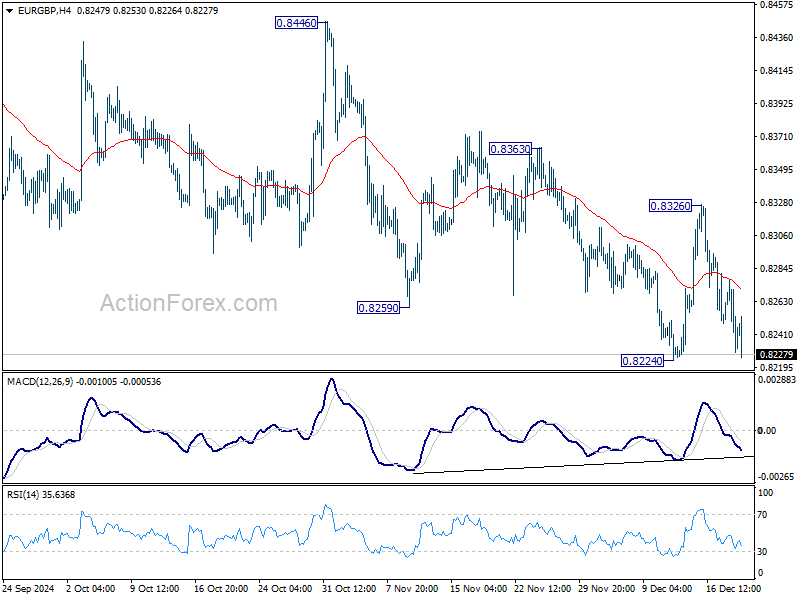
In the bigger picture, focus is now on whether 0.8201 key support (2022 low) is strong enough to complete the whole down trend from 0.9267 (2022 high). In any case, medium term outlook will be neutral at best until decisive break of 0.8624 key resistance. Otherwise, risk will stay on the downside even in case of strong rebound.
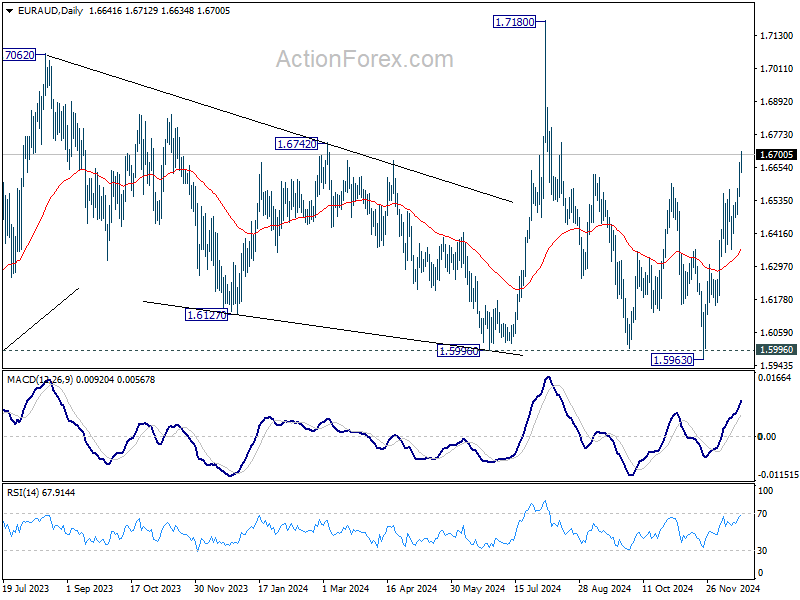
EUR/AUD Daily Outlook
Daily Pivots: (S1) 1.6567; (P) 1.6620; (R1) 1.6700; More...
Intraday bias in EUR/AUD remains on the upside for the moment. Rise from 1.5963 should target a retest on 1.7180 high next. On the downside, below 1.6579 minor support will turn intraday bias neutral and bring consolidations, before staging another rise.
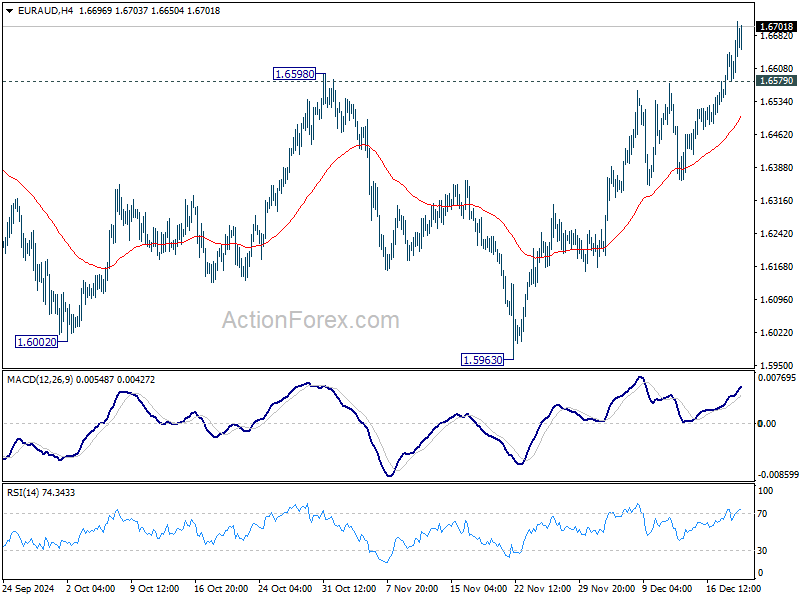
In the bigger picture, EUR/AUD is holding on to 1.5996 key support despite brief breach. Larger up trend from 1.4281 (2022 low) is still in favor to resume through 1.7180 at a later stage. Nevertheless, sustained break of 1.5995 will indicate that such up trend has completed. Deeper decline would be seen to 61.8% retracement of 1.4281 to 1.7180 at 1.5388, even as a correction.
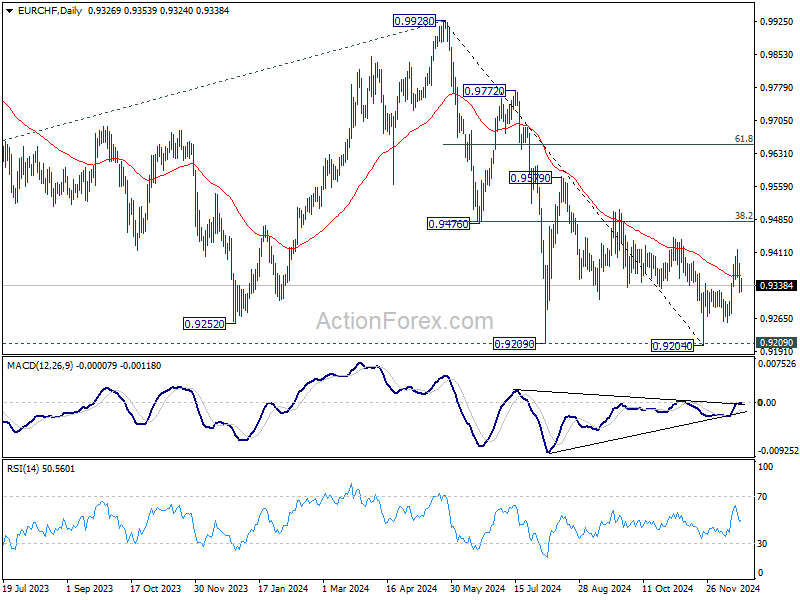
EUR/CHF Daily Outlook
Daily Pivots: (S1) 0.9303; (P) 0.9346; (R1) 0.9369; More....
Break of 0.9343 resistance turned support suggests that rebound from 0.9204 has completed as a three-wave corrective move at 0.9417. Intraday bias is back on the downside fro 0.9254 support first. Firm break there will bring deeper fall to 0.9209 key support again. For now, risk will be mildly on the downside as long as 0.9417 resistance holds, in case of recovery.
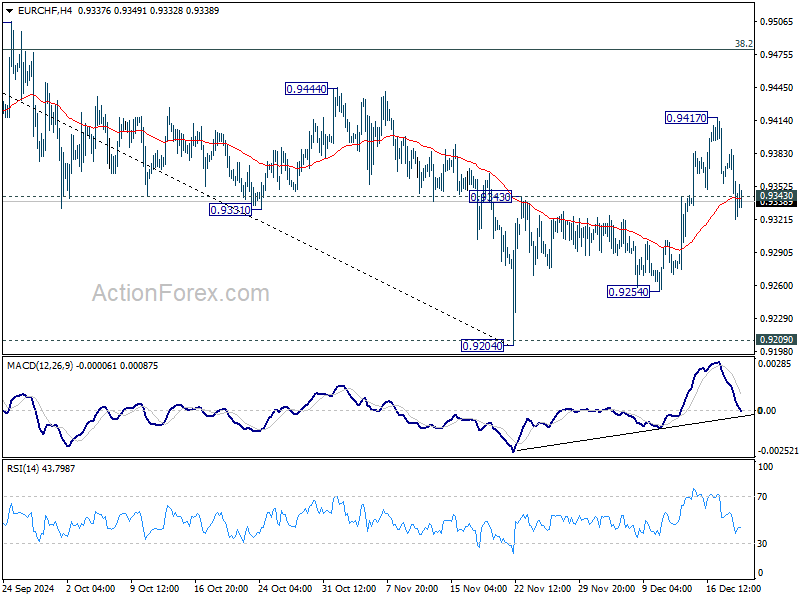
In the bigger picture, a medium term bottom is probably in place at 0.9204. More consolidations would be seen above there with risk of stronger rebound to 38.2% retracement of 0.9928 to 0.9204 at 0.9481. But outlook will remain bearish as long as 0.9481 holds and another fall through 0.9204 to resume larger down trend is in favor.
Nasdaq 100 Index Plummets After Fed Decision
On 17th December, analysing the Nasdaq 100 chart (US Tech 100 mini on FXOpen), we:
→ Drew a blue upward channel relevant for 2024;
→ Noted that the price was near the upper boundary of the channel, while the RSI indicator had entered the overbought zone;
→ Suggested that bulls might face difficulties in pushing the price to a new all-time high.
Yesterday, the Fed cut the interest rate by 0.25%. Although it was anticipated, the market reaction was sharply negative. The Nasdaq 100 (US Tech 100 mini on FXOpen) dropped by approximately 4%.
The steep market reaction was driven by Fed Chair Jerome Powell’s comments during the press conference, where he stated that the FOMC plans to cut rates only twice in 2025, contrary to market expectations of four cuts.
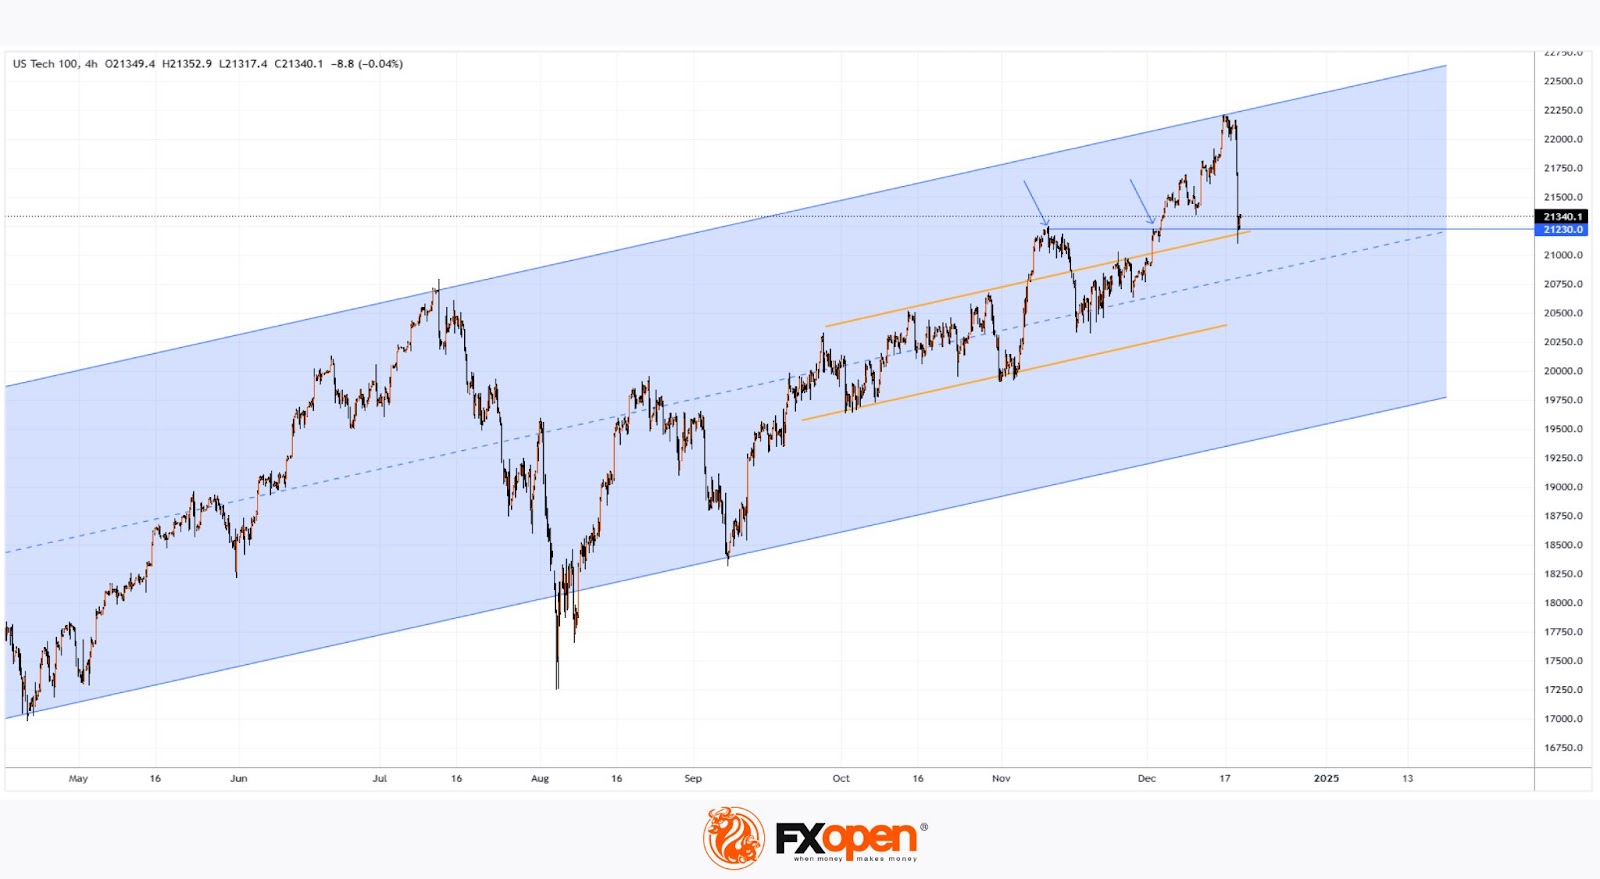
Technical analysis of the Nasdaq 100 (US Tech 100 mini on FXOpen) chart shows that:
→ The price remains in the upper half of the channel, supported by the 21,230 level, which previously acted as resistance (as indicated by arrows).
→ We can assume that the area around the median of the blue channel (marked by orange lines) could act as a barrier to further downward momentum, as medians often serve as equilibrium zones where supply and demand balance out.
What’s next? According to analysts at Zacks, record highs for the tech stock index may not be a topic of discussion in the near future.
There is a possibility that a local descending channel could form, potentially driving the price into the lower half of the broader upward channel.
Trade global index CFDs with zero commission and tight spreads. Open your FXOpen account now or learn more about trading index CFDs with FXOpen.
This article represents the opinion of the Companies operating under the FXOpen brand only. It is not to be construed as an offer, solicitation, or recommendation with respect to products and services provided by the Companies operating under the FXOpen brand, nor is it to be considered financial advice.
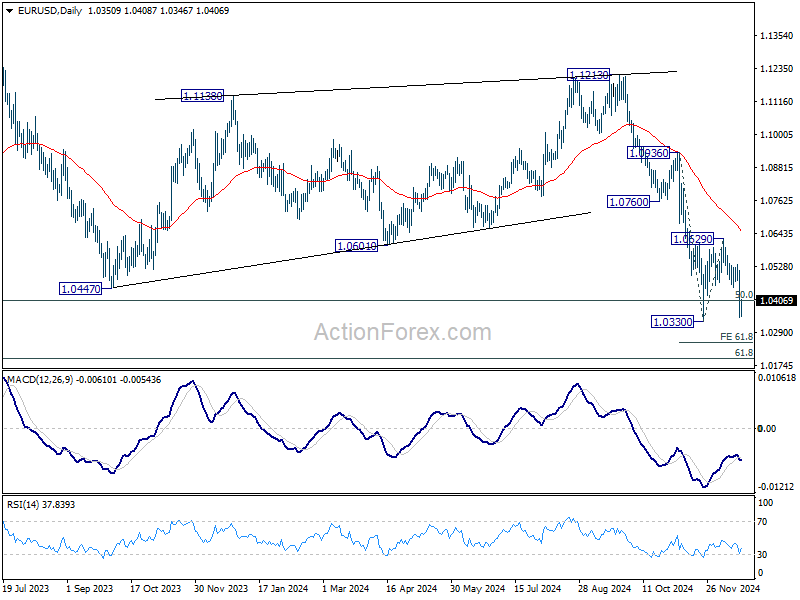
EUR/USD Daily Outlook
Daily Pivots: (S1) 1.0292; (P) 1.0402; (R1) 1.0461; More...
Intraday bias in EUR/USD is back on the downside with strong break of 1.0452 minor support. Fall from 1.1213 should be resuming to 61.8% projection of 1.0936 to 10330 from 1.0629 at 1.0254. Firm break there will target 100% projection at 1.0023. ON the upside, above 1.0452 will turn intraday bias neutral again first.
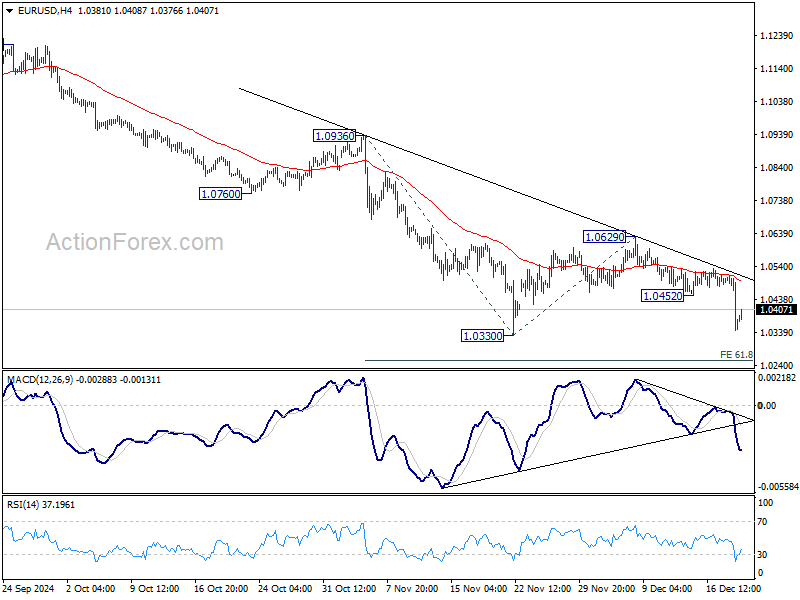
In the bigger picture, focus stays on 50% retracement of 0.9534 (2022 low) to 1.1274 at 1.0404. Strong rebound from this level will keep price actions from 1.1273 (2023 high) as a medium term consolidation pattern only. However, sustained break of 1.0404 will raise the chance that whole up trend from 0.9534 has reversed. That would pave the way to 61.8% retracement at 1.0199 first. Firm break there will target 0.9534 low again.
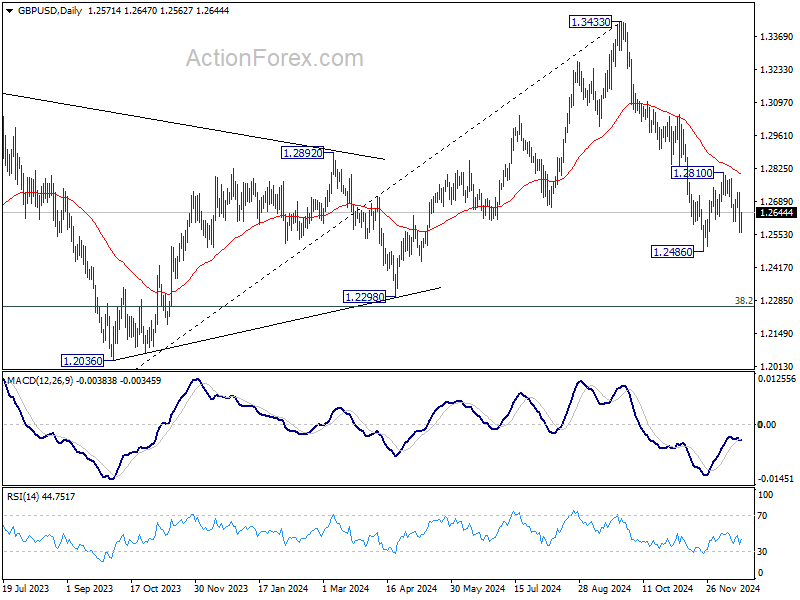
GBP/USD Daily Outlook
Daily Pivots: (S1) 1.2513; (P) 1.2621; (R1) 1.2679; More...
GBP/USD's break of 1.2615 support suggest that recovery from 1.2486 has completed at 1.2810. Intraday bias is back on the downside for retesting 1.2486. Firm break there will resume the fall from 1.3433 and target 1.2298 cluster support zone. Nevertheless, break of 1.2728 minor resistance will turn bias to the upside for 1.2810 and above instead.
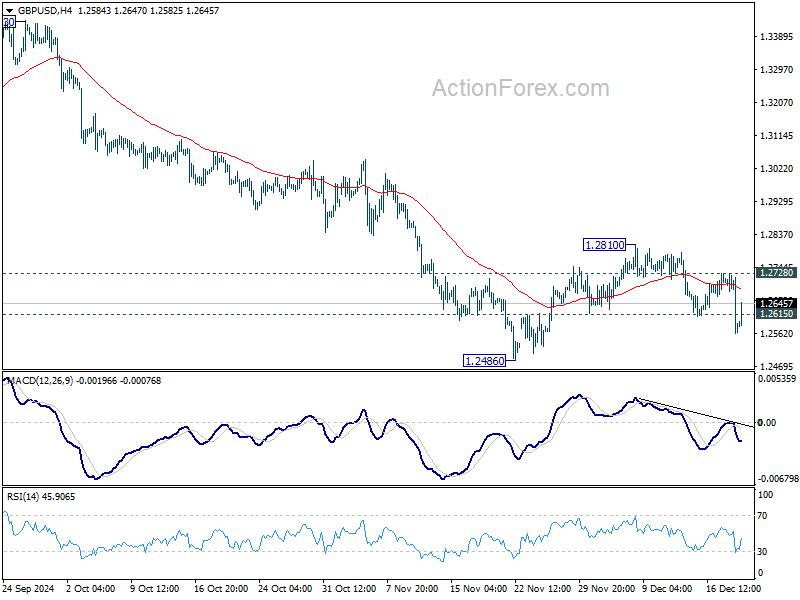
In the bigger picture, price actions from 1.3433 medium term are seen as correcting whole up trend from 1.0351 (2022 low). Deeper decline could be seen to 38.2% retracement of 1.0351 to 1.3433 at 1.2256, which is close to 1.2298 structural support. But strong support is expected there to bring rebound to extend the corrective pattern.
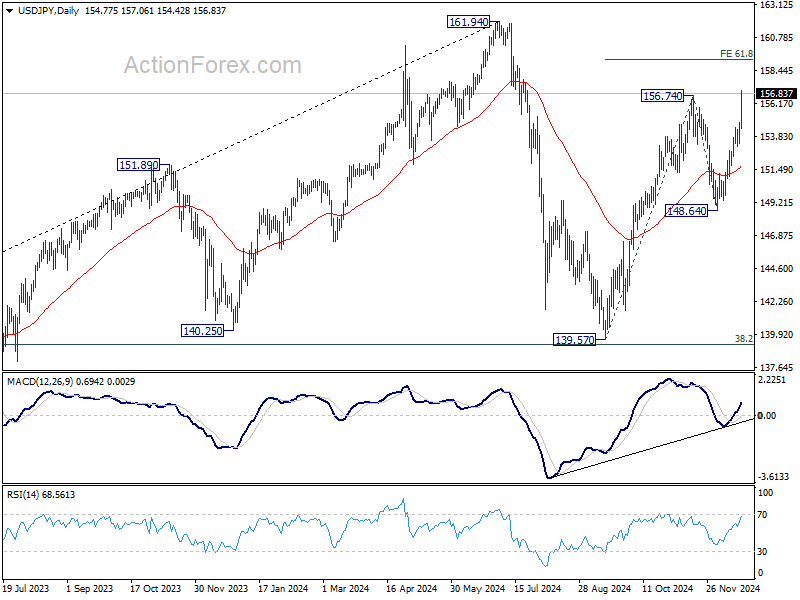
USD/JPY Daily Outlook
Daily Pivots: (S1) 153.78; (P) 154.32; (R1) 155.38; More...
USD/JPY's rally resumed after brief consolidations and intraday bias is back on the upside. Break of 156.74 resistance should extend the whole rise from 139.57 to 61.8% projection of 139.57 to 156.74 from 148.64 at 159.25 next. Outlook will now stay bullish as long as 153.15 support holds, in case of retreat.
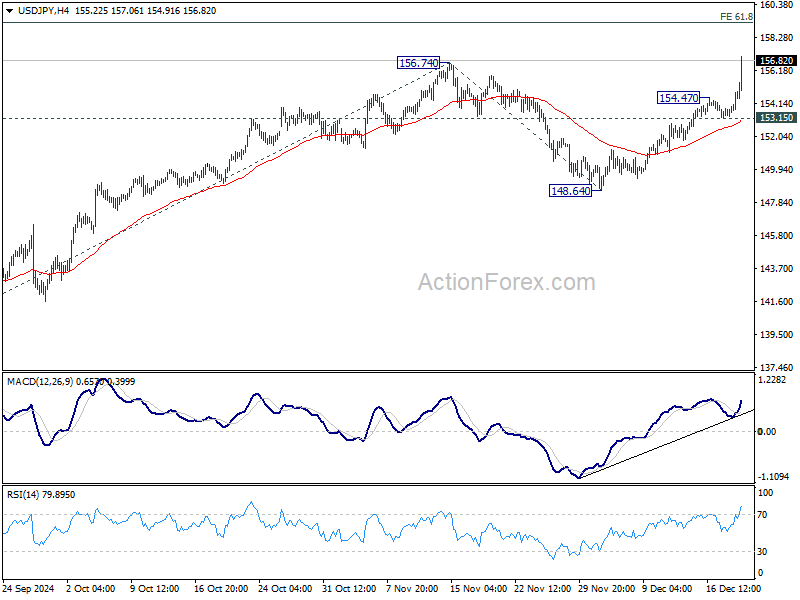
In the bigger picture, price actions from 161.94 are seen as a corrective pattern to rise from 102.58 (2021 low). The range of medium term consolidation should be set between 38.2% retracement of 102.58 to 161.94 at 139.26 and 161.94. Nevertheless, sustained break of 139.26 would open up deeper medium term decline to 61.8% retracement at 125.25.