Sample Category Title
GBPUSD Bounces Off 3-month Low; Bearish Bias Holds
- GBPUSD in a steady decline since mid-July
- Found its footing just shy of the 200-day SMA
- Can the bulls stage a comeback?
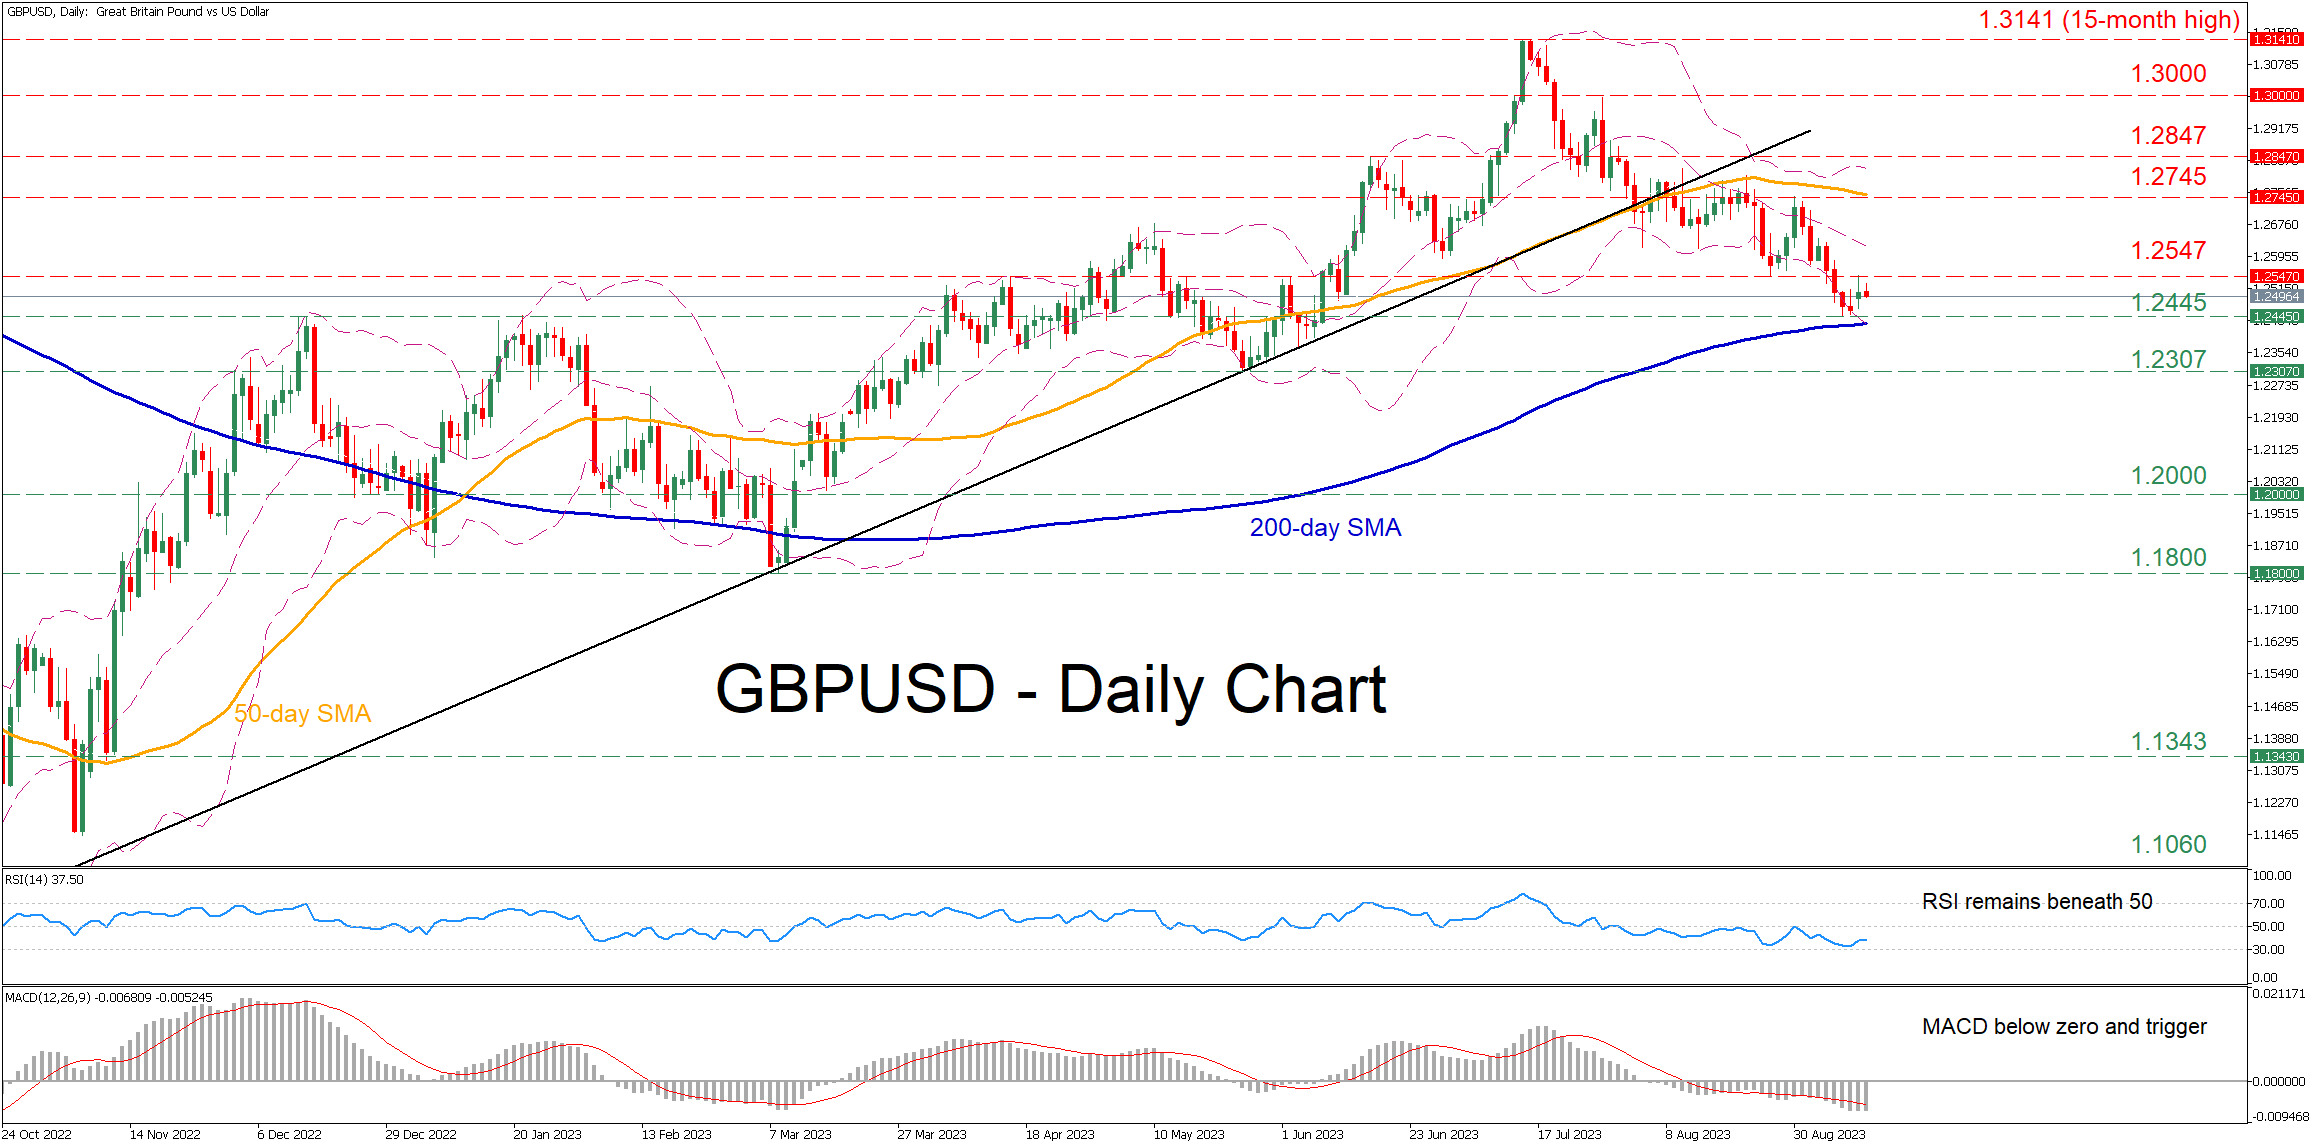
GBPUSD has been forming a structure of lower highs and lower lows since its 15-month peak of 1.3141. Despite the latest rebound from a three-month low, the short-term oscillators are pointing to further downside as both the RSI and MACD are well within their negative territories.
If the selling interest intensifies, the pair could face the recent support of 1.2445, which acted as resistance in January and also coincides with the 200-day simple moving average (SMA). Sliding beneath that floor, the price might descend towards the May bottom of 1.2307. Further declines could then cease at the 1.2000 psychological mark.
On the flipside, should the recent bounce extend, the bulls may target 1.2547, which has acted both as support and resistance in the past month. A break above that region could open the door for the August resistance of 1.2745, which overlaps with the 50-day SMA. Even higher, the June peak of 1.2847 could curb further upside attempts.
In brief, it seems that the GBPUSD’s pullback is starting to lose steam, but it’s too early to call for a reversal. Indeed, the short-term decline could even accelerate in the case that the pair profoundly closes below the 200-day SMA.
Oil Price Stabilizes Near Year’s Highs
Last week, the Russian Federation and Saudi Arabia confirmed plans to reduce production by the end of the year, which contributed to an increase in oil prices.
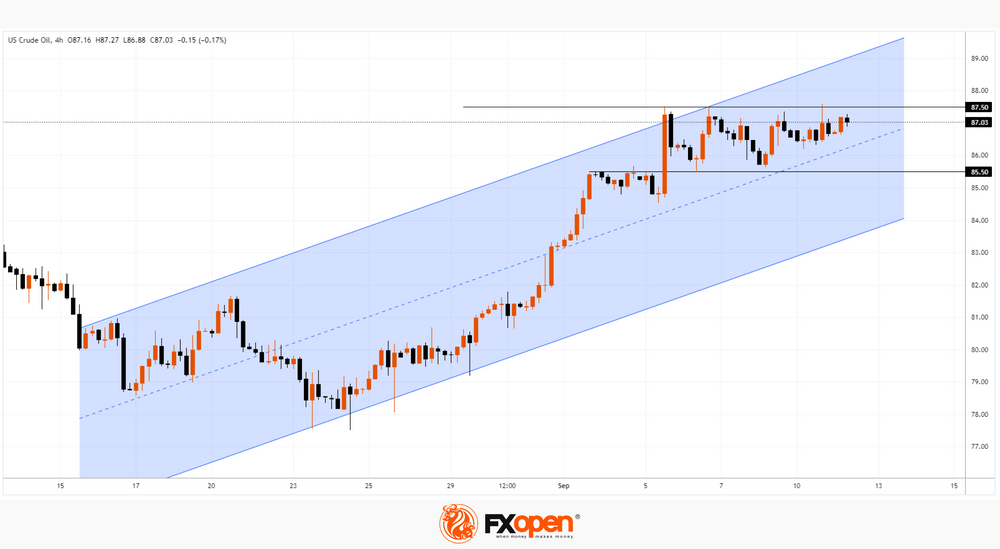
At the beginning of this week, the WTI price stabilized in the range of 85.50 - 87.50. Will the upward trend continue, which will benefit oil producers?
On Tuesday morning, the price is within the triangle formed from the median line of the ascending channel (shown in blue) and the level of 87.50. A breakout of this triangle can occur in both directions.
Bullish arguments:
→ The price is within the ascending channels, both short-term (built on the 1h and 4h charts) and long-term (built on the daily chart).
→ A series of rising lows is forming on the chart, indicating that demand is active.
→ Technically, the market may be supported by the level of 85.50, which previously served as resistance.
→ Oil supplies may be disrupted due to various storms. For example, in eastern Libya, 4 ports were closed due to flooding and a storm, which killed about 2,000 people.
Bearish arguments:
→ News about economic slowdown in various regions (China, Europe) should weaken demand.
→ On September 11, the price of oil renewed its multi-month high, but retreated very quickly. The behavior was similar to a bull trap — a sign of a weak market that could be a harbinger of downward momentum.
→ High oil prices are unprofitable for governments of countries (including the United States) struggling with high inflation.
Tomorrow, at 11:00 GMT+3, the publication of a monthly report on oil prices from the International Energy Agency is scheduled, which could greatly affect the current exchange rate and disrupt the consolidation triangle that is currently in effect.
This article represents the opinion of the Companies operating under the FXOpen brand only. It is not to be construed as an offer, solicitation, or recommendation with respect to products and services provided by the Companies operating under the FXOpen brand, nor is it to be considered financial advice.
Markets Rise As Spotlight Shines On US CPI
Asian markets were a mixed bag on Tuesday despite the broadly positive cues from Wall Street overnight as a surge in Tesla powered a rally in tech stocks.
Despite the shaky sentiment across Asia amid lingering concerns about China’s economy, European futures are pointing to a positive open as focus falls on the pending Germany ZEW survey expectations. Shares across the region could see heightened volatility this week due to the ECB meeting on Thursday. Looking at currencies, the British Pound briefly jumped after UK wage data beat market expectations. In the commodity space, oil is hovering near its highest level this year ahead of key monthly reports from the IEA and OPEC.
Dollar steady ahead of US Inflation data
The August US Consumer Price Index (CPI) report will act as a critical piece of information that determines whether the Fed will keep rates higher for longer.
Headline inflation is expected to jump thanks to energy costs with markets projecting monthly prices to accelerate 0.6% in August, but the core is seen stable at 0.2%. Ultimately, further signs of cooling inflationary pressures may feed the argument around the Fed already concluding its hiking cycle. As of writing, traders are currently pricing in a 7% probability of a 25-basis point hike next week, with this jumping to 46% by November, according to Fed funds futures.
Should the inflation numbers print below market forecasts, this could reinforce the argument around the Fed being done with its hiking cycle in 2023, weakening the US Dollar. However, a sticky inflation print could inject dollar bulls with more strength as expectations rise around the Fed having headroom to hike one more time this year.
EUR/GBP Daily Outlook
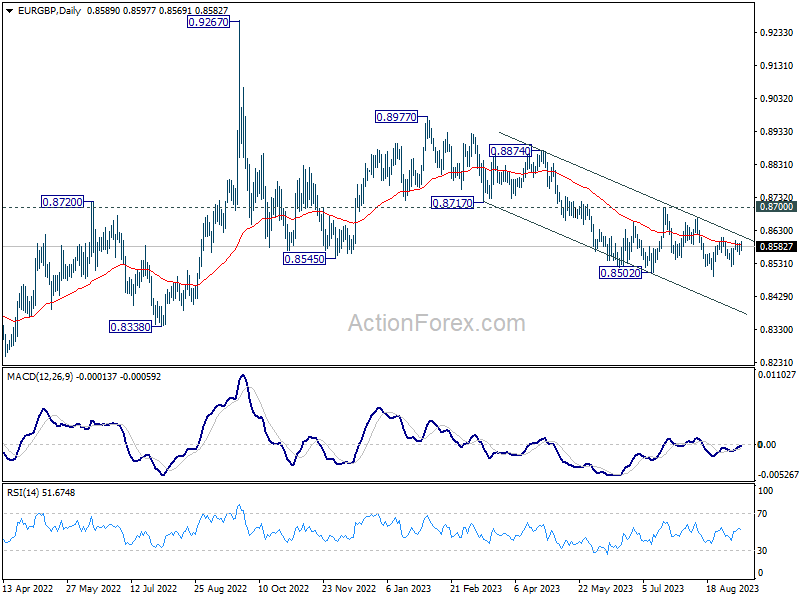
Daily Pivots: (S1) 0.8570; (P) 0.8582; (R1) 0.8606; More...
Sideway trading continues in EUR/GBP and intraday bias remains neutral. Current rise from 0.8941 could be the third leg of the corrective pattern from 0.8502. On the upside, above 0.8609 would resume the rebound and target 0.8667 resistance, possibly further to 0.8700. On the downside, however, break of 0.8522 will bring retest of 0.8491 low.
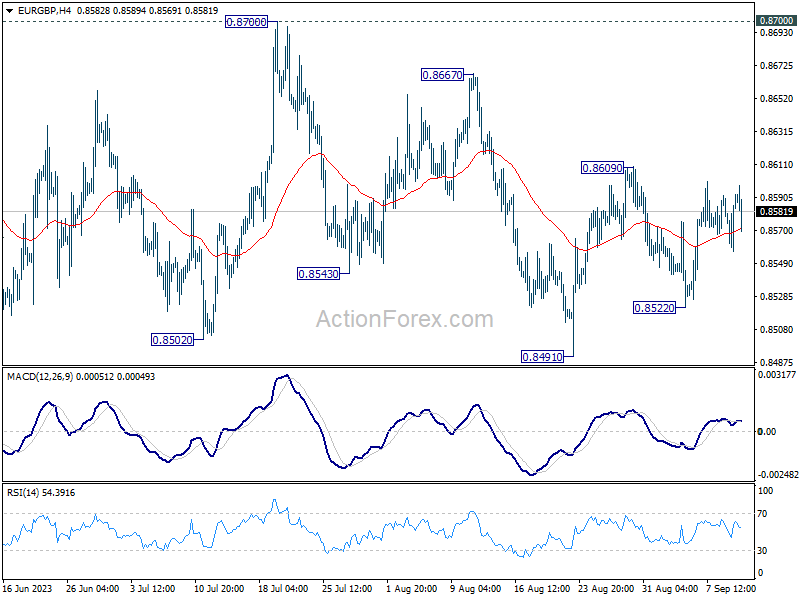
In the bigger picture, the down trend from 0.9267 (2022 high) is seen as part of the long term range pattern from 0.9499 (2020 high). Fall from 0.8977 is seen as the third leg. As long as 0.8700 resistance holds, further decline is still expected. Break of 0.8491 will resume the fall towards 0.8201 (2022 low). Nevertheless, firm break of 0.8700 will now be a sign of bullish reversal.
EUR/AUD Daily Outlook
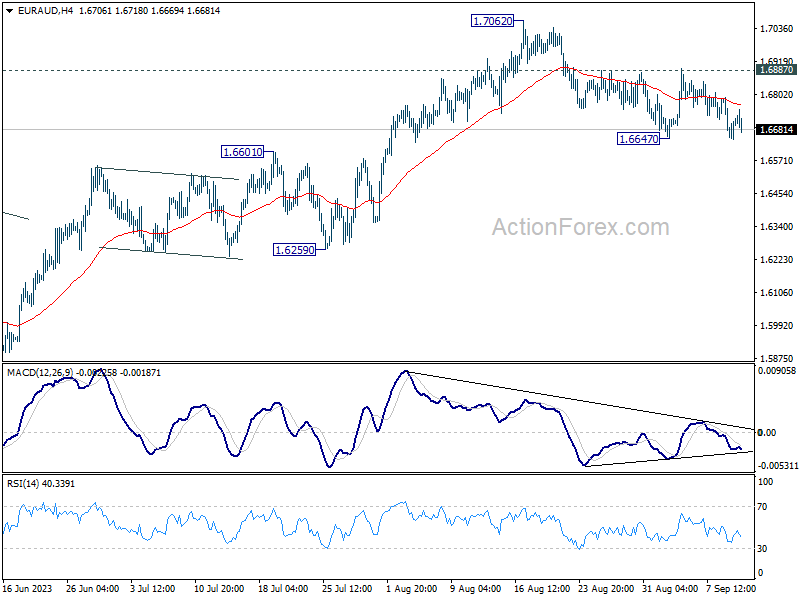
Daily Pivots: (S1) 1.6645; (P) 1.6719; (R1) 1.6793; More...
Range trading continues in EUR/AUD and intraday bias stays neutral. On the downside, break of 1.6647 will extend the corrective fall from 1.7062 to 1.6259/6601 support zone. On the upside, firm break of 1.6887 resistance should confirm that correction from 1.7062 has completed at 1.6647. Further rally should be seen through 1.7062 to 1.7377 projection level.
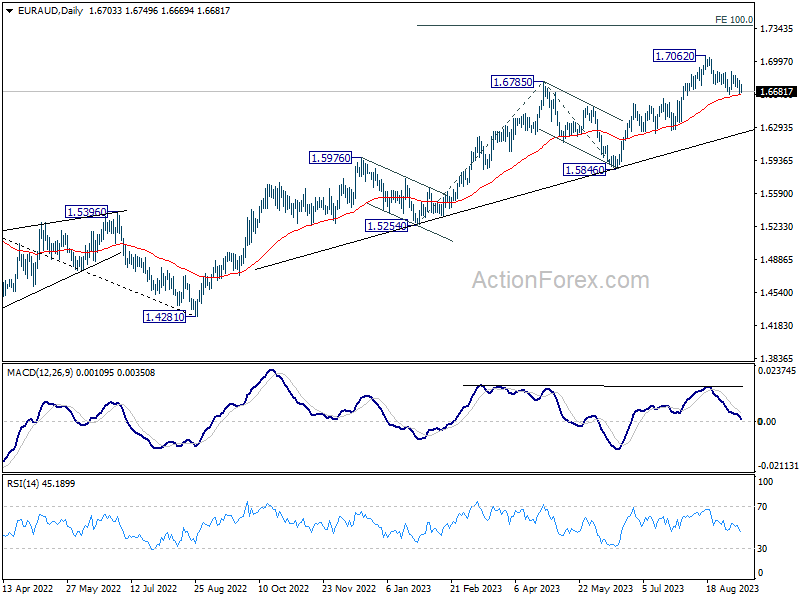
In the bigger picture, the rise from 1.4281 (2022 low) is in progress. Next target is 100% projection of 1.5254 to 1.6785 from 1.5846 at 1.7377. For now, outlook will stay bullish as long as 1.5846 support holds, even in case of deep pull back.
EUR/JPY Daily Outlook
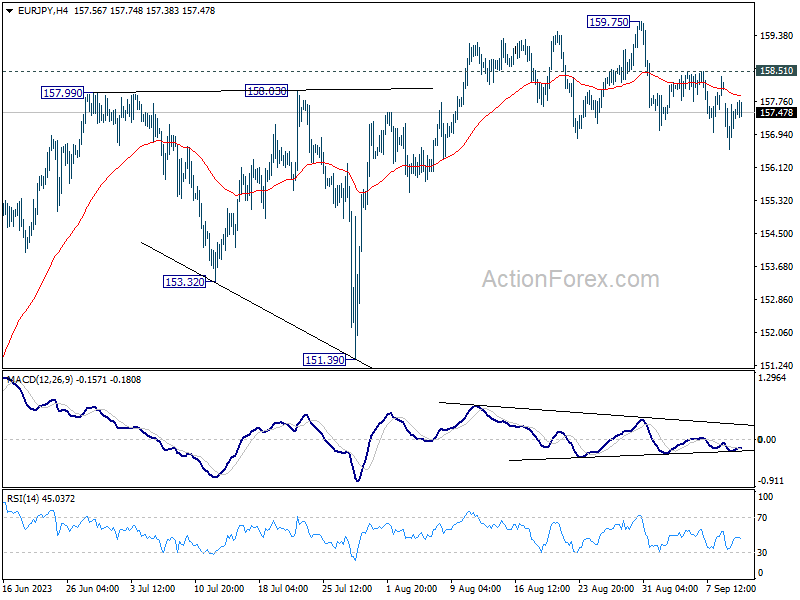
Daily Pivots: (S1) 156.87; (P) 157.30; (R1) 158.01; More....
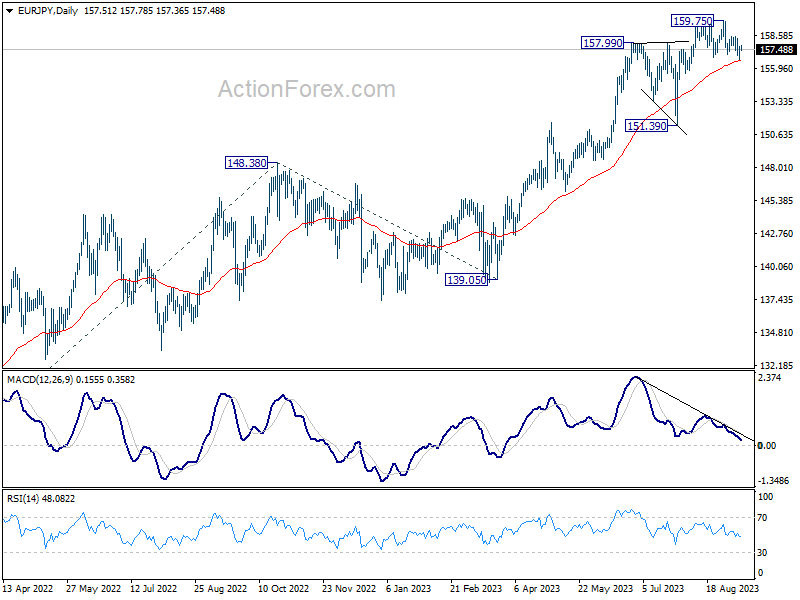
Intraday bias in EUR/JPY remains mildly on the downside for the moment. Sustained trading below 55 D EMA (now at 156.57) will argue that fall from 159.75 is a larger scale correction. Deeper fall would be seen back towards 151.39 support. On the upside, break of 159.75 will resume larger up trend to 163.06 projection target.
In the bigger picture, rise from 114.42 (2020 low) is in progress. Next target is 100% projection of 124.37 to 148.38 from 139.05 at 163.06. Sustained break there will pave the way to retest long term resistance at 169.96. This will remain the favored case as long as 151.39 support holds, even in case of deep pull back.
GBP/JPY Daily Outlook
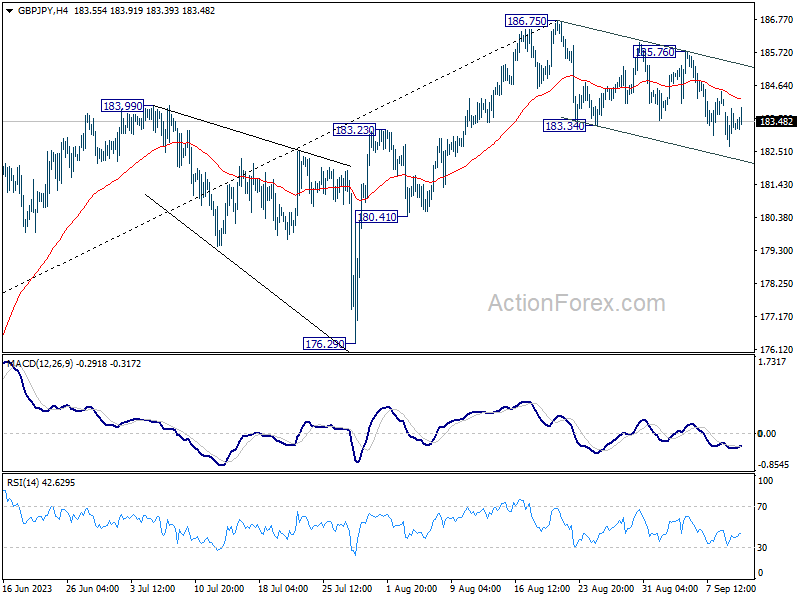
Daily Pivots: (S1) 182.73; (P) 183.32; (R1) 183.95; More...
Intraday bias in GBP/JPY stays mildly on the downside for the moment. Fall from 186.75 would target 55 D EMA (now at 182.31). Sustained break there will argue that it's already in a larger scale correction and target 176.29 support next. On the upside, break of 185.67 resistance will indicate that the pull back from 186.75 has completed. Further rise should then be seen through 186.75 to resume larger up trend.
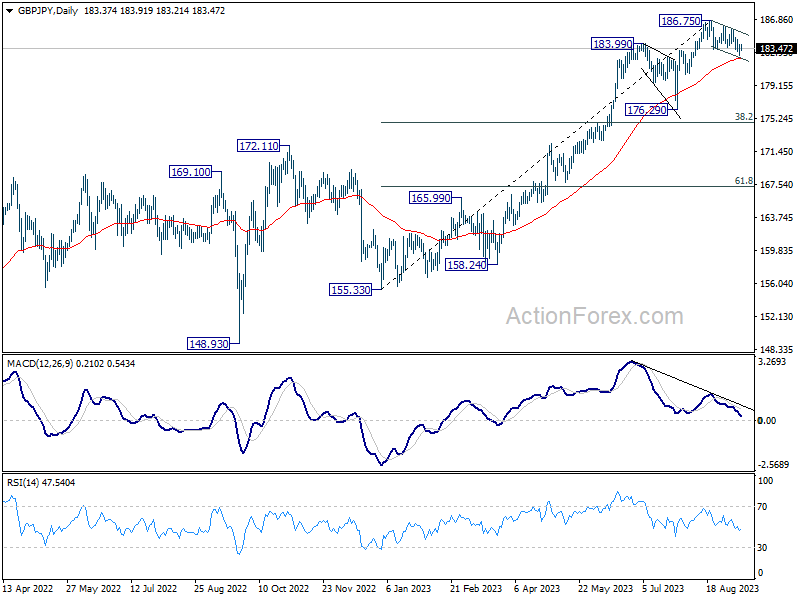
In the bigger picture, up trend from 123.94 (2020 low) is in progress. Next target is 195.86 (2015 high). This will remain the favored case as long as 176.29 support holds, even in case of deeper pull back.
EUR/CHF Daily Outlook
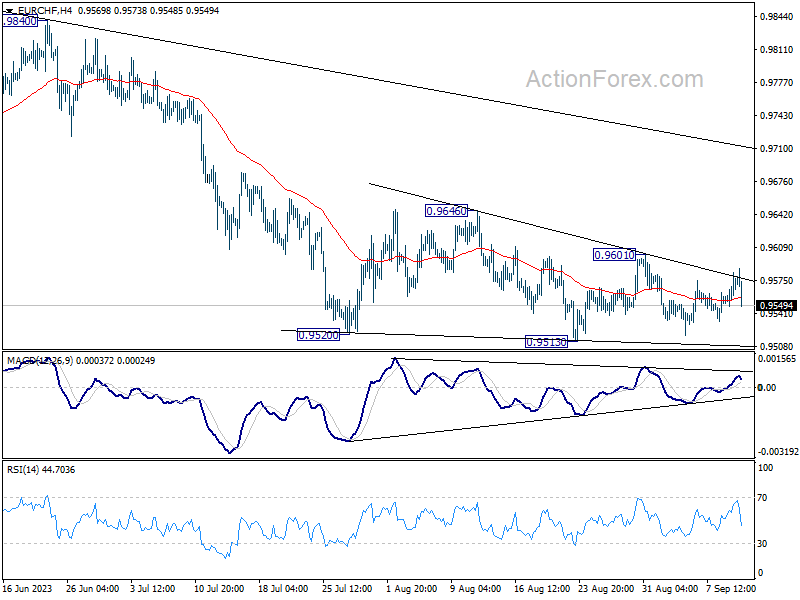
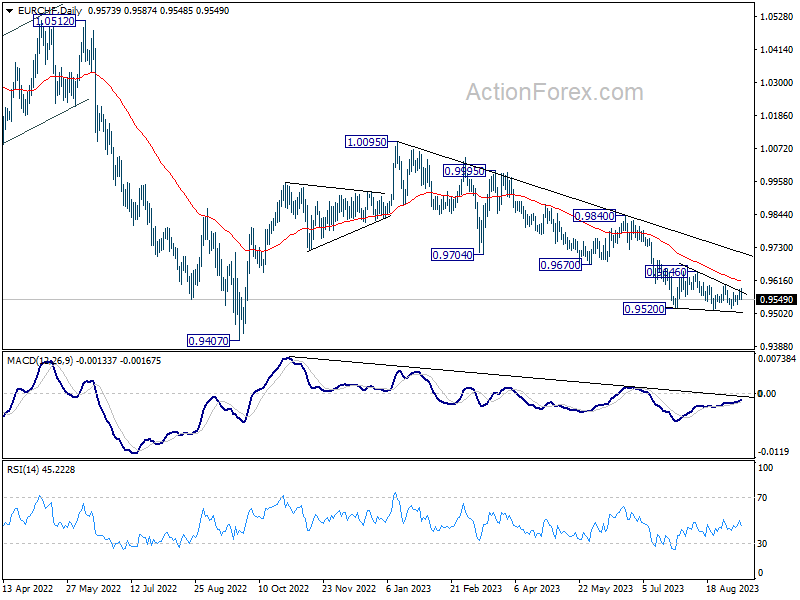
Daily Pivots: (S1) 0.9557; (P) 0.9571; (R1) 0.9591; More...
Intraday bias in EUR/CHF remains neutral for the moment, and outlook stays bearish with 0.9601 resistance intact. On the downside, decisive break of 0.9513 will resume the decline from 1.0095, towards 0.9407 low. However, break of 0.9601 resistance will turn bias back to the upside for stronger rebound to 0.9646 resistance and above.
In the bigger picture, medium term outlook is staying bearish as the cross is capped well below falling 55 W EMA (now at 0.9818). Down trend from 1.2004 (2018 high) is in favor to continue. Sustained break of 0.9407 will target 61.8% projection of 1.1149 to 0.9407 from 1.0095 at 0.9018. For now, this will remain the favored case as long as 0.9670 support turned resistance holds, in case of strong rebound.
Another BoE Hike Likely as Wage Growth Continues to Rise
The Bank of England may have little option but to raise rates again next week despite comments recently indicating the debate will be fairly balanced.
The UK labour market figures offer something for everyone on the face of it but under the circumstances, BoE hawks will likely be more emboldened by the figures than the doves.
Employment figures fell for a second month as the unemployment rate stayed at 4.3% which may be viewed as mildly encouraging to policymakers hoping to see more slack in the labour market. But much more progress will be needed if we're going to see the vote swing in favour of a hold.
Especially when wage growth is continuing to rise, with average earnings not only rising to 8.5%, including bonuses but the June figure also being revised higher to 8.4%. I don't see how the MPC can see that and even consider pausing on the whole and markets seem to agree, with a 25 basis point hike almost 80% priced in. What comes after that is harder to judge at this stage and will depend on how the data performs over the next two months.
Oil rally slows but Brent remains above $90
Oil prices are creeping higher again on Tuesday, with Brent trading around $91 despite there being a mixed view on the economic outlook. As we heard from the European Commission yesterday, growth in the euro area is going to be relatively minor, with Germany struggling to avoid another recession.
The UK has shown a lot more resilience than anticipated but still faces recession risks and marginal growth at best. People are feeling a little more optimistic about the US, with last week's services PMI backing that up, but even here there are significant downside risks. While China is a big unknown with efforts to stimulate the economy being targeted and far from guaranteed to boost growth substantially.
That said, one thing we're guaranteed is supply to continue to be restricted until the end of the year at least following the recent announcement by Saudi Arabia and Russia. The rally has stalled a little over the last week but there are few signs of a corrective move lower at this stage and therefore I suspect we'll hear a lot more $100 oil chat before long.
Gold remains soft ahead of the US inflation report
Gold rallies over the last couple of days have been far from encouraging, with gains being quickly unwound to end the session far from the highs. That's despite the dollar easing on Monday which appeared to support gold prices but clearly not for that long which could be a bearish signal.
The greenback is slightly higher this morning which is weighing on the yellow metal a little. While you could read more into price action over the last couple of sessions, I'm inclined not to with the US inflation data due tomorrow. That will likely drive the next move and could heavily influence what the Fed does next week.
EUR/USD Daily Outlook
Daily Pivots: (S1) 1.0719; (P) 1.0739; (R1) 1.0770; More...
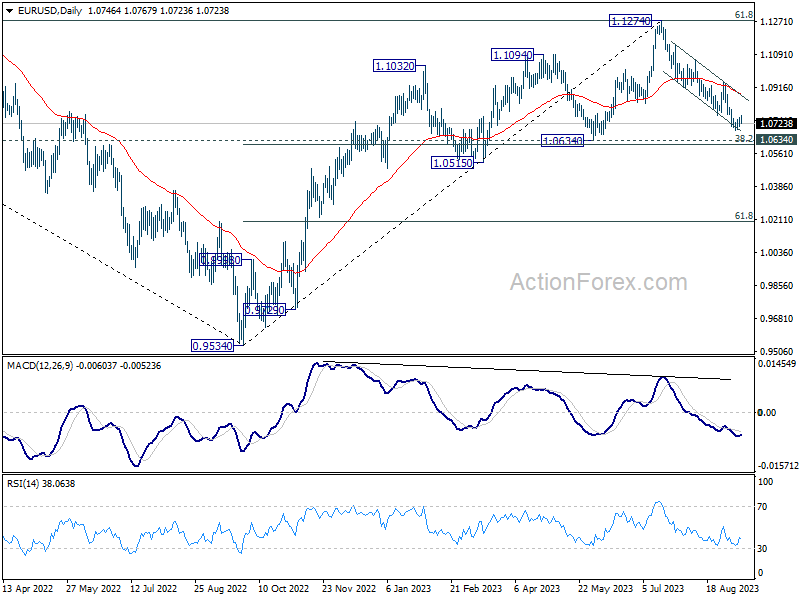
Intraday bias in EUR/USD stays neutral as consolidation continues above 1.0685. Outlook will stay bearish as long as 1.0944 resistance holds. On the downside, below 1.0685 will resume the fall from 1.1274 to 1.0609/34 cluster support zone next.
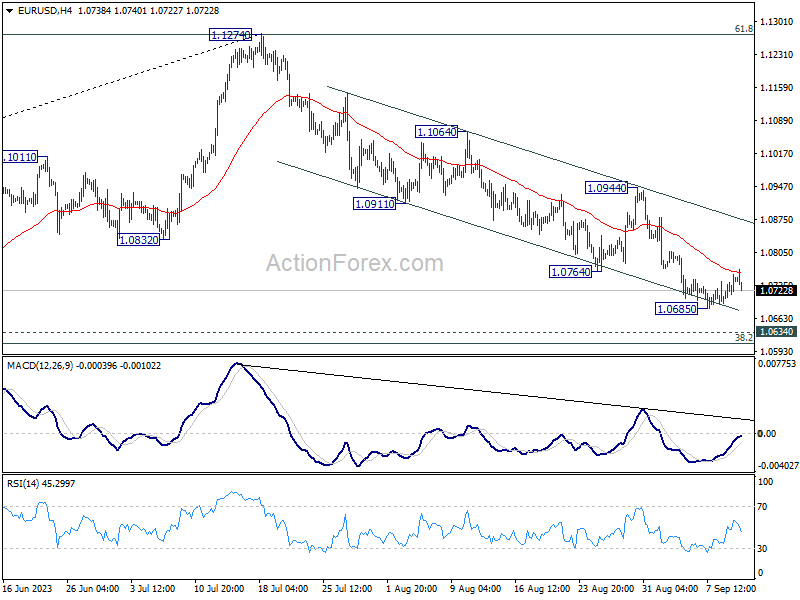
In the bigger picture, fall from 1.1274 medium term top is seen as a correction to up trend from 0.9534 (2022 low). Strong support could be seen from 1.0634 cluster support (38.2% retracement of 0.9534 to 1.1274 at 1.0609) to bring rebound, at least on first attempt. Break of 1.0944 will indicate the start of the second leg, and target retest of 1.1274. However, sustained break of 1.0609/0634 will raise the chance of bearish trend reversal, and target 61.8% retracement at 1.0199.