Sample Category Title
Dollar Selloff Extends after PCE Inflation, Breaking to the Downside
Dollar's selloff picks up momentum in early US session after PCE inflation slowed more than expected in October, while core PCE also declined. The data give a nod to Fed Chair Jerome Powell's comment that smaller rate hikes could start in December. Yen is the better performer as supported by extended pull back in US and European benchmark yields. But Euro and Sterling are clearly advancing with more conviction. Commodity currencies are also firm but lag behind.
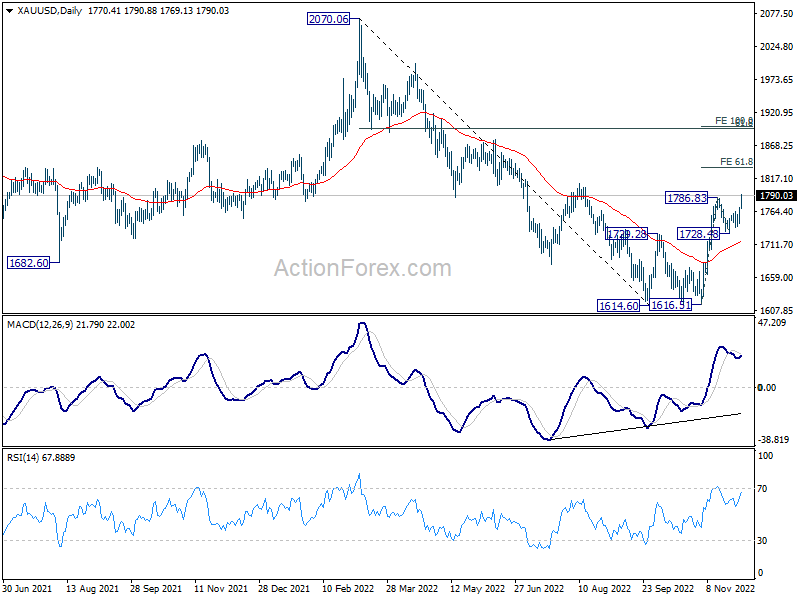
Technically, EUR/USD is breaking 1.0496 while GBP/USD has taken out 1.2152 resistance, confirming resumption of recent rally. Similarly, Gold has also taken out 1786.83 resistance to resume the rise from 1616.51. Next target is 61.8% projection of 1616.51 to 1786.83 from 1728.43 at 1833.73. It's a bit early to judge, but there is prospect of extending the rise to 1900 handle, which is close to another cluster fibonacci level.
In Europe, at the time of writing, FTSE is up 0.16%. DAX is up 1.01%. CAC is up 0.46%. Germany 10-year yield is down -0.1074 at 1.827. Earlier in Asia, Nikkei rose 0.92%. Hong Kong HSI rose 0.75%. China Shanghai SSE rose 0.45%. Singapore Strait Times rose 0.07%. Japan 10-year JGB yield rose 0.0006 to 0.251.
US PCE slowed to 6.0% yoy in Oct, core PCE down to 5.0% yoy
US personal income rose 0.7% mom to USD 155.3B in October, above expectation of 0.4% mom. Personal spending rose 0.8% mom to USD 147.9B, matched expectations.
For the month, PCE price index rose 0.3% mom, below expectation of 0.5% mom. PCE core (excluding food and energy) rose 0.2% mom, below expectation of 0.4% mom.
From the same month ago, PCE price index slowed from 6.3% yoy to 6.0% yoy, below expectation of 6.0% yoy. PCE core price index slowed from 5.2% yoy to 5.0% yoy, matched expectations. Prices for goods rose 7.2% yoy and prices for services rose 5.4% yoy. Food prices rose 11.6% yoy and energy prices rose 18.4% yoy.
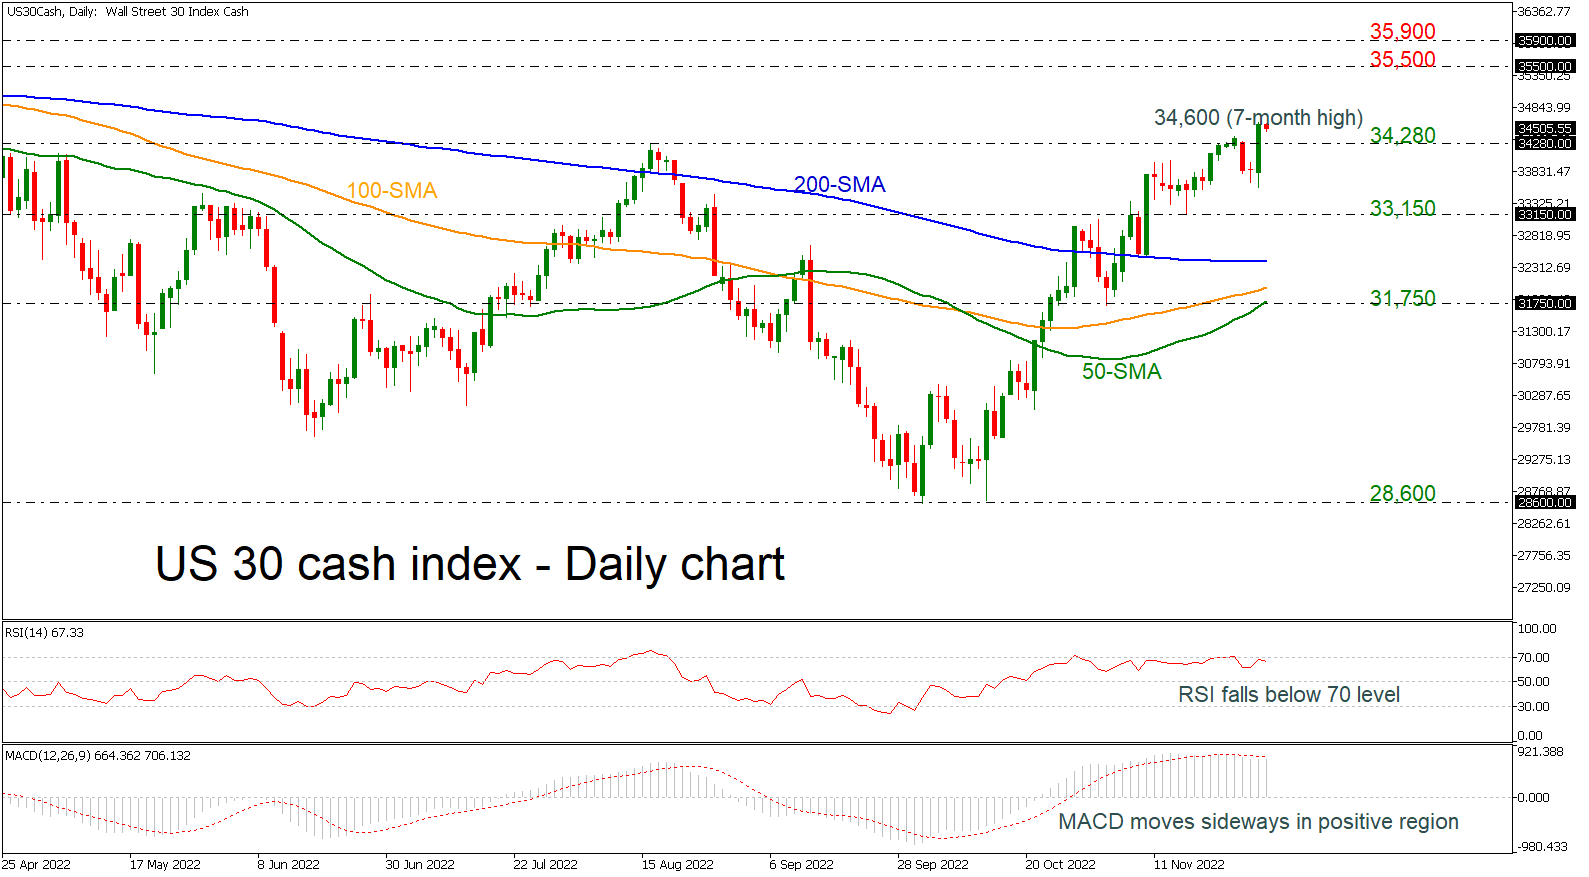
US initial jobless claims dropped back to 225k
US initial jobless claims dropped -16k to 225k in the week ending November 26, below expectation of 245k. Four-week moving average of initial claims rose 2k to 229k.
Continuing claims rose 57k to 1608k in the week ending November 19. Four-week moving average of continuing claims rose 30k to 1539k.
Eurozone PMI manufacturing finalized at 47.1, welcome moderation in downturn intensity
Eurozone PMI Manufacturing was finalized at 47.1in November, up from October's 46.4. Looking at some member countries, Ireland PMI Manufacturing was at 48.7 (30 mth-low), Italy at 48.4, Greece at 48.4, France at 48., Austria at 46.6, Germany at 46.2, the Netherlands at 46.0 (29-mth low), and Spain at 45.7. All were in contraction.
Chris Williamson, Chief Business Economist at S&P Global Market Intelligence said: "The PMI signals some welcome moderation in the intensity of the eurozone manufacturing downturn in November, which will support hopes that the region many not be facing a winter downturn as severe as previously anticipated by many. However, the survey's production index continuing to run at one of the lowest levels recorded over the past decade. At these levels the survey is indicative of a marked annualised rate of contraction of approximately 4%. While official manufacturing data have been more buoyant – and more volatile – in recent months, such weak PMI readings have always been followed by commensurate steep declines in the official statistics."
UK PMI manufacturing finalized at 46.5, further contraction, outlook darkened
UK PMI Manufacturing was finalized at 46.5 in November, up from October's 46.2. S&P Global said intermediate goods remained the weakest performing sector. Business sentiment dipped to the lowest since April 2020. Input price inflation eased to three-month low.
Rob Dobson, Director at S&P Global Market Intelligence, said: "November saw a further contraction of the UK manufacturing sector, as weak demand, declining export sales, high energy prices and component shortages all hit industry hard. The outlook for the sector also darkened, as confidence among manufacturers fell to its lowest level since April 2020. ... The trend in new export business was especially weak, as Brexit issues and supply chain stresses exacerbated the effects of a weakening global economic backdrop, leading to lower sales from the US, the EU and China."
Swiss CPI unchanged at 3.0% yoy in Nov
Swiss CPI was unchanged at 3.0% yoy in November, above expectation of 2.6% yoy. Core CPI (excluding fresh and seasonal products, energy and fuel) rose from 1.8% yoy to 1.9% yoy. Domestic product inflation rose from 1.7% yoy to 1.7% yoy. But Imported product inflation slowed from 6.9% yoy to 6.3% yoy.
FSO said: "The stability of the index compared with the previous month is the result of opposing trends that offset each other overall. Prices for housing rentals, gas and fuels increased, as did those for foreign and Swiss red wine. In contrast, prices for heating oil, fruiting vegetables and hotel accommodation decreased."
Also released, retail sales dropped -2.5% yoy in October, worse than expectation of 3.3% yoy rise.
BoJ Noguchi: Must maintain monetary easing
BoJ board member Asahi Noguchi said the central bank must continue to maintain monetary easing, keep interest rates at low levels now as achievement of 2% inflation target remains uncertain.
"While not as much as other countries, Japan's consumer prices have risen sharply. This increase is driven mostly by rising imported goods prices," he said. "What's more important in deciding monetary policy is trend inflation based on domestic macro-economic factors, which remains at low levels."
Inflation is likely to fall back below 2% once these cost-push factors dissipate.
China Caixin PMI Manufacturing rose to 49.4 in Nov, pandemic continued to take a toll
China Caixin PMI Manufacturing rose from 49.2 to 49.4 in November, above expectation of 48.6. Caixin said that Covid-19 restrictions continued to constrain output. New orders fell, albeit at softest rate in four months. Supply chain delays worsened.
Wang Zhe, Senior Economist at Caixin Insight Group said: "Overall, the pandemic continued to take a toll on the economy. Output contracted, total demand was under pressure, overseas demand remained weak, employment deteriorated, logistics was sluggish, and manufacturers faced growing operating pressure. As the measure for suppliers' delivery times is negatively correlated to the PMI, the fall in the measure partially offset the drop in the PMI, leading the decline in November manufacturing activity to be underestimated."
GBP/USD Mid-Day Outlook
Daily Pivots: (S1) 1.1944; (P) 1.2015; (R1) 1.2130; More...
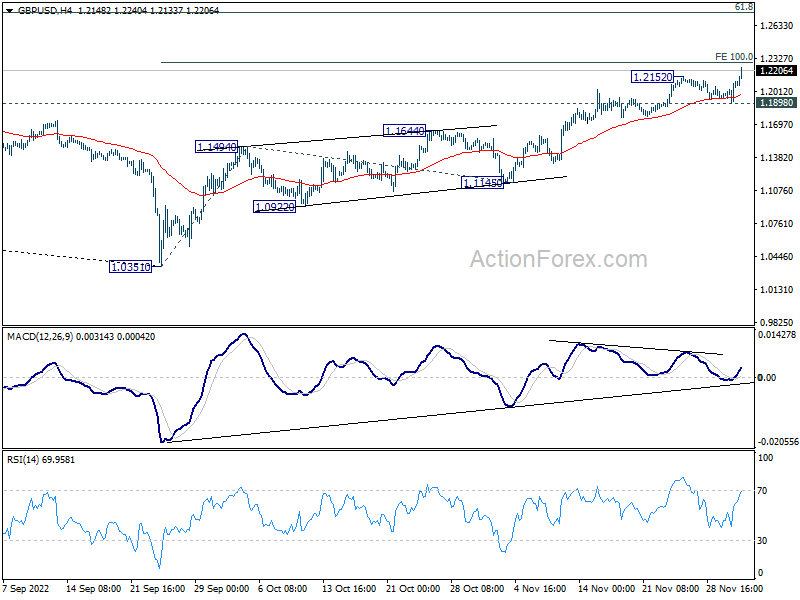
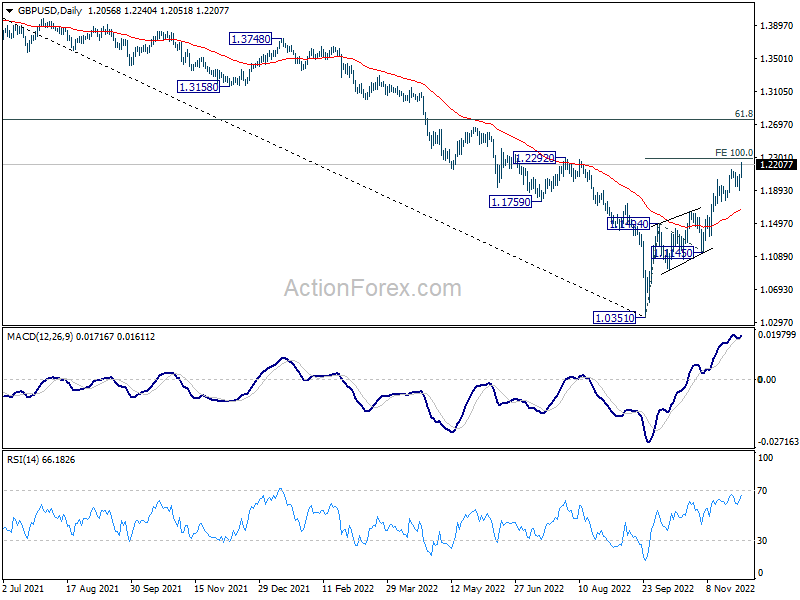
GBP/USD's rally resumed by breaking 1.2152 and intraday bias is back on the upside. Current rise from 1.0351 should target 100% projection of 1.0351 to 1.1494 from 1.1145 at 1.2288 first. Sustained break there will pave the way to 1.2759 medium term fibonacci level. On the downside, break of 1.1898 minor support is needed to indicate short term topping, otherwise, further rally will remain in favor in case of retreat.
In the bigger picture, rise from 1.0351 medium term bottom is at least correcting whole down trend from 1.4248 (2021 high). Further rise is expected as long as 1.1145 support holds. Next target is 61.8% retracement of 1.4248 to 1.0351 at 1.2759. Sustained break there will pave the way back to 1.4248.
Economic Indicators Update
| GMT | Ccy | Events | Actual | Forecast | Previous | Revised |
|---|---|---|---|---|---|---|
| 21:30 | AUD | AiG Performance of Mfg Index Nov | 44.7 | 49.6 | ||
| 00:30 | AUD | Private Capital Expenditure Q3 | -0.60% | 1.20% | -0.30% | |
| 00:30 | JPY | Manufacturing PMI Nov F | 49 | 49.4 | 49.4 | |
| 01:45 | CNY | Caixin Manufacturing PMI Nov | 49.4 | 48.6 | 49.2 | |
| 05:00 | JPY | Consumer Confidence Nov | 28.6 | 30.2 | 29.9 | |
| 07:00 | EUR | Germany Retail Sales M/M Oct | -2.80% | -0.60% | 0.90% | |
| 07:30 | CHF | Real Retail Sales Y/Y Oct | -2.50% | 3.30% | 3.20% | 2.60% |
| 07:30 | CHF | CPI M/M Nov | 0.00% | 0.20% | 0.10% | |
| 07:30 | CHF | CPI Y/Y Nov | 3.00% | 2.60% | 3.00% | |
| 08:30 | CHF | Manufacturing PMI Nov | 53.9 | 53 | 54.9 | |
| 08:45 | EUR | Italy Manufacturing PMI Nov | 48.4 | 47.3 | 46.5 | |
| 08:50 | EUR | France Manufacturing PMI Nov F | 48.3 | 49.1 | 49.1 | |
| 08:55 | EUR | Germany Manufacturing PMI Nov F | 46.2 | 46.7 | 46.7 | |
| 09:00 | EUR | Eurozone Manufacturing PMI Nov F | 47.1 | 47.3 | 47.3 | |
| 09:30 | GBP | Manufacturing PMI Nov F | 46.5 | 46.2 | 46.2 | |
| 10:00 | EUR | Eurozone Unemployment Rate Oct | 6.50% | 6.60% | 6.60% | |
| 12:30 | USD | Challenger Job Cuts Y/Y Nov | 416.50% | 48.30% | ||
| 13:30 | CAD | Labor Productivity Q/Q Q3 | 0.60% | 0.30% | 0.20% | 0.10% |
| 13:30 | USD | Personal Income M/M Oct | 0.70% | 0.40% | 0.40% | |
| 13:30 | USD | Personal Spending Oct | 0.80% | 0.80% | 0.60% | |
| 13:30 | USD | PCE Price Index M/M Oct | 0.30% | 0.50% | 0.30% | |
| 13:30 | USD | PCE Price Index Y/Y Oct | 6.00% | 6.20% | 6.20% | 6.30% |
| 13:30 | USD | Core PCE Price Index M/M Oct | 0.20% | 0.40% | 0.50% | |
| 13:30 | USD | Core PCE Price Index Y/Y Oct | 5.00% | 5.00% | 5.10% | 5.20% |
| 13:30 | USD | Initial Jobless Claims (Nov 25) | 225K | 245K | 240K | 241K |
| 14:30 | CAD | Manufacturing PMI Nov | 50 | 48.8 | ||
| 14:45 | USD | Manufacturing PMI Nov F | 47.6 | 47.6 | ||
| 15:00 | USD | ISM Manufacturing PMI Nov | 50.5 | 50.2 | ||
| 15:00 | USD | ISM Manufacturing Prices Paid Nov | 47.3 | 46.6 | ||
| 15:00 | USD | ISM Manufacturing Employment Index Nov | 50 | |||
| 15:00 | USD | Construction Spending M/M Oct | -0.10% | 0.20% | ||
| 15:30 | USD | Natural Gas Storage | -82B | -80B |
US initial jobless claims dropped back to 225k
US initial jobless claims dropped -16k to 225k in the week ending November 26, below expectation of 245k. Four-week moving average of initial claims rose 2k to 229k.
Continuing claims rose 57k to 1608k in the week ending November 19. Four-week moving average of continuing claims rose 30k to 1539k.
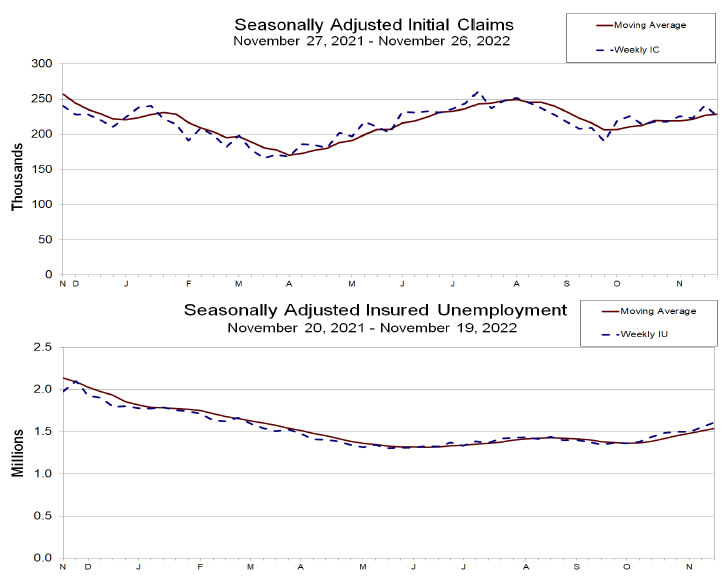
US PCE slowed to 6.0% yoy in Oct, core PCE down to 5.0% yoy
US personal income rose 0.7% mom to USD 155.3B in October, above expectation of 0.4% mom. Personal spending rose 0.8% mom to USD 147.9B, matched expectations.
For the month, PCE price index rose 0.3% mom, below expectation of 0.5% mom. PCE core (excluding food and energy) rose 0.2% mom, below expectation of 0.4% mom.
From the same month ago, PCE price index slowed from 6.3% yoy to 6.0% yoy, below expectation of 6.0% yoy. PCE core price index slowed from 5.2% yoy to 5.0% yoy, matched expectations. Prices for goods rose 7.2% yoy and prices for services rose 5.4% yoy. Food prices rose 11.6% yoy and energy prices rose 18.4% yoy.
Silver Bulls Roar Back; Meet Key Resistance
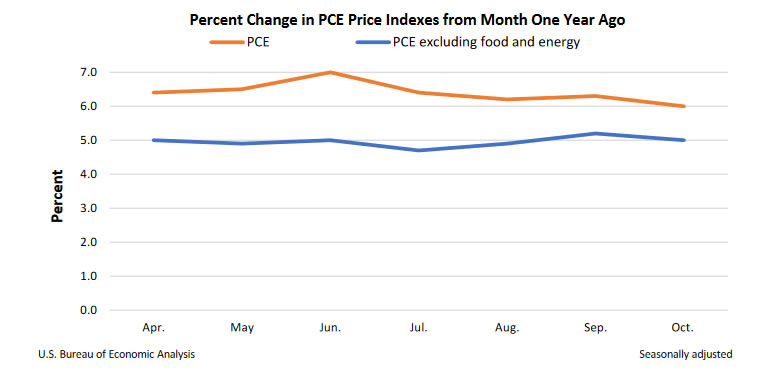
Silver staged an exciting rally to re-enter the 22.00 region on the back of Powell’s dovish tone on Wednesday.
The 50% Fibonacci retracement of the 26.93-17.54 downtrend at 22.25 is again under the spotlight, pushing the market back to losses after the pickup to a new high of 22.39 early on Thursday. Yet, the bulls may have some extra fuel in the tank according to the RSI and the MACD. The former has recently recouped some ground above its 50 neutral mark, while the latter keeps gaining positive momentum, currently set to climb above its red signal line.
If the wall at 22.25 collapses, the bulls will gear up for the 23.00 psychological mark. Breaching the latter, the rally could continue towards the 61.8% Fibonacci of 23.95.
In the event of a downside reversal, the price may initially seek support between 21.60 and 21.35, where the 20- and 200-day simple moving averages (SMAs) are placed. The 38.2% Fibonacci of 21.12 may cement that floor, delaying an extension to the previous low of 20.56. Otherwise, the decline could stretch towards the 50-day SMA, bringing the 23.6% Fibonacci of 19.75 in sight too.
In short, silver is currently testing an important resistance region at 22.25, a break of which is required to activate fresh buying.
US 30 Index Unlocks New More-than-7-month High
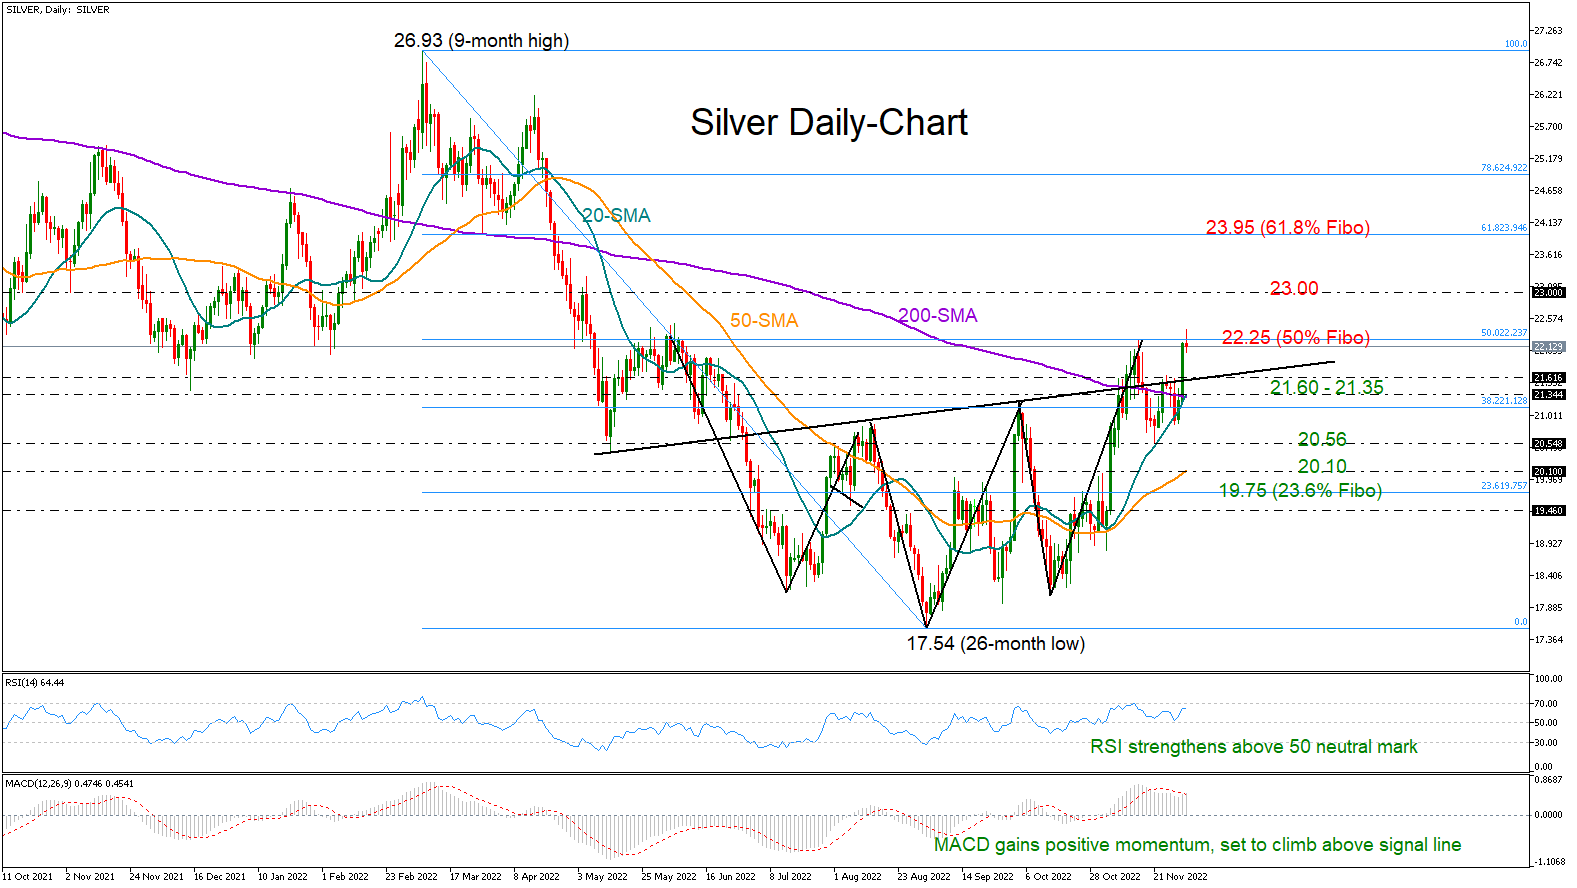
The US 30 cash index posted a notable bullish day yesterday, jumping above a key level of 34,280, adding to the optimism for further positive movements. The index hit a fresh more-than-seven-month high of 34,600; however, the technical oscillators are currently suggesting a bearish correction. The RSI touched the overbought region and dived lower, while the MACD is holding beneath its trigger line.
Should the price manage to reinforce the upside move, the next resistance could come around 35,500, registered on April 17. A break above this line would take the market towards the 35,900 resistance, taken from the peak on February 6.
However, if prices are unable to break the recent high in the next few sessions, the risk would shift back to the downside, with the 34,280 immediate support coming into focus as well as the 33,150 barrier. A drop below this area would test the 200-day simple moving average (SMA) at 32,400 ahead of the 100- and 50-day SMAs at 32,000 and 31,750 respectively. The next hurdle to watch lower down is 28,600 that will switch the outlook to bearish again.
In a nutshell, the index is bullish after the bounce off 28,600 in the short-term and any moves above the next resistance levels may change the broader picture to positive as well.
Platinum Wave Analysis
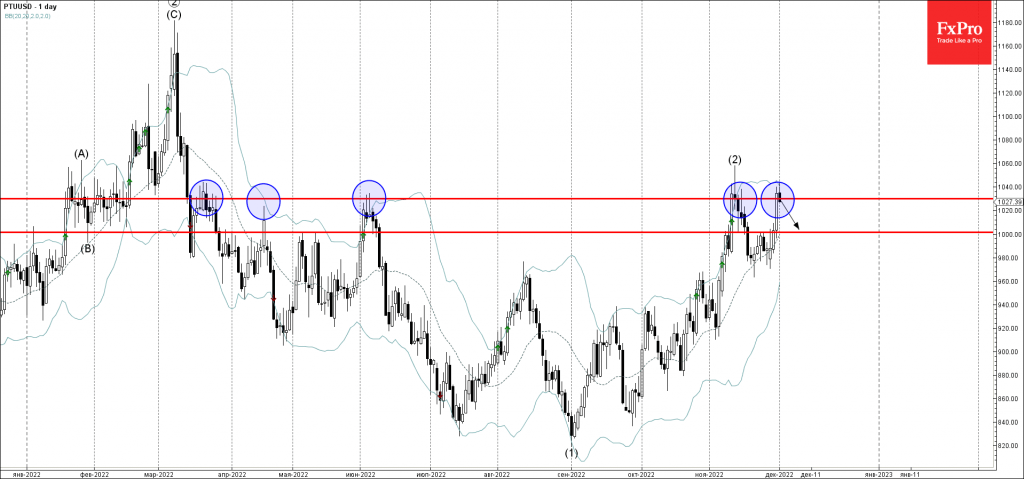
- Platinum reversed from powerful resistance 1030.00
- Likely to fall to support level 1000.00
Platinum today reversed down from the powerful, multi-month resistance level 1030.00 (which has been reversing the price from the end of March).
The resistance zone near the resistance level 1030.00 was strengthened by the upper daily Bollinger Band.
Platinum can be expected to fall further toward the next round support level 1000.00 (former minor resistance from the end of November, acting as the support after it was broken earlier).
AUDNZD Wave Analysis
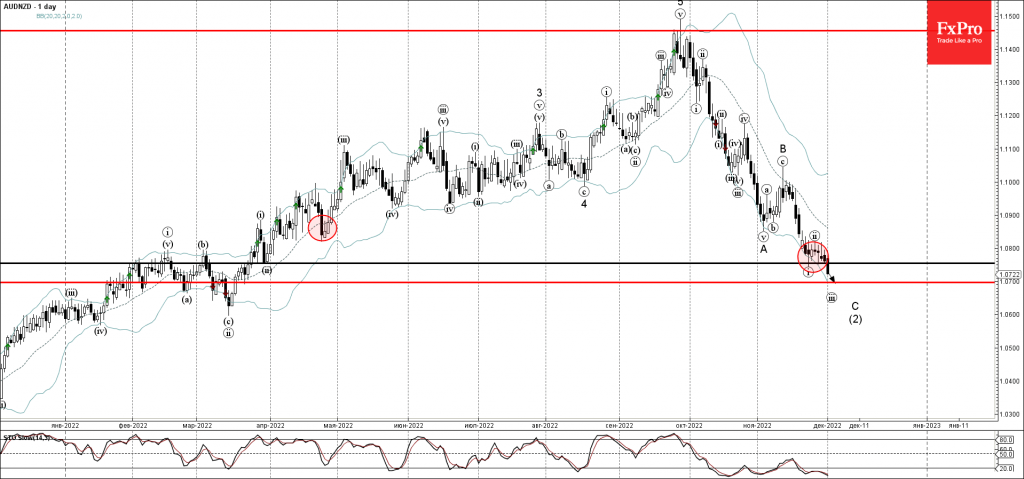
- AUDNZD broke support level 1.0755
- Likely to fall to support level 1.0700
AUDNZD under the bearish pressure after the earlier breakout of the key support level 1.0755 (which has been reversing the price from May).
The breakout of the support level 1.0755 accelerated the impulse wave (iii) of the medium-term downward impulse wave C from the middle of November.
AUDNZD can be expected to fall further toward the next support level 1.0700 (target for the completion of the active impulse wave (iii)).
NZDUSD Wave Analysis
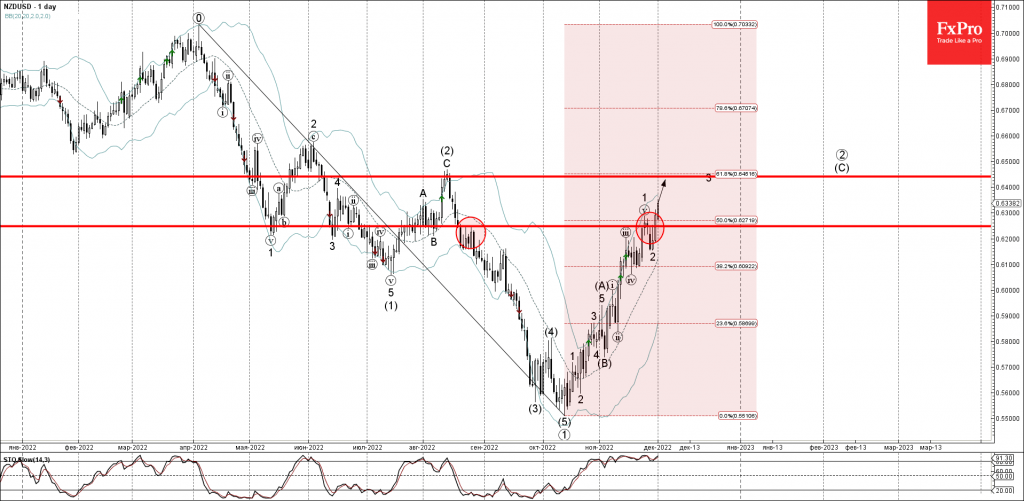
- NZDUSD broke key resistance level 0.6250
- Likely to rise to resistance level 0.6440
NZDUSD recently broke the key resistance level 0.6250 (which has been reversing the price from August), intersecting with the 50% Fibonacci correction of the downward impulse from April.
The breakout of the resistance level 0.6250 accelerated the impulse wave 3 of the impulse sequence (C) from the start of November.
NZDUSD can be expected to rise further toward the next resistance level 0.6440 (multi-month high from August, target for the completion of the active impulse wave 3).
EUR/USD: Euro Keeps Firm Tone on Weaker Dollar, Improved Economic Data
The Euro extends higher in early Thursday as the risk sentiment was boosted by comments from Fed Powell who signaled a lower pace of rate hikes in the near future.
The single currency keeps firm tone following Wednesday’s 0.76% advance, underpinned by stronger than expected easing in inflation and slight improvement Eurozone manufacturing sector.
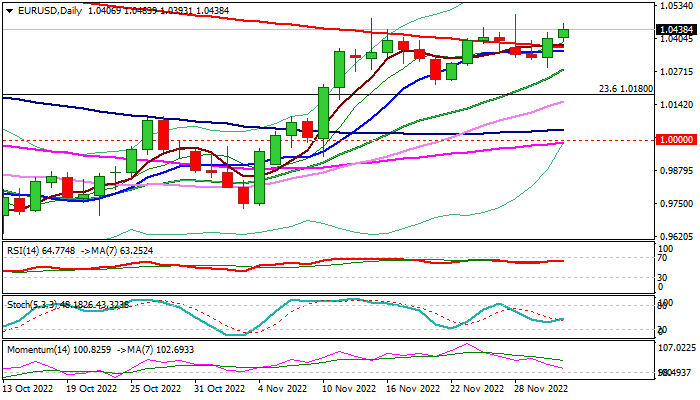
Daily studies are mixed, with bullish signal generated on Wednesday’s break above converged 10/200/100 DMA’s, countered by recent long upper shadows on daily candles and strong fall of bullish momentum.
On the other hand, large bullish monthly candle of November underpins and brightens the outlook.
Bulls eye immediate barriers at 1.0481/96 (Nov 15/28 spile highs, reinforced by upper 20-week Bollinger band, which guards key resistance at 1.0578 (Fibo 38.2% of 1.2266/0.9535), with break here to generate reversal signal.
Repeated close above 200DMA (1.0369) to keep immediate bulls in play, though larger bullish structure would remain intact while the action stays above 1.0281/22 (rising 20DMA / Nov 21 higher low).
Res: 1.0496; 1.0578; 1.0620; 1.0700.
Sup: 1.0393; 1.0369; 1.0281; 1.0222.
Australian Dollar Flies after Powell Speech
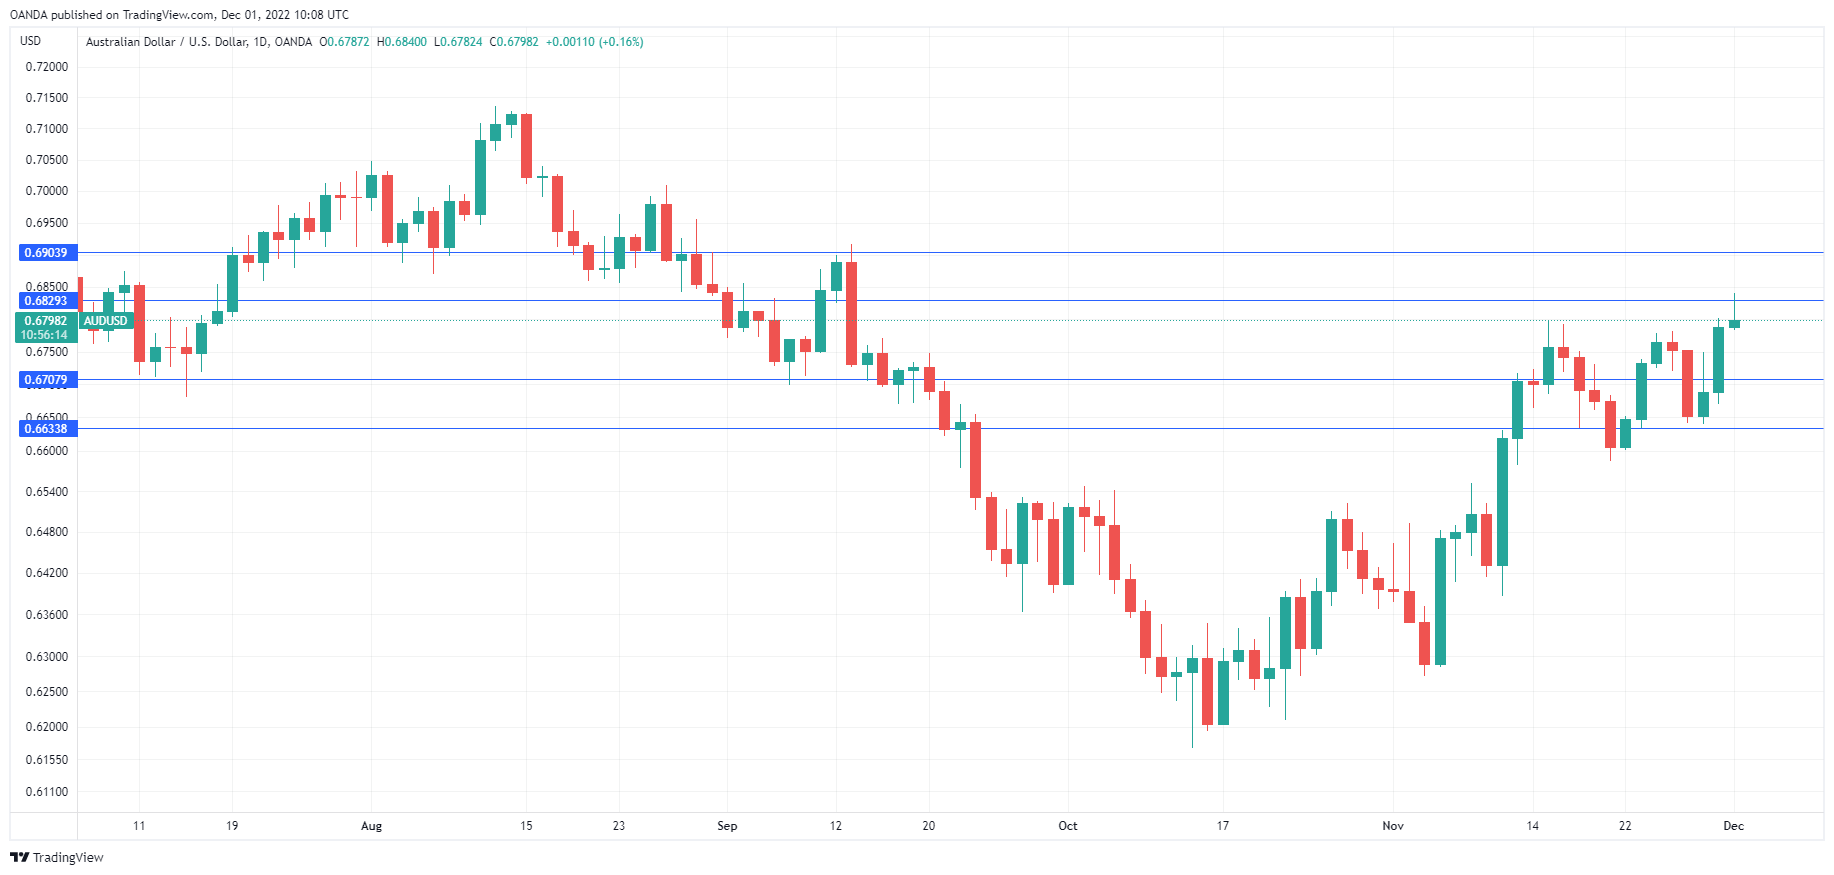
AUD/USD continues to power upwards and hit 10-week highs earlier today. The Australian dollar climbed 1.5% on Wednesday and has edged higher today. In the European session, AUD/USD is trading at 0.6796, up 0.14%.
US dollar slides after Powell speech
Fed Chair Jerome Powell spoke on Wednesday and gave the markets what they wanted to hear with regard to the December rate hike. Powell strongly hinted that the Fed would slow the pace of rate increases at the December 14th meeting, after four successive 75-bp hikes. Powell said that slowing down at this point “is a good way to balance the risks”, as the Fed Chair is trying to slow the economy while avoiding a recession. The markets duly responded by pricing in a 50-bp rate hike at 80%, up sharply from 65% prior to Powell’s remarks. This sent financial markets higher, while the US dollar was broadly lower.
Investors focussed on Powell’s hint that rate hikes will slow at the next meeting, choosing to ignore his comments that rates could rise higher than previously expected and for a prolonged period in order to curb stubborn inflation. The likely easing to 50 bp was a green light for the markets, and what is down the road can be worried about another time.
In Australia, Private Capital Expenditure disappointed in Q3 with a reading of -0.6%. This was below the Q2 reading of 0.0% and way off the consensus of 1.5%. The RBA meets on December 6th after having eased on rate hikes, with two straight increases of 25-bp. The cash rate is currently at 2.85%, and there is a good chance that the RBA will again raise rates by 25 bp next week, as it looks to fight inflation while guiding the economy to a soft landing.
AUD/USD Technical
- AUD/USD is testing resistance at 0.6829. Above, there is resistance at 0.6903
- There is support at 0.6707 and 0.6633