Sample Category Title
Dollar Index: Dollar Under Fresh Pressure from Less Hawkish than Expected Powell
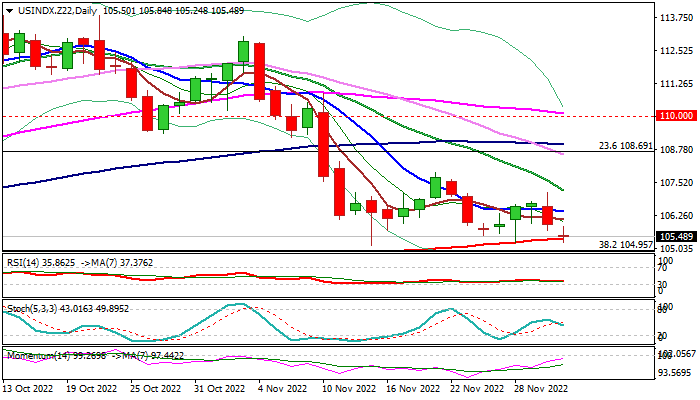
The dollar index stabilized in early European trading on Thursday, after a gap lower opening and dip to two-week low, as less hawkish than expected remarks from Fed Chair Powell on Wednesday, soured the sentiment.
Powell signaled that the central bank is likely to slow the pace in policy tightening, following a series of jumbo hikes in recent meetings, but repeated that the Fed will continue to raise interest rates in attempts to put high inflation under control and push it towards 2% target.
He also pointed to necessary adjustment to new economic conditions as higher borrowing cost is expected to last for some time, due to slow reaction of inflation to the central bank’s measures and lower supply in labor market.
Fresh weakness cracked the upper boundary of strong support zone at 105.41/104.95 (defined by 200DMA and Fibo 38.2% of 89.15/114.72 rally) where larger bears continue to face headwinds.
Prevailing bearish tone from Powell’s remarks adds to negative daily technical studies (MA’s in bearish setup, RSI / stochastic heading south, partially countered by rising momentum, although the indicator is still in negative territory).
Stronger bearish signal comes from monthly chart, as the dollar index ended trading in November with a massive losses of nearly 5% (the biggest monthly fall since May 2009), forming reversal pattern, with the action being heavily weighed by large bearish monthly candle.
Near-term focus remains shifted to the downside, although the action may hold in extended consolidation before fresh push lower.
Clear break of pivotal 105.41/104.95 support zone, would open way for deeper correction of 89.15/114.72 uptrend and expose targets at 102.94 (55WMA) and 101.94 (50% retracement).
Near-term range should remain capped under pivotal resistances at 107.22 (20DMA) and 107.88 (Nov 21 high) to keep larger bears intact.
Res: 105.84; 106.40; 107.22; 107.88.
Sup: 105.15; 104.96; 104.49; 103.18.
UK PMI manufacturing finalized at 46.5, further contraction, outlook darkened
UK PMI Manufacturing was finalized at 46.5 in November, up from October's 46.2. S&P Global said intermediate goods remained the weakest performing sector. Business sentiment dipped to the lowest since April 2020. Input price inflation eased to three-month low.
Rob Dobson, Director at S&P Global Market Intelligence, said: "November saw a further contraction of the UK manufacturing sector, as weak demand, declining export sales, high energy prices and component shortages all hit industry hard. The outlook for the sector also darkened, as confidence among manufacturers fell to its lowest level since April 2020. ... The trend in new export business was especially weak, as Brexit issues and supply chain stresses exacerbated the effects of a weakening global economic backdrop, leading to lower sales from the US, the EU and China."

AUDUSD Targets 200-SMA after Solid November
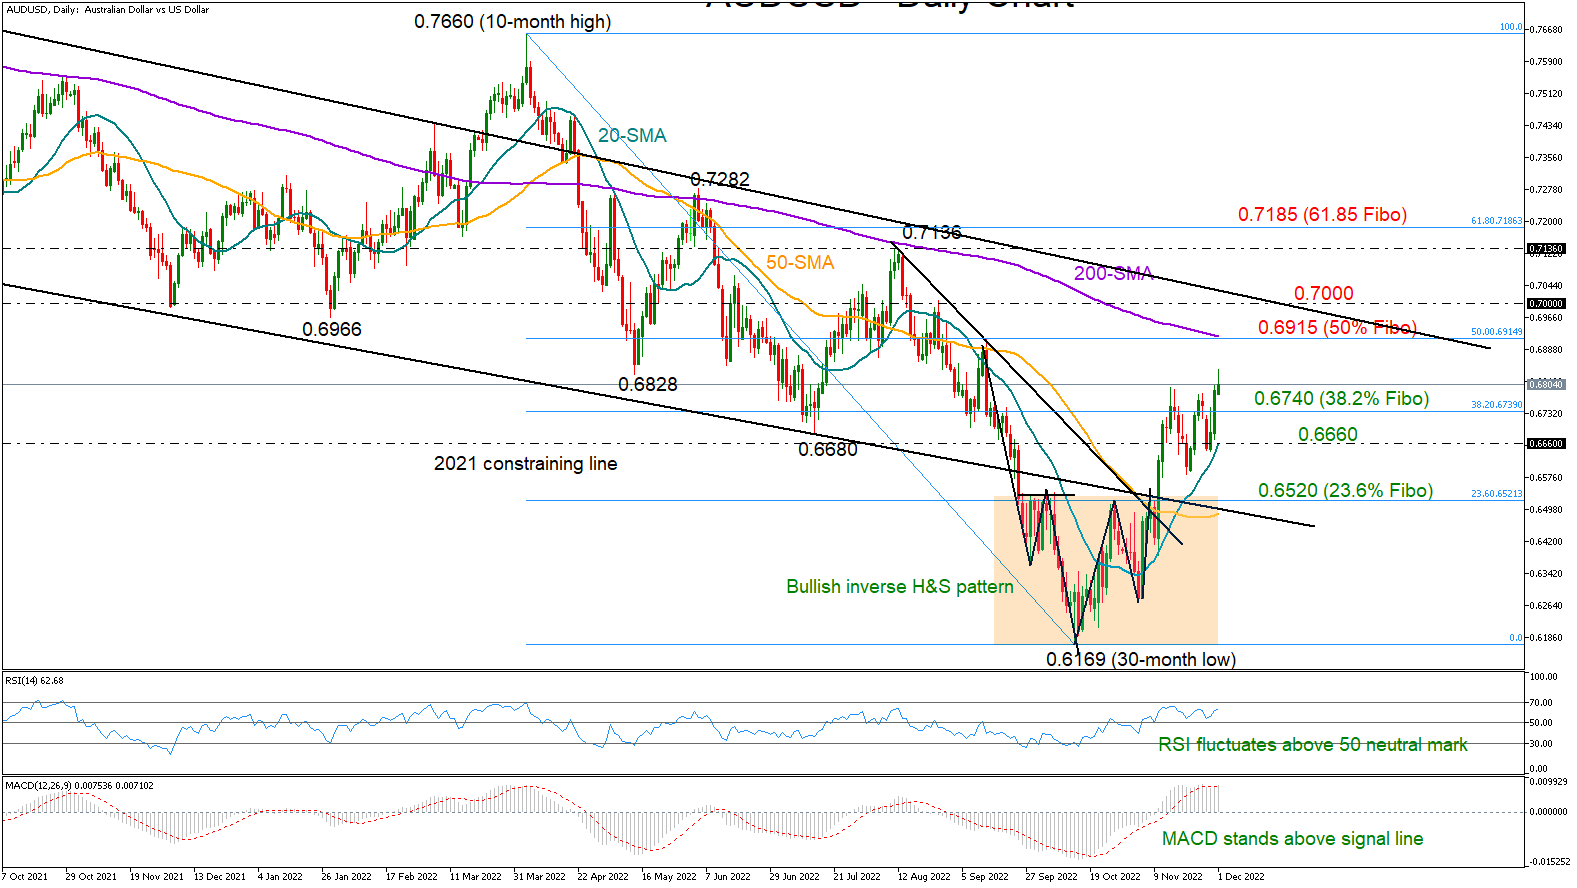
AUDUSD jumped into the 0.6800 territory early on Thursday after a remarkable session in November, which added 6% to the pair’s value—the largest gain since April 2020.
The progress followed the confirmation of a bullish inverse head and shoulders (H&S) pattern near the 30-month low of 0.6169, though the 200-day simple moving average (SMA), which has been a major obstacle to bullish actions, remains a threat at 0.6915. The 50% Fibonacci retracement of the 0.7660-0.6169 downtrend is also in the neighborhood.
Nevertheless, overbought signals haven’t been detected yet, with the RSI and the MACD feeding optimism for further recovery, as the indicators keep fluctuating comfortably within the bullish area.
Should the price advance sustainably above 0.6915, the spotlight will immediately turn to the 0.7000 psychological mark. A penetration of that barrier could provide direct access to the 0.7136–0.7185 zone, where the pair peaked in mid-August.
In the event of a bearish reversal, the 38.2% Fibonacci of 0.6740 may attract some attention ahead of the 20-day SMA, currently around 0.6660. If the latter proves fragile, the sell-off could intensify towards the 23.6% Fibonacci of 0.6520 and the 50-day SMA. Slightly lower, the long-term constraining line drawn from August 2021 could be another important area to watch.
Summarizing, AUDUSD may preserve buying interest in the short term, though whether it will overcome the crucial 200-day SMA remains to be seen. Interestingly, the monthly chart has a clear bullish doji candlestick formation, flagging more appreciation ahead.
WTI Oil Futures Bounce Off 11-Month Low
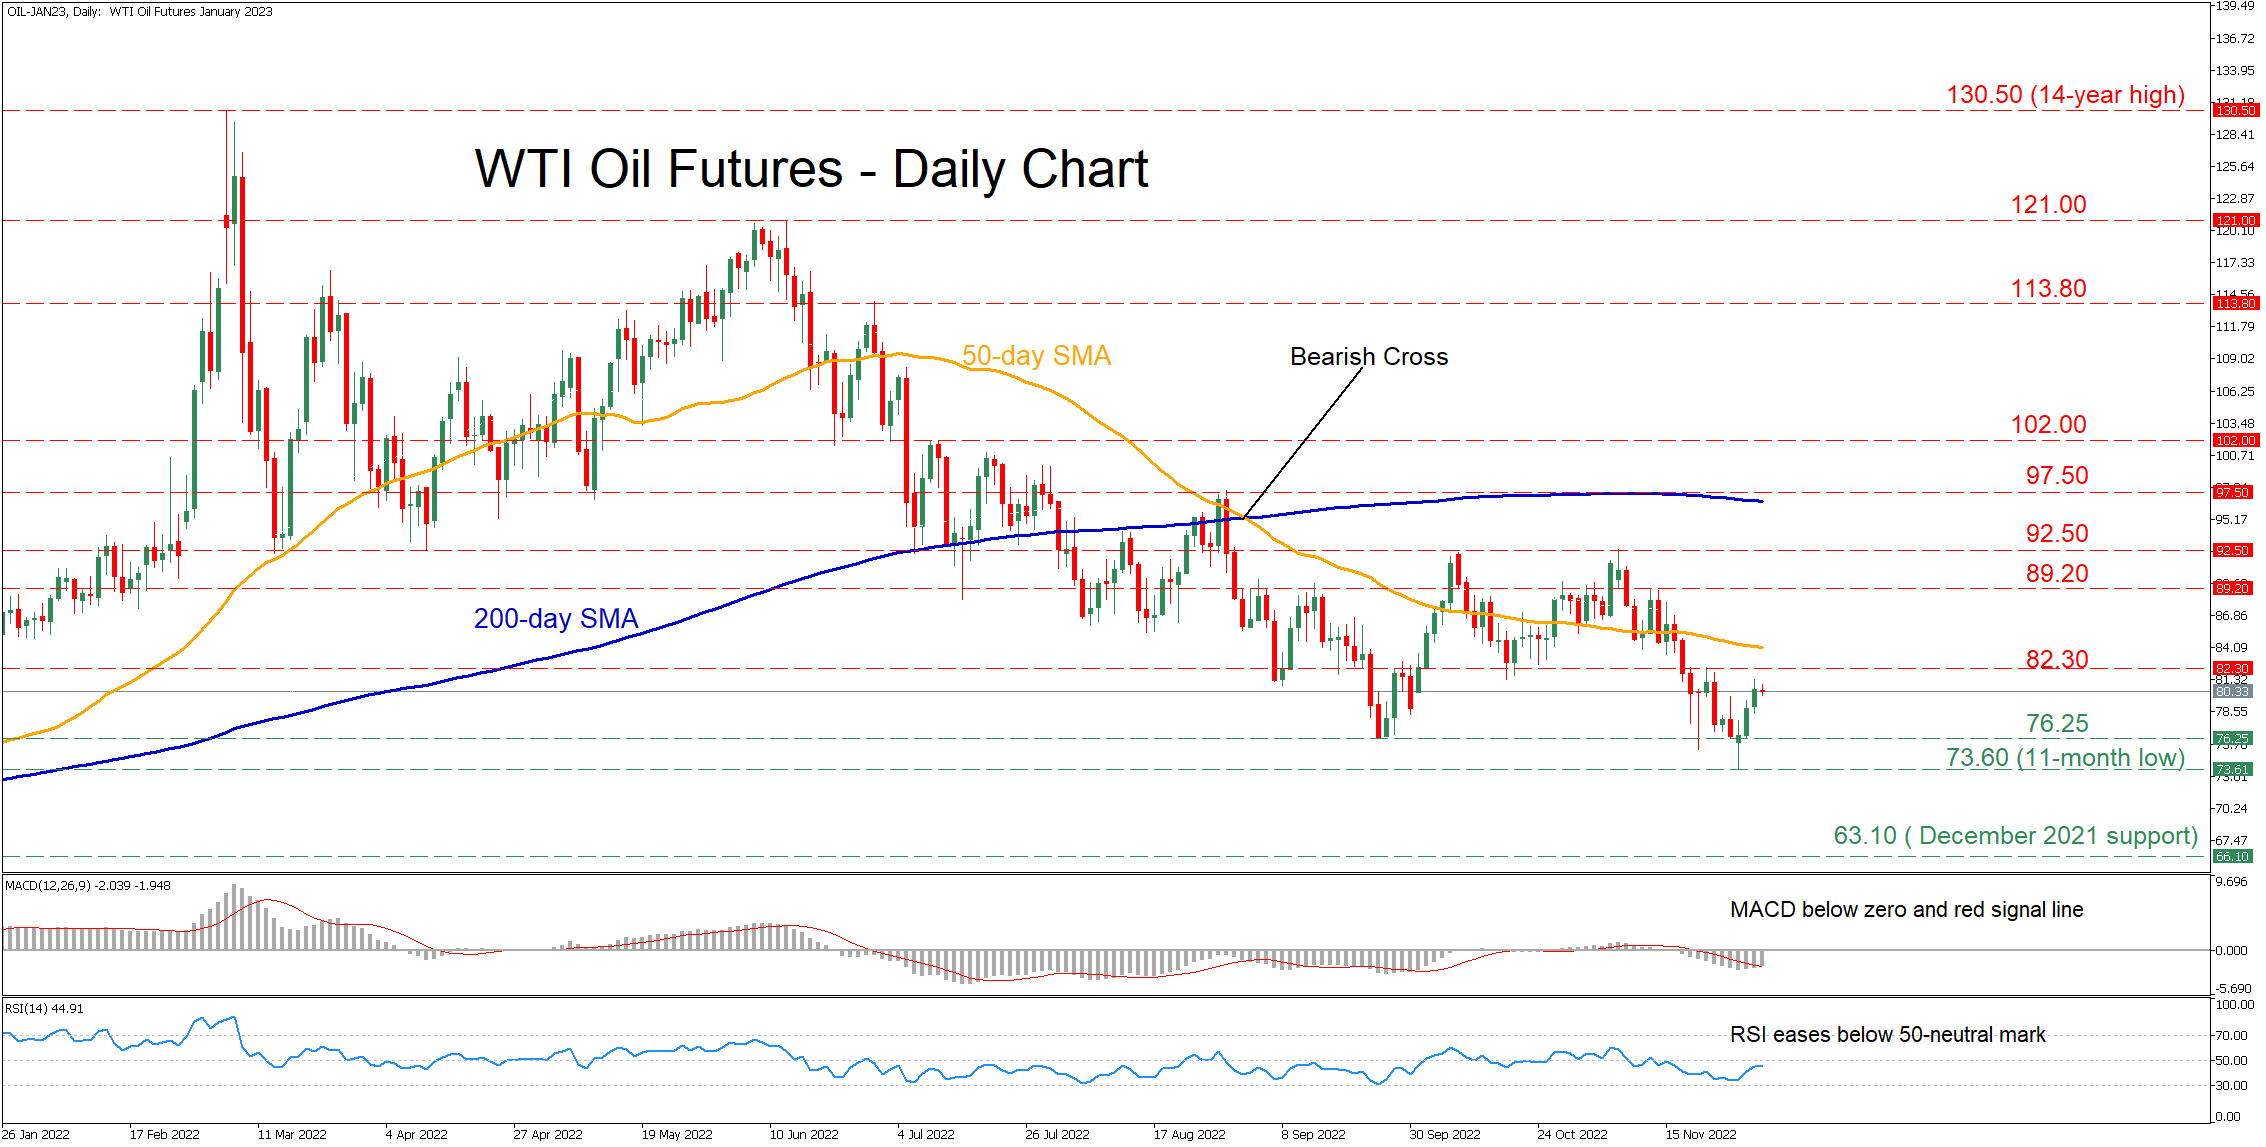
WTI oil futures (January delivery) have been stuck in a downtrend since mid-June when the price failed to surpass the 121.00 mark. Moreover, in the last few daily sessions, the commodity plummeted to a fresh 11-month low before recouping some losses.
The momentum indicators currently suggest that bearish forces remain in control. Specifically, the RSI is hovering beneath its 50-neutral mark, while the MACD histogram is below both zero and its red signal line.
If selling pressures persist, the September low of 76.25 could act as the first line of defense. A violation of the latter may trigger a retreat towards the 11-month low of 73.60. Failing to halt there, the price could decline further and form fresh multi-month lows, where the December 2021 support of 63.10 might curb further declines.
On the flipside, if buyers regain control, oil futures might ascend towards the recent resistance of 82.30. Piercing through this region, the spotlight could turn to 89.20 before the November high of 92.50 comes under examination. Conquering this barricade, the August high of 97.50 may prove to be a tough barrier for the price to overcome.
Overall, even though WTI oil futures appear to be gaining some ground after hitting an 11-month low, near-term risks remain tilted to the downside. Hence, a break above the 92.50 is needed to alter the short-term picture back to positive.
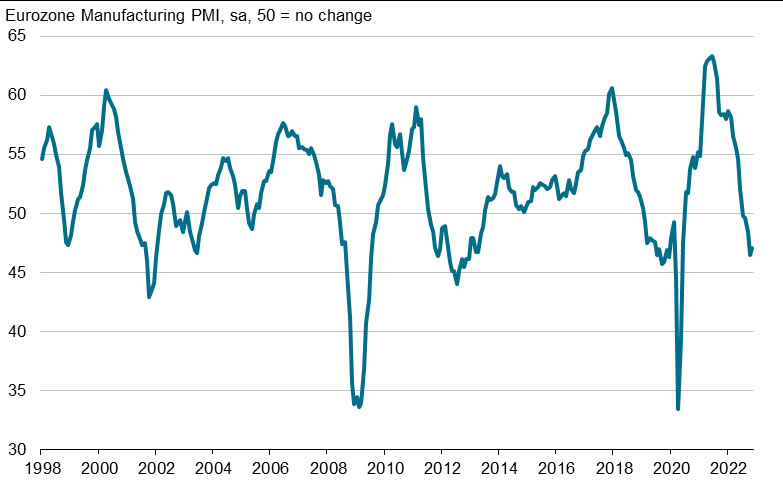
Eurozone PMI manufacturing finalized at 47.1, welcome moderation in downturn intensity
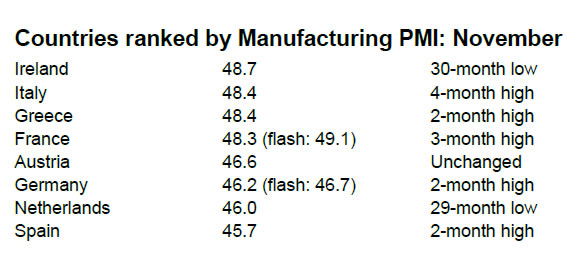
Eurozone PMI Manufacturing was finalized at 47.1in November, up from October's 46.4. Looking at some member countries, Ireland PMI Manufacturing was at 48.7 (30 mth-low), Italy at 48.4, Greece at 48.4, France at 48., Austria at 46.6, Germany at 46.2, the Netherlands at 46.0 (29-mth low), and Spain at 45.7. All were in contraction.
Chris Williamson, Chief Business Economist at S&P Global Market Intelligence said: "The PMI signals some welcome moderation in the intensity of the eurozone manufacturing downturn in November, which will support hopes that the region many not be facing a winter downturn as severe as previously anticipated by many. However, the survey's production index continuing to run at one of the lowest levels recorded over the past decade. At these levels the survey is indicative of a marked annualised rate of contraction of approximately 4%. While official manufacturing data have been more buoyant – and more volatile – in recent months, such weak PMI readings have always been followed by commensurate steep declines in the official statistics."
Flashing Green
We're seeing green flashing across the board on Thursday, with sentiment buoyed by positive signals on Fed rate hikes and China's Covid response.
While it could be argued that Jerome Powell's comments on Wednesday were relatively balanced - slower tightening now but rates high for longer - the last year has proven that anticipating the path of inflation even a short period ahead is incredibly difficult. Knowing what the Fed intends to do next is far more valuable than what it thinks it may do 6-12 months down the line.
And anything that is perceived to reduce to possibility of an interest rate recession is going to be a positive for equity markets. The Fed has every opportunity to tighten more in the months ahead if the data doesn't play ball. What's far more difficult is undoing the damage caused by moving too fast now with little to no visibility on how impactful past tightening has been.
Positive signals
The signals coming from China also look very positive. While we shouldn't expect a dramatic shift in policy from the leadership, particularly before the March Congress, any modest softening in its Covid-zero policy will and should be welcomed. The approach has been extremely damaging to growth and confidence and the protests highlight how public opinion towards it is changing.
We shouldn't be naive to the fact that a move away from the policy won't be easy and there'll be plenty of setbacks. But it's certainly a step in the right direction that, along with the measures announced to revive the property market, could put the economy on a much better path.
A huge few days for oil markets
Oil prices have rebounded strongly over the last few days - up around 10% from the lows - buoyed by the prospect of a lower price cap on Russian crude, another large production cut from OPEC+ this weekend, and China's evolving Covid stance. There remains considerable uncertainty surrounding all of the above though which will likely ensure prices remain volatile going into the weekend. That could carry more risk than normal if the OPEC+ meeting does go ahead as planned on Sunday and the EU hasn't agreed to the price cap level by the close of play Friday. The range of possibilities on these two things alone is huge which will make rumours and speculation over the coming day or two all the more impactful.
Gold testing range highs
Gold bulls were particularly happy with Powell's comments on Wednesday with the yellow metal rallying strongly to trade at the upper end of its recent range. It faces strong resistance around $1,780 though which was a significant level of support in the first half of the year. With so much data to come over the next day or so, it may not prove particularly resilient if traders are given further hope that rates will rise more slowly and peak lower.
Some relief for cryptos
The risk relief rally is coming at just the right time for bitcoin, helping it to recover from the lows to trade around $17,000. This is around the highs of the last few weeks since it settled after its latest plunge. Whether it will be enough to revive interest in the cryptocurrency, I'm not sure. The FTX fallout is continuing to weigh heavily on the space and the prospect of more contagion or scandals is hard to ignore.
GBP/JPY Daily Outlook
Daily Pivots: (S1) 165.54; (P) 166.48; (R1) 167.45; More...
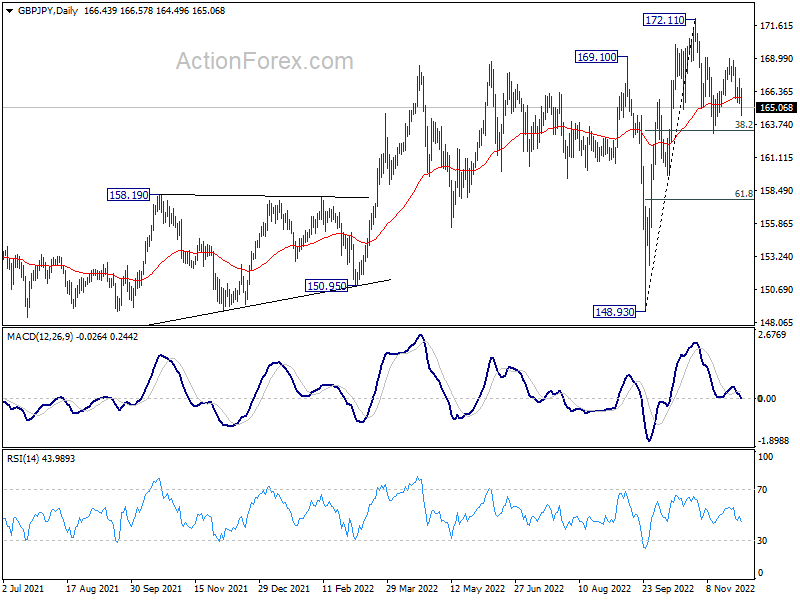
GBP/JPY's fall resumed after brief recovery and intraday bias is back on the downside for 163.02 support. Break there will resume the whole decline from 172.11 and target 159.71 support next. For now, risk will stay on the downside as long as 167.40 minor resistance holds, in case of recovery.
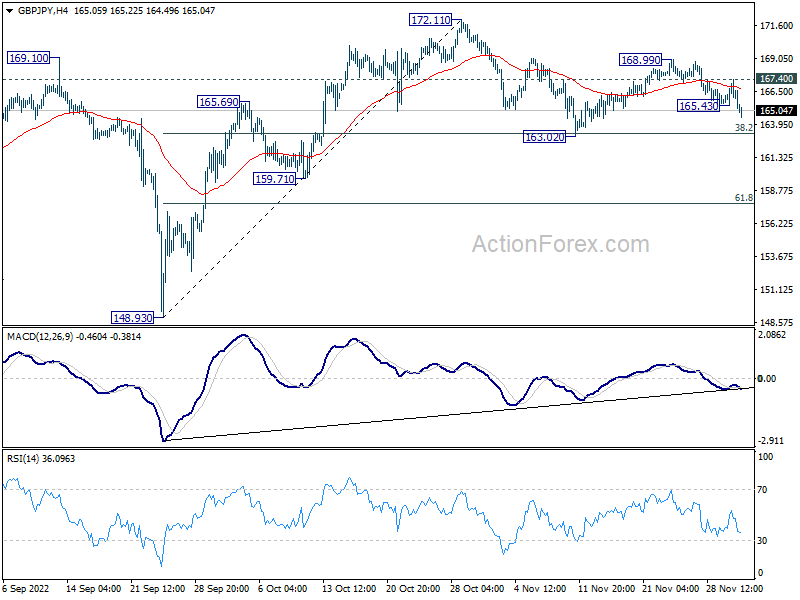
In the bigger picture, there is no clear sign of medium term topping yet. Up trend from 123.94 (2020 low) could still resume through 172.11 high at a later stage. However, firm break of 159.71 support will argue that it's already in correction to the up trend from 123.94, and deeper decline would be seen back towards 148.93 support.
EUR/JPY Daily Outlook
Daily Pivots: (S1) 142.96; (P) 143.91; (R1) 144.64; More....
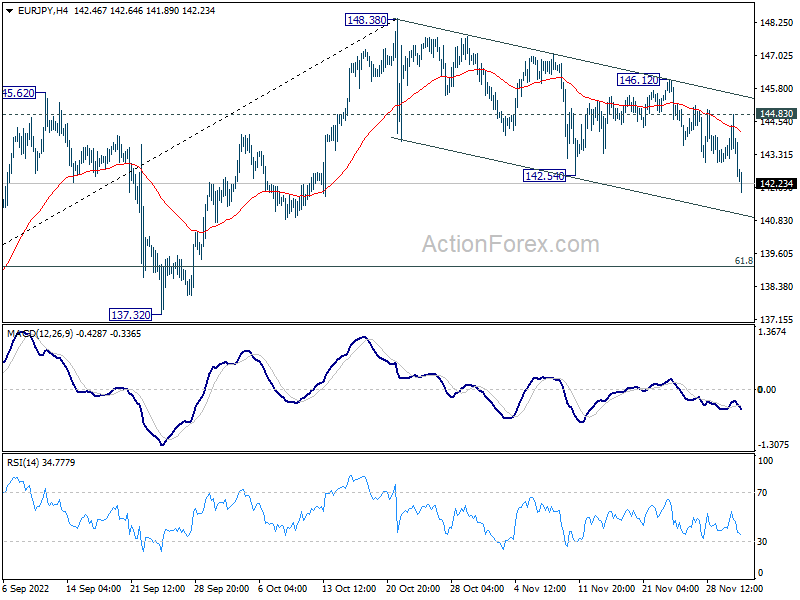
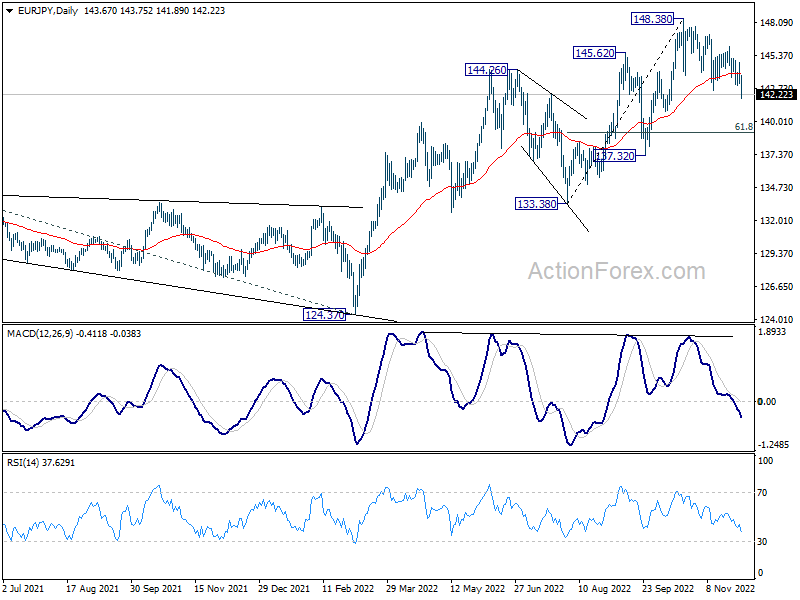
EUR/JPY's choppy decline from 148.48 resumed by breaking through 142.54 support. Intraday bias is back on the downside. Deeper fall would be seen to 61.8% retracement of 133.38 to 148.38 at 139.11. For now, further decline will remain in favor as long as 144.83 resistance holds, in case of recovery.
In the bigger picture, there is no clear sign of medium term topping yet. Up trend from 114.42 (2020 low) could still resume through 148.38 to 149.76 (2014 high). However, break of 137.32 support argue that a medium term correction has already started to correct the whole up trend from 114.42.
EUR/GBP Daily Outlook
Daily Pivots: (S1) 0.8613; (P) 0.8637; (R1) 0.8653; More...
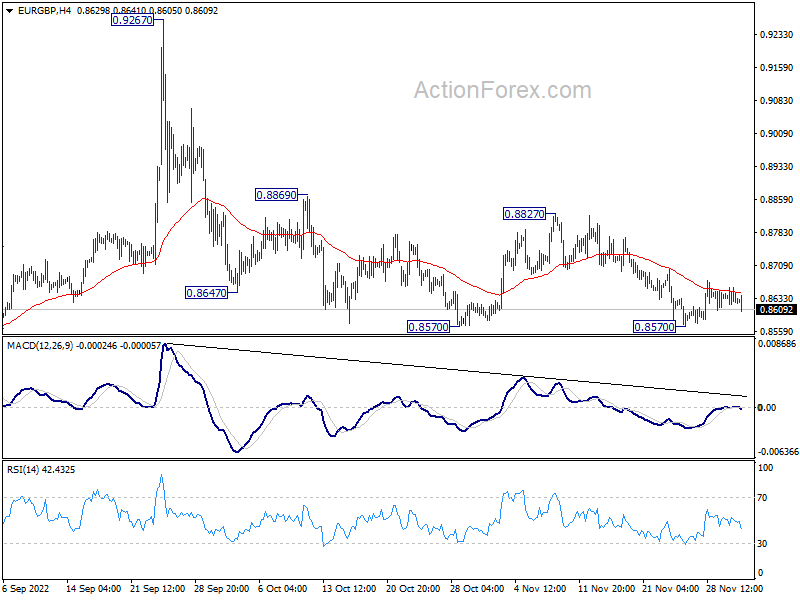
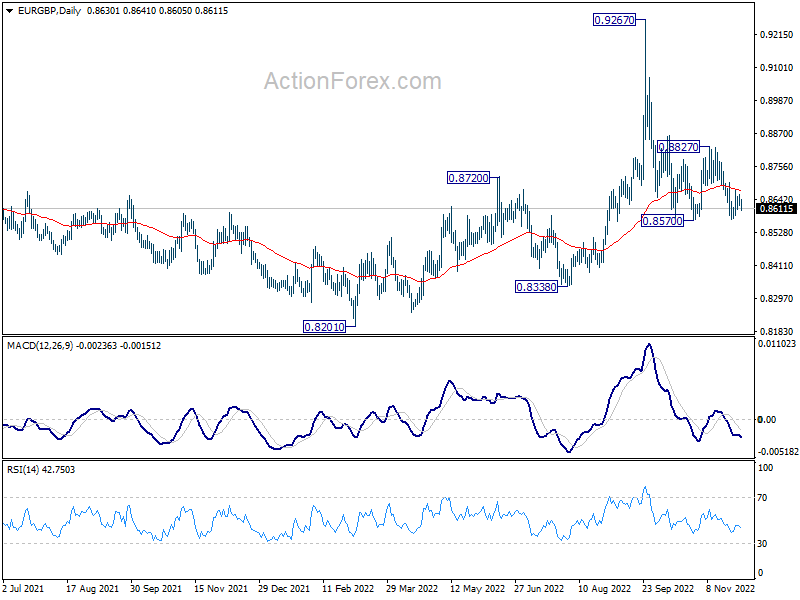
Intraday bias sin EUR/GBP is turned neutral as recovery was rejected by 4 hour 55 EMA. Overall outlook stays bearish with 0.8827 resistance intact. On the downside, break of 0.8570 temporary low will resume the decline from 0.9267, towards 0.8338 support.
In the bigger picture, current development suggests that fall from 0.9267 is a down leg inside long term range pattern. Deeper fall could be seen towards 0.8201/8338 support zone. But strong support should be seen there to bring reversal. Nevertheless, firm break of 0.8827 resistance will turn favor to the case that such decline is merely a correction in the up trend from 0.8201. That is, further rally would be seen at a later stage through 0.9267.
EUR/AUD Daily Outlook
Daily Pivots: (S1) 1.5262; (P) 1.5377; (R1) 1.5446; More...
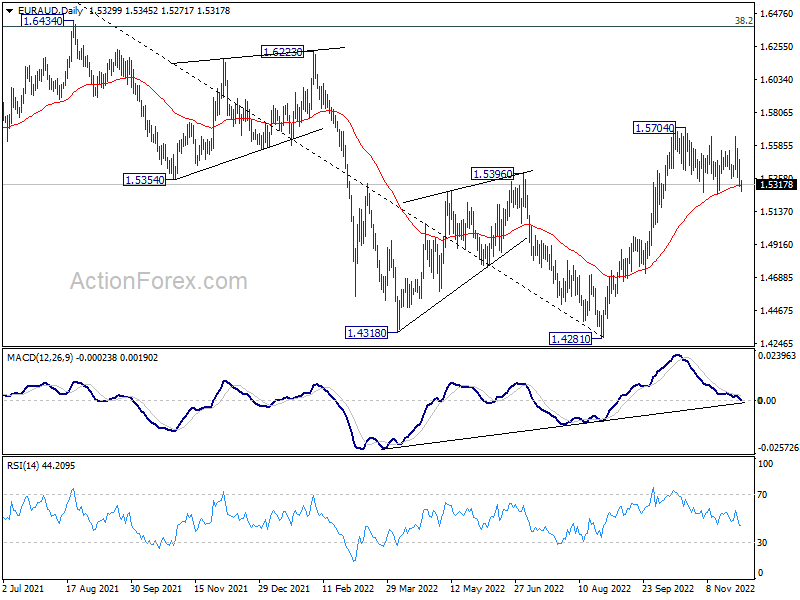
Intraday bias in EUR/AUD stays neutral as consolidation from 1.5704 is still extending. Downside should be contained by 55 day EMA (now at 1.5315) to bring rebound. On the upside, decisive break of 1.5704 resistance will resume whole rally from 1.4281. However, sustained trading below 55 day EMA will bring deeper decline to 1.4965 resistance turned support.
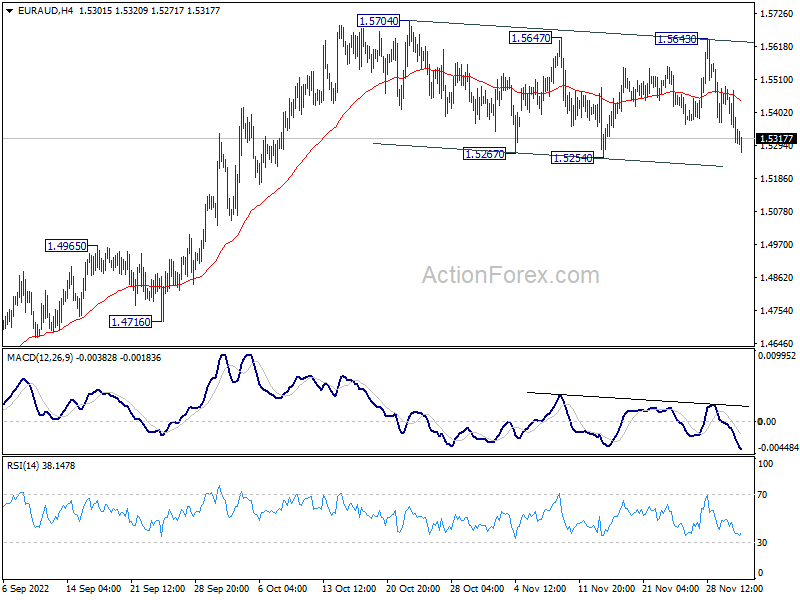
In the bigger picture, a medium term bottom should be in place at 1.4281, on bullish convergence condition in daily MACD. Further rise would be seen back to 1.6434 key resistance next. Break of 1.4965 resistance turned support is needed to indicate reversal. Otherwise, further rally will remain in favor.