Sample Category Title
The World Needs Soft Jobs Data from the US
Investors got the policy pivot they were looking for this week; unfortunately, not from the Federal Reserve (Fed), but from the Bank of England (BoE) instead.
In an extended market reaction to Wednesday’s Fed decision, the US dollar gained across the board, as investors repositioned for a more aggressive Fed tightening.
The Fed will not stop until it pushes rates above 5%, at least. I say at least, because it will depend on how fast the rate hikes translate into lower inflation, and lower jobs.
Released Wednesday, the ADP report exceeded analysts’ expectations with 239’000 new private job additions last month.
Due today, the NFP is expected to reveal 200’000 new nonfarm jobs in October, for an average hourly pay rise steady around 0.3%.
A stronger than expected jobs, or wages data could only further boost the Fed hawks, whereas today’s jobs figures should be particularly soft to throw cold water on very hot hawkish Fed expectations before the weekly closing bell.
The S&P500 lost another 1% yesterday, and more than 5% since the peak of this week. The latest bear market rally is now leaving its place to another dive, and we could see the index sink toward 3400 in the continuation of an ABCD pattern building since March this year.
Nasdaq dived another 2% and is poised to extend gains toward the 10200 level in the continuation of the latest selloff wave.
Only ugly US data could relieve others’ pain
Unfortunately, the only thing that could reverse the morose investor sentiment would be dramatically ugly jobs, and economic data from the US.
That’s also the only thing that could save the rest of the world from the worsening Fed aggression: rapidly deteriorating economic conditions in the US.
As long as the US economy remains resilient, the Fed will continue exporting its pain, and inflation to the rest of the world through a too-strong US dollar.
So, Americans would excuse the rest of the world for praying to see ugly jobs figures from the US, today.
What is BoE trying to do?
The Bank of England (BoE) raised its interest rate by 75bp yesterday, but announced that the city analysts have got the BoE’s terminal rate wrong, and that the future rate hikes from the BoE will be softer, given that the economic situation is alarming.
So why to hike by 75bp in the first place?
To avoid sterling from crumbling?
But sterling dived anyway, and will dive deeper. Cable, which began the week above the 1.16 mark dived all the way down to 1.1150 after the BoE statement, and the divergence between the Fed – looking for smaller rate hikes but toward a higher end rate, and the BoE, which threw a useless 75bp hike, and doesn’t want to get more aggressive than this, will likely weigh on the pound-dollar in the medium run. We could again see the pair testing parity in the coming weeks.
Good news, however, is, the short end of the British gilt curve eased on expectation of a lower end rate from the BoE. The 2-year yield tipped a toe below 3% yesterday, the 10-year yield remained below the 3.5% level. What BoE is trying to do is to get some pressure off the mortgage rates, and the housing market, even if it means higher inflation than otherwise, for longer.
It looks like the BoE also relies on a reasonably restrictive fiscal budget from the new Sunak government.
US Jobs Market in Focus
Market movers today
Today, markets will zoom in on the US jobs report. We expect another strong reading of 220k.
In Germany, we will get industrial orders for September, which will likely continue to indicate a slowing manufacturing sector.
The 60 second overview
Bank of England: The Bank of England hiked the bank rate by 75bp to 3.0% as expected on Thursday. We expect smaller hikes going forward and keep the peak rate at 3.75%, which we believe will be reached in February. Our view is for less hikes than the market is currently pricing in as we expect GDP data next week to confirm that the economy has already entered recession. That being said, risks remain skewed towards additional hikes.
Norges Bank: Norges Bank also announced a 25bp hike yesterday, sending the sight deposit rate to 2.50%. While our call was for a 25bp hike, analysts and markets (37bp priced) were evenly split between 25bp and 50bp. This led to considerable market moves in rates and FX markets post announcement.
EU-China: German Chancellor Olaf Scholz is the first G7 leader in three years to pay a visit to meet Chinese leader Xi Jinping in China. The visit comes as geopolitical tensions mount, as the US continues to distance itself from China and as the EU seeks to adjust their ties. After the meeting, Xi said that large nations of influence such as China and Germany should all the more work together in 'times of change and turmoil'. China is seeking to reassure the business delegation that travels with Scholz that despite the country's tight Covid policy, they remain open for trade and investments. Scholz, on the other hand, will have to balance between weakening reliance, diversifying supply chains and enhancing security while still fostering business relations. Scholz' visit has also received criticism in the homeland, particularly after shipping giant Cosco received green light from Berlin last week to obtain a stake in a Hamburg port terminal despite opposition from coalition partners.
Equities: Equities came under pressure yesterday, again driven by higher yields, fear of central bank tightness. Hence, no surprise to see cyclical growth underperforming led by tech and communication services. These sectors normally lead the positive earnings surprises but not this time around as they are coming out among the weakest sectors. The combination of weaker growth outlook, tighter monetary policy and weak earnings reports is really challenging for this group of equities. In US yesterday, Dow -0.5%, S&P 500 -1.1%, Nasdaq -1.7% and Russell 2000 -0.5%. In Asia, China stocks going ballistic this morning with Hang Seng up 7%. The rally purely based on speculation that authorities forming a committee to explore an exit from zero-Covid policy. Rest of the Asian markets are more mixed with Japan almost 2% lower. US and European futures are higher this morning.
FI: The rise in yields continued yesterday after the hawkish comments from Federal Reserve Chairman Powell late Wednesday. The rise comes on the back of expectations of more rate hikes although at a slower pace given the high inflation data as well as the solid labour market. Hence, today's US nonfarm payrolls will be very important for this view.
FX: BoE and NB hiked interest rates yesterday, but GBP and NOK weakened as both central banks came across as less hawkish than expected by the market. EUR/USD dropped below 0.98 yesterday as US interest rates rose in the aftermath of Wednesday's FOMC meeting.
Credit: Wednesday night's hawkish Fed meeting sent EUR CDS indices wider yesterday and iTraxx Main closed at 113bp (+2bp) while Crossover was 8bp wider at 551bp. Meanwhile, euro FIG and corporate issuance came almost to a halt with the only deal coming to the market being a covered bond.
USD/CAD Daily Outlook
Daily Pivots: (S1) 1.3683; (P) 1.3746; (R1) 1.3808; More....
Intraday bias in USD/CAD remains neutral for the moment. Further rise in favor as long as 1.3501 support holds. On the upside, decisive break of 1.3976 will resume larger up trend and target 200% projection of 1.2005 to 1.2947 from 1.2401 at 1.4285. However, sustained trading below 1.3494 support will complete a head and shoulder top pattern (ls: 1.3832; h: 1.3976; rs: 1.3807). Outlook will be turned bearish for deeper fall to 1.3207 resistance turned support.
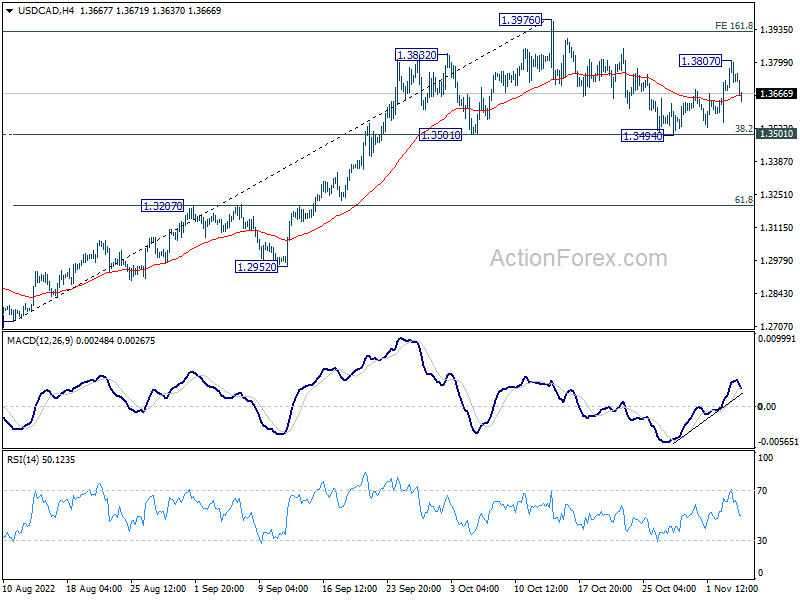
In the bigger picture, up trend from 1.2005 (2021 low) is still in progress. Based on current impulsive momentum, it could be resuming long term up trend from 0.9056 (2007 low). Whether it is or it isn't, retest of 1.4689 (2016 high) should be seen next. This will now remain the favored case as long as 1.3222 resistance turned support holds.
AUD/USD Daily Report
Daily Pivots: (S1) 0.6251; (P) 0.6311; (R1) 0.6351; More...
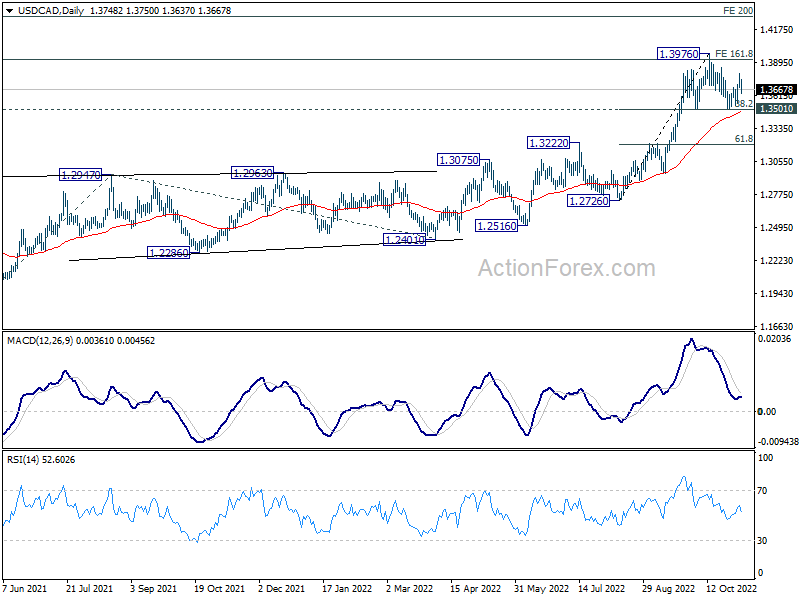
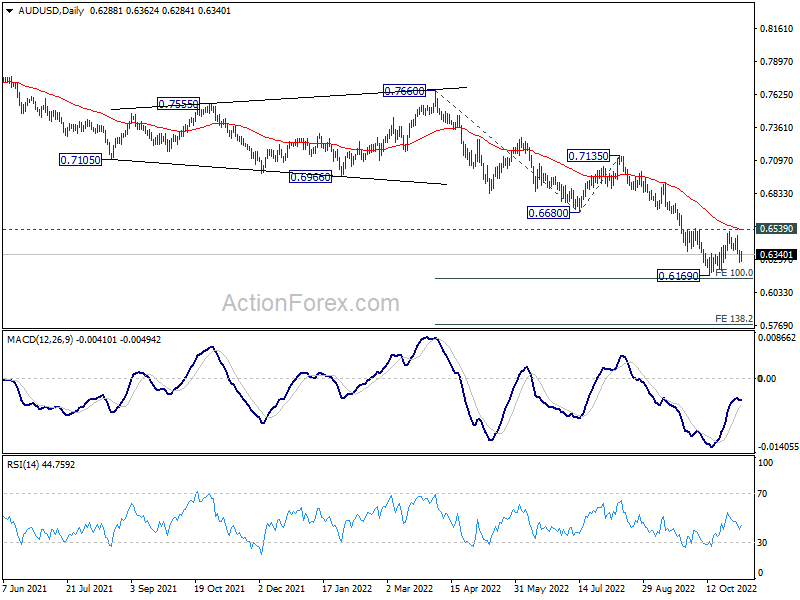
Intraday bias in AUD/USD stays mildly on the downside for retesting 0.6169. Firm break there will resume larger down trend to 138.2% projection of 0.7660 to 0.6680 from 0.7135 at 0.5781.For now, risk will stay on the downside as long as 0.6539 resistance holds, in case of recovery.
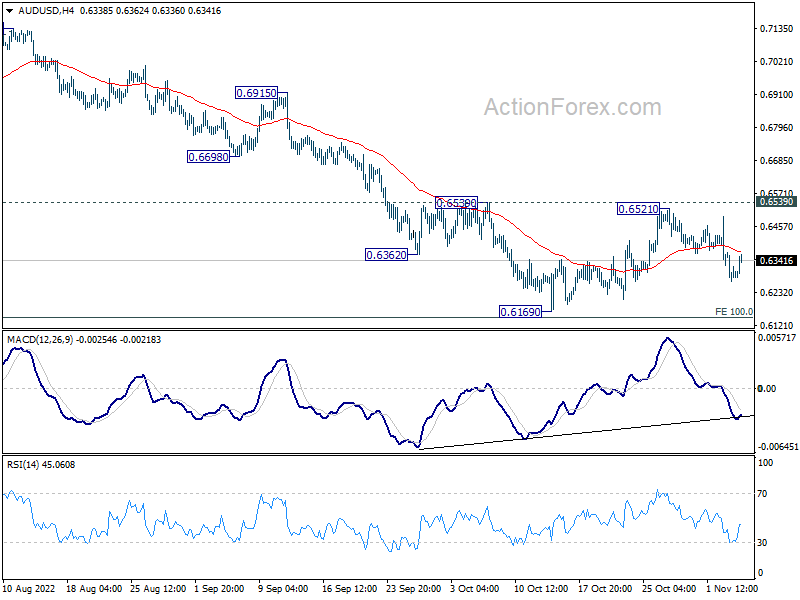
In the bigger picture, down trend form 0.8006 (2021 high) is expected to continue as long as 0.6680 support turned resistance holds. Medium term momentum remains strong and retest of 0.5506 (2020 low) cannot be ruled out. But firm break of 0.6680 will be the first sign of reversal, and bring stronger rebound back to 0.7135 resistance.
EUR/USD Daily Outlook
Daily Pivots: (S1) 0.9707; (P) 0.9773; (R1) 0.9817; More...
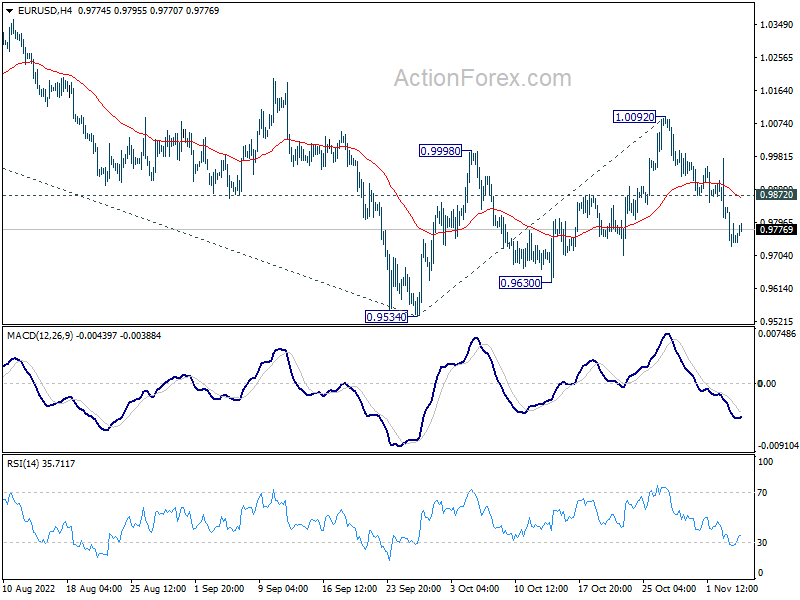
Intraday bias in EUR/USD stays on the downside for the moment. Corrective pattern from 0.9534 should have completed with three waves up to 1.0092. Deeper decline would be seen to 0.9534/9630 support zone. On the upside, above 0.9872 minor resistance will turn intraday bias neutral again first.
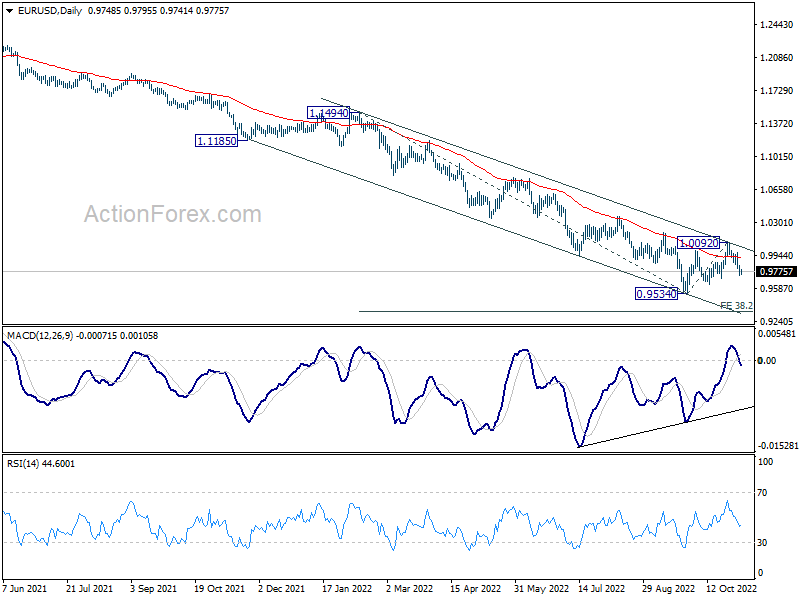
In the bigger picture, medium term term bearishness is retained with failure to sustain above 55 day EMA (now at 0.9930). That is, larger down trend from 1.2348 (2021 high) is still in progress. Firm break of 0.9534 low will confirm this bearish case. For now, risk will stay on the downside as long as 1.0092 resistance holds, in case of recovery.
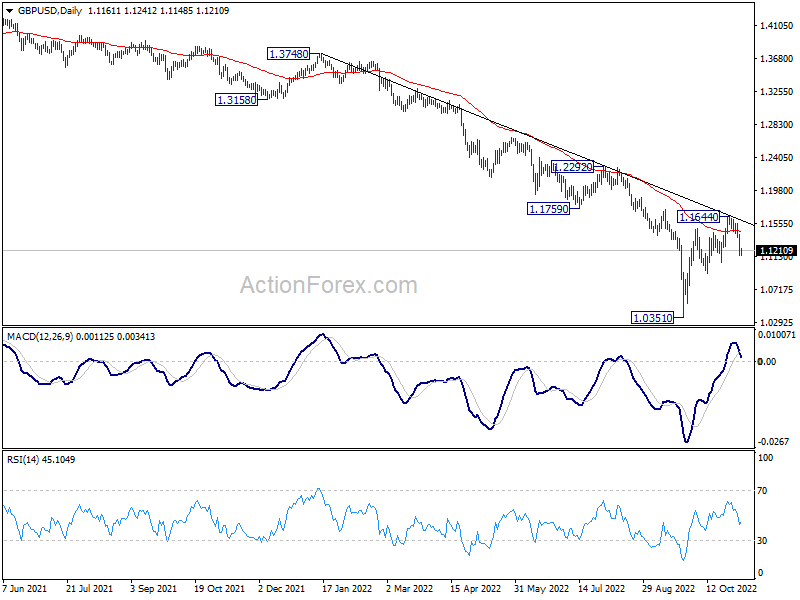
GBP/USD Daily Outlook
Daily Pivots: (S1) 1.1065; (P) 1.1243; (R1) 1.1335; More...
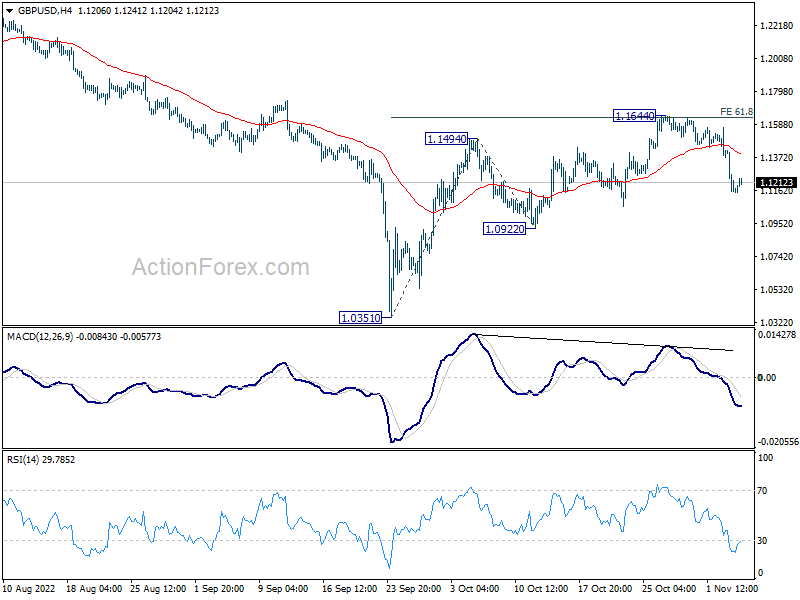
Intraday bias in GBP/USD remains on the downside for the moment. Corrective rebound should have completed with three waves up to 1.1644. Deeper fall would be seen to 1.0922 support first. Break there will target a retest on 1.0351 low. For now, risk will stay on the downside as long as 1.1644 resistance holds, in case of recovery.
In the bigger picture, fall from 1.4248 (2018 high) is part of the long term down trend from 2.1161 (2007 high). Outlook will stay bearish as long as 1.1759 support turned resistance holds. Parity would be the next target on resumption. Nevertheless, firm break of 1.1759 will confirm medium term bottoming, and open up stronger rise back to 55 week EMA (now at 1.2392).
USD/JPY Daily Outlook
Daily Pivots: (S1) 147.44; (P) 147.94; (R1) 148.78; More...
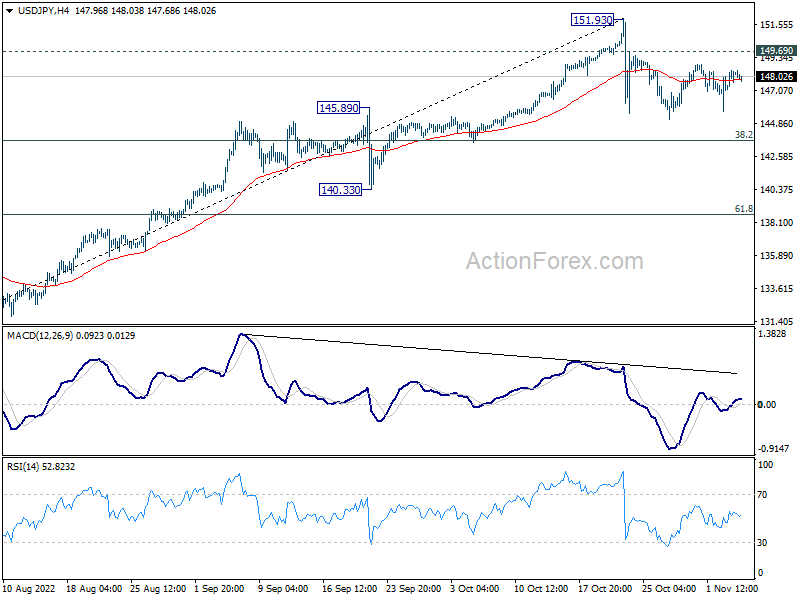
Intraday bias in USD/JPY remains neutral and outlook is unchanged. Consolidation from 151.93 is extending. Deeper decline cannot be ruled out, but downside should be contained by 38.2% retracement of 130.38 to 151.93 at 143.69 to bring rebound. On the upside, above 149.69 minor resistance will bring stronger rebound back towards 151.93 high. But upside should be limited there to continue the corrective pattern.
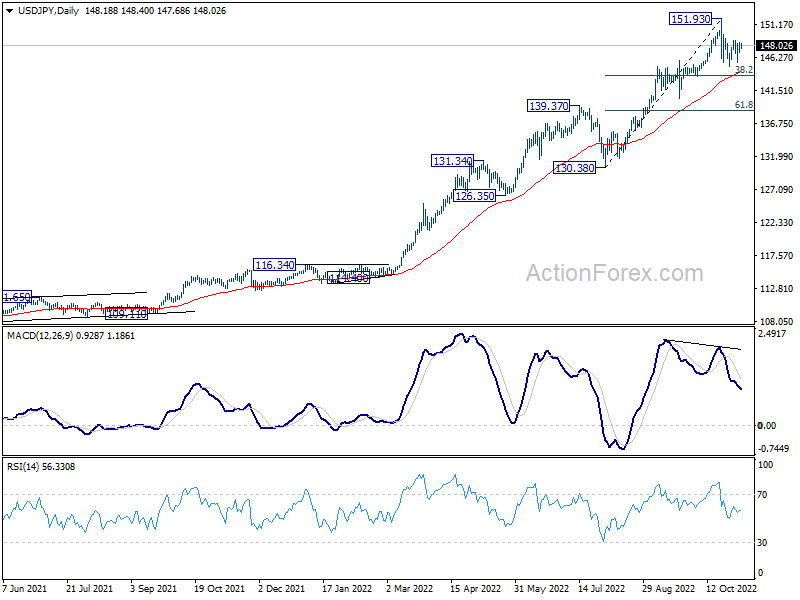
In the bigger picture, up trend from 101.18 is still in progress, as part of the whole up trend from 75.56 (2011 low). 147.68 (1998 high) was already met and there is no clearly sign of topping yet. In any case, break of 140.33 support is needed to be the first sign of medium term topping. Otherwise, further rise is in favor to next target at 160.16 (1990 high).
BTCUSD: The Bottom is Near
Since November 2021, Bitcoin (BTCUSD) has been experiencing a strong downtrend losing over 70% from its all-time high. Although, sellers may not have capitulated yet, current trends are "typical" for the end of bear markets. According to the data from the on-chain analytics firm Glassnode, seller behavior suggests that a macro price bottom is forming.
Analyst: seller exhaustion "near" bear market lows
In the latest hint that Bitcoin's bear market is nearing its end, Glassnode has revealed that the network is currently weathering a "perfect storm" of low volatility and high on-chain losses.
The Seller Exhaustion Constant is calculated as the percentage of Bitcoin's total circulating supply in profit multiplied by its volatility over the last 30 days. According to the historical data, such lows are rare, having appeared seven times before. Six of those times, upside volatility led to the end of Bitcoin's bearish trend.
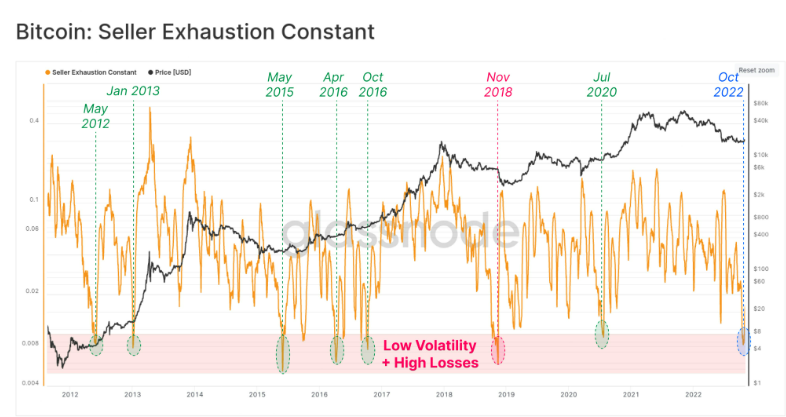
Bitcoin Seller Exhaustion Constant chart. Source: Glassnode
Fed monetary policy might be the problem
The Federal Reserve approved a fourth-straight rate hike of 75 basis points on November 2 as part of its aggressive battle to bring down the inflation plaguing the US economy. The hike brings the central bank's benchmark lending rate to a new target range of 3.75% to 4%, making it the highest rate since January 2008.
In a news conference following the meeting, Fed Chairman Jerome Powell highlighted the rising probability of an upcoming recession and acknowledged that the path to a soft landing had narrowed. Moreover, he added that the Federal Reserve had raised its target rate because "there are no signs of the inflation decrease."
The Fed may remain hawkish, and this is not surprising. Powell noted several times that macroeconomic indicators have yet to stabilize. The labor market is overheated, as well as the housing market, despite falling demand.
As a result, the US dollar has skyrocketed after the conference pressing risk assets, with US100 (NASDAQ) losing 3.7% and Bitcoin down 1.6%.
If the Fed remains committed to its hawkish monetary policy, demand for risky assets, including Bitcoin, will decline, putting pressure on the price.
CPI data will decide everything
Currently, markets are undecided in their expectations regarding the Fed's next move. According to analysts' expectations, there is a 52% chance for a 50-basis-point rate hike versus a 48% chance for a 75-basis-point increase.
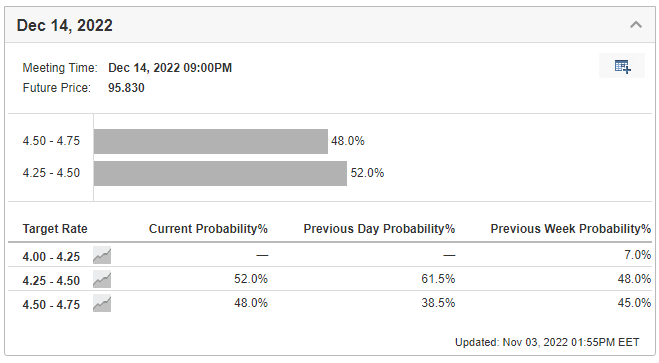
On November 10, the Bureau of Labor Statistics will publish the October inflation data, which will most likely decide the next Fed’s move. If the actual data overperforms or meets the expectations of a 0.4% m/m inflation increase, the Fed will most likely take more hawkish steps at the December meeting. That, in turn, would be negative for Bitcoin.
On the other hand, if the inflation growth decreases, the Federal Reserve will likely slow down the pace of the key rate hikes and BTC may turn up.
Technical analysis
US dollar index, daily chart
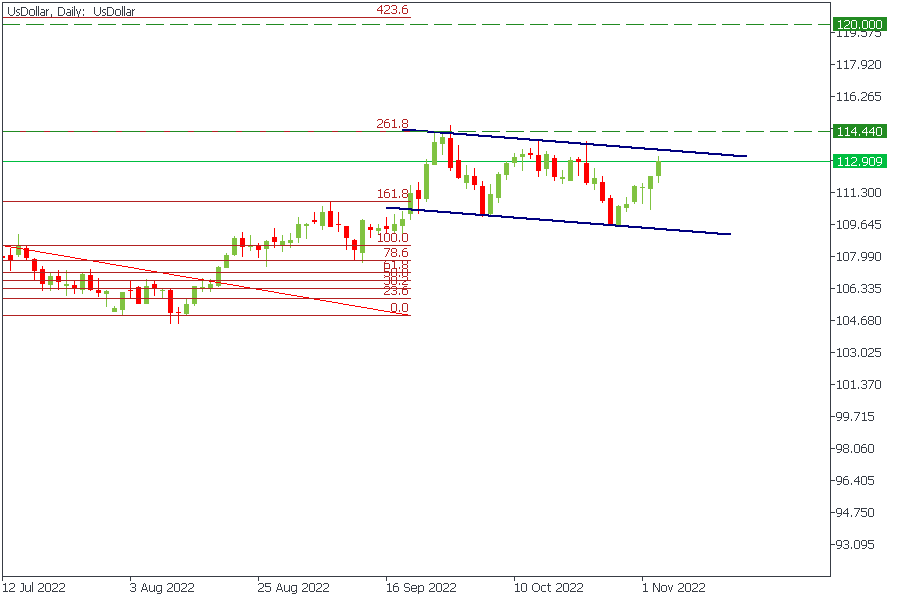
The US dollar index has formed a bullish flag on the daily chart. If the price breaks the resistance trend line, the index will most likely reach 120.00 in the near-term pressing risk assets, including the crypto market.
BTCUSD, daily chart
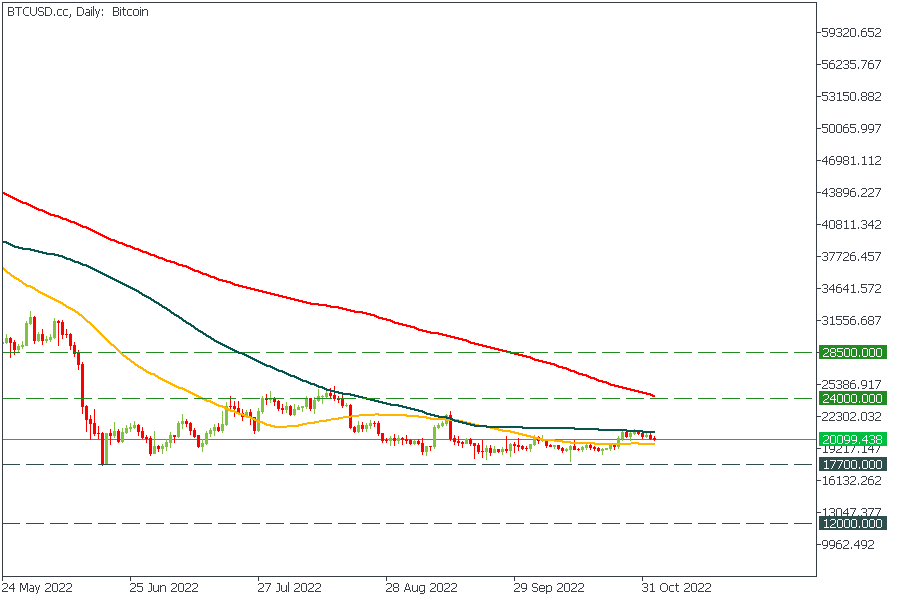
Bitcoin price is squeezed between the 50- and 100-day Moving Average. Investors should wait for the breakout and follow the trend.
If the price breaks above the 100-day MA, it will most likely reach $24 000.00. On the other hand, if the price loses 50-day MA, it will drop to $17 700.00.
Moreover, a Bitcoin breakout above $24000 will open the way to $28500 for the buyers. At the same time, a breakout below $17 700 would mean a further BTCUSD decline toward $12 000 support.
Technical Outlook and Review
USD/JPY:
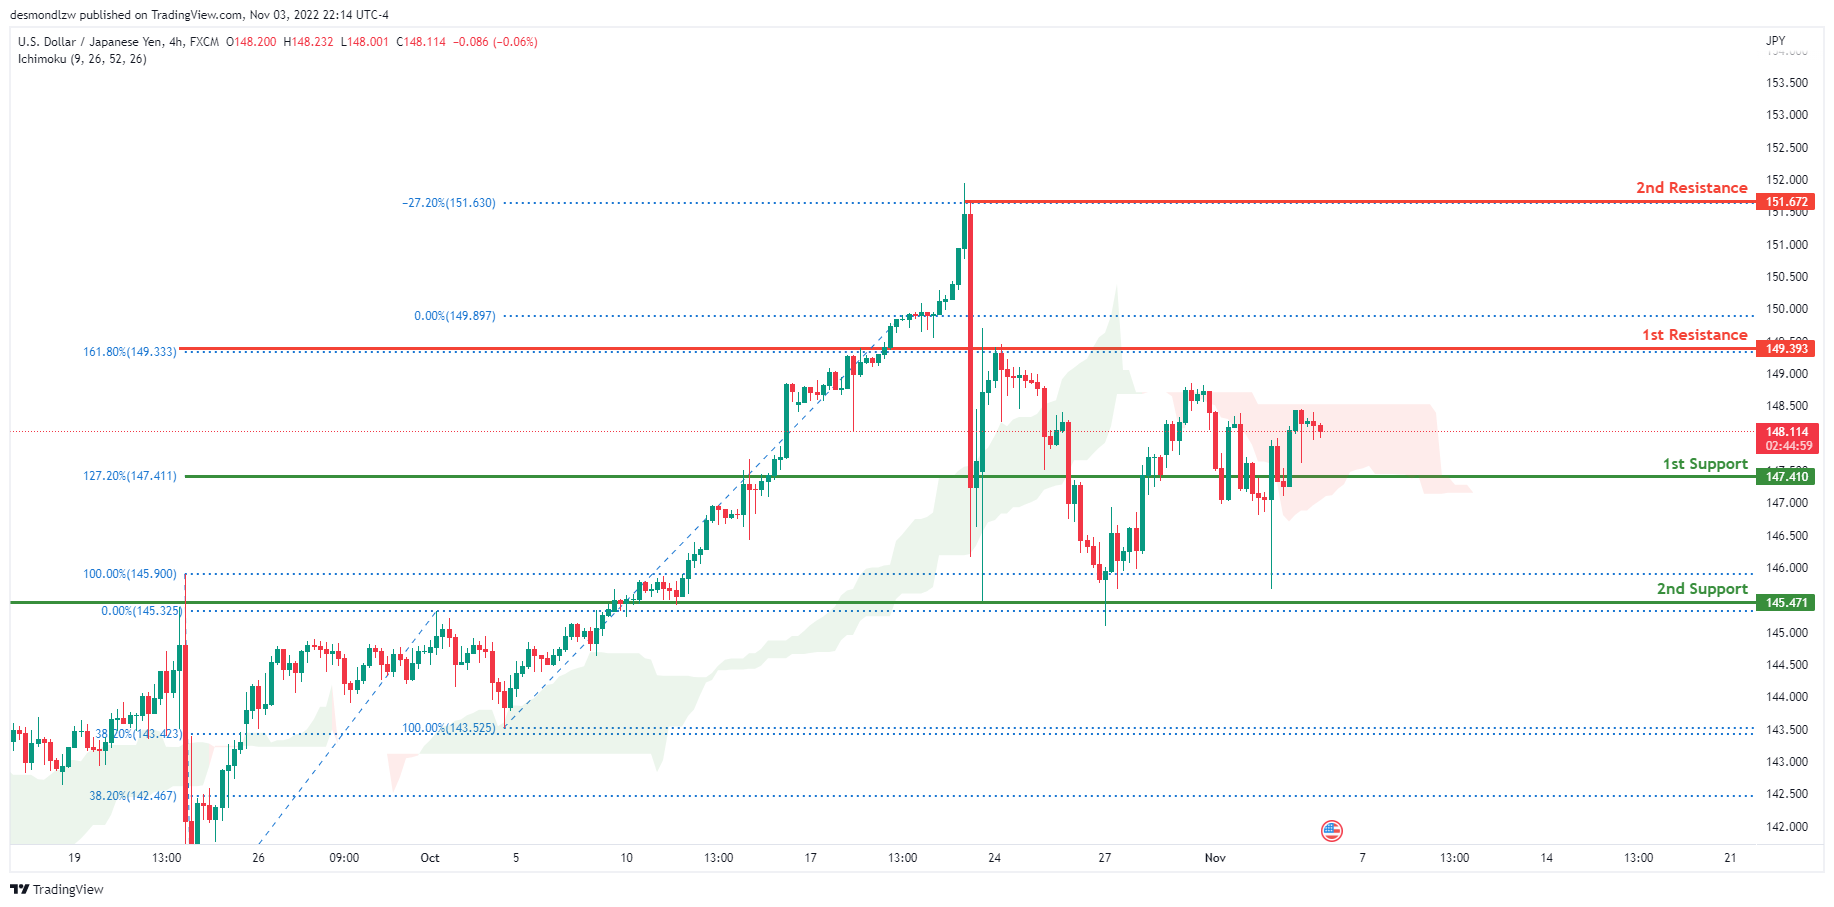
The current general bias for USDJPY on the H4 chart is bearish. Overnight, USDJPY experienced some bullish momentum with the price closing above the 1st support line at 147.410 where the 127.2% Fibonacci extension line is located. Price is currently trading at 148.117 at time of writing. If the overnight’s bullish momentum continues, expect USDJPY to possibly head towards the 1st resistance at 149.393 where the 161.8% and 0% Fibonacci lines are located.
Areas of consideration:
- H4 time frame, 1st resistance at 149.393
- H4 time frame, 1st support at 147.410
DXY:
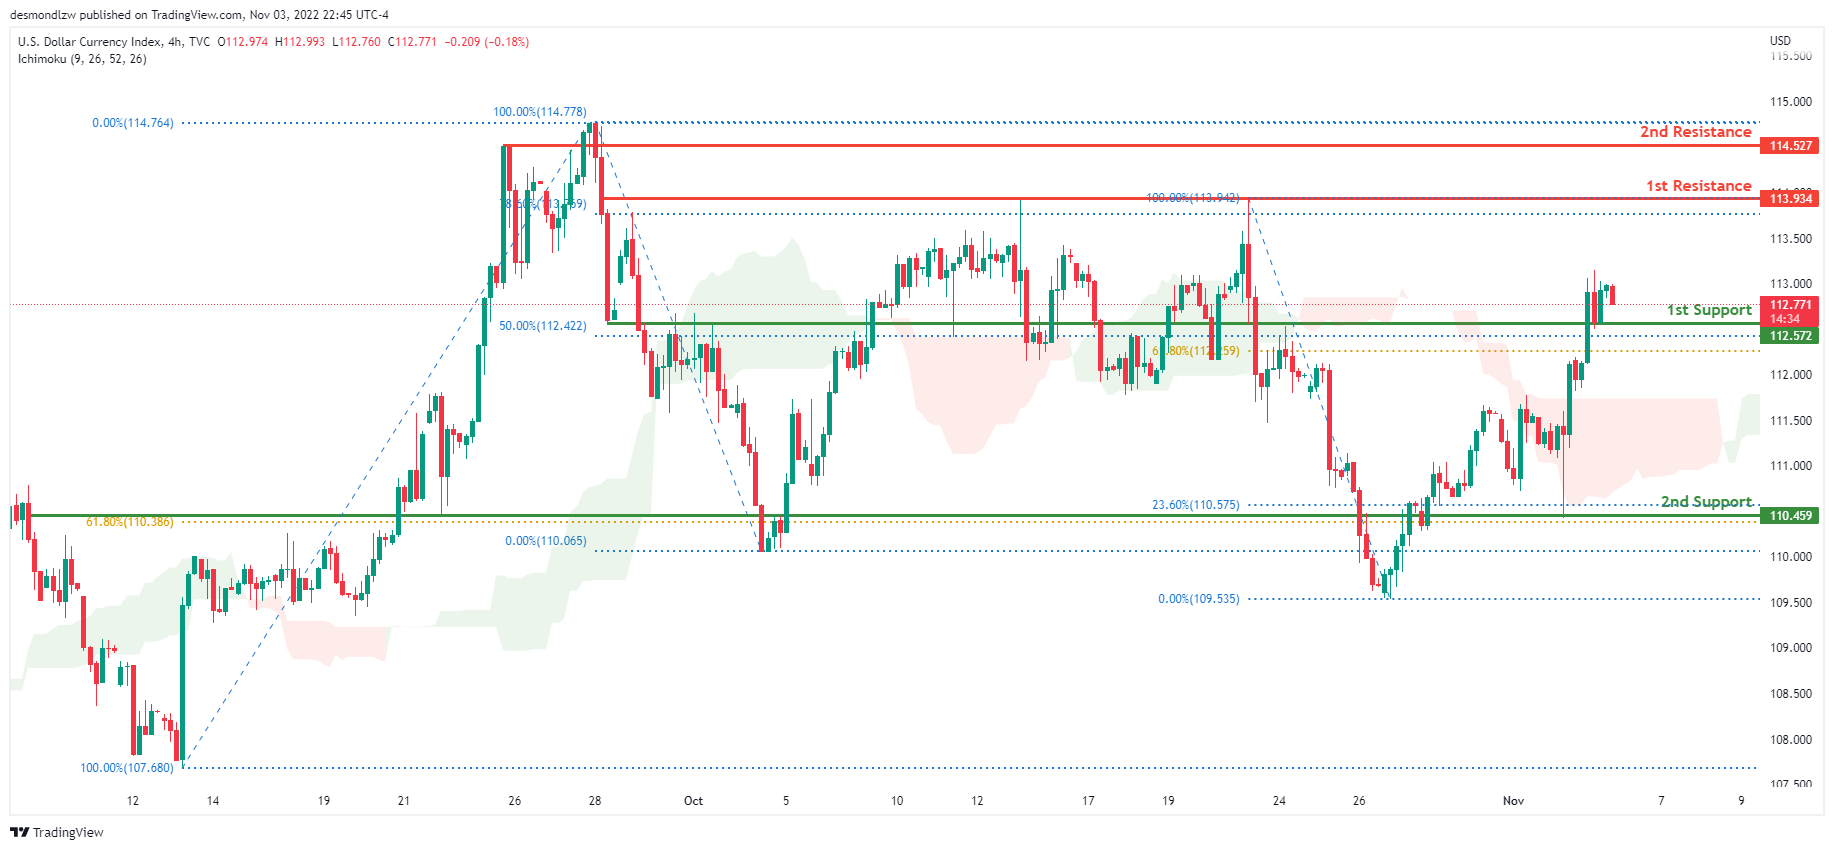
On the H4 chart, the overall bias for DXY is bullish. To add confluence to this, the price is above the Ichimoku cloud which indicates a bullish market. Overnight, price continued to have bullish momentum and price closed above the 1st support level at 112.572 where the 50% Fibonacci line is located. If this bullish momentum continues, expect price to possibly head towards the 1st resistance at 113.934 at where the 78.6% and 100% Fibonacci lines are located.
Areas of consideration:
- H4 time frame, 1st resistance at 113.934
- H4 time frame, 1st support at 112.572
EUR/USD:
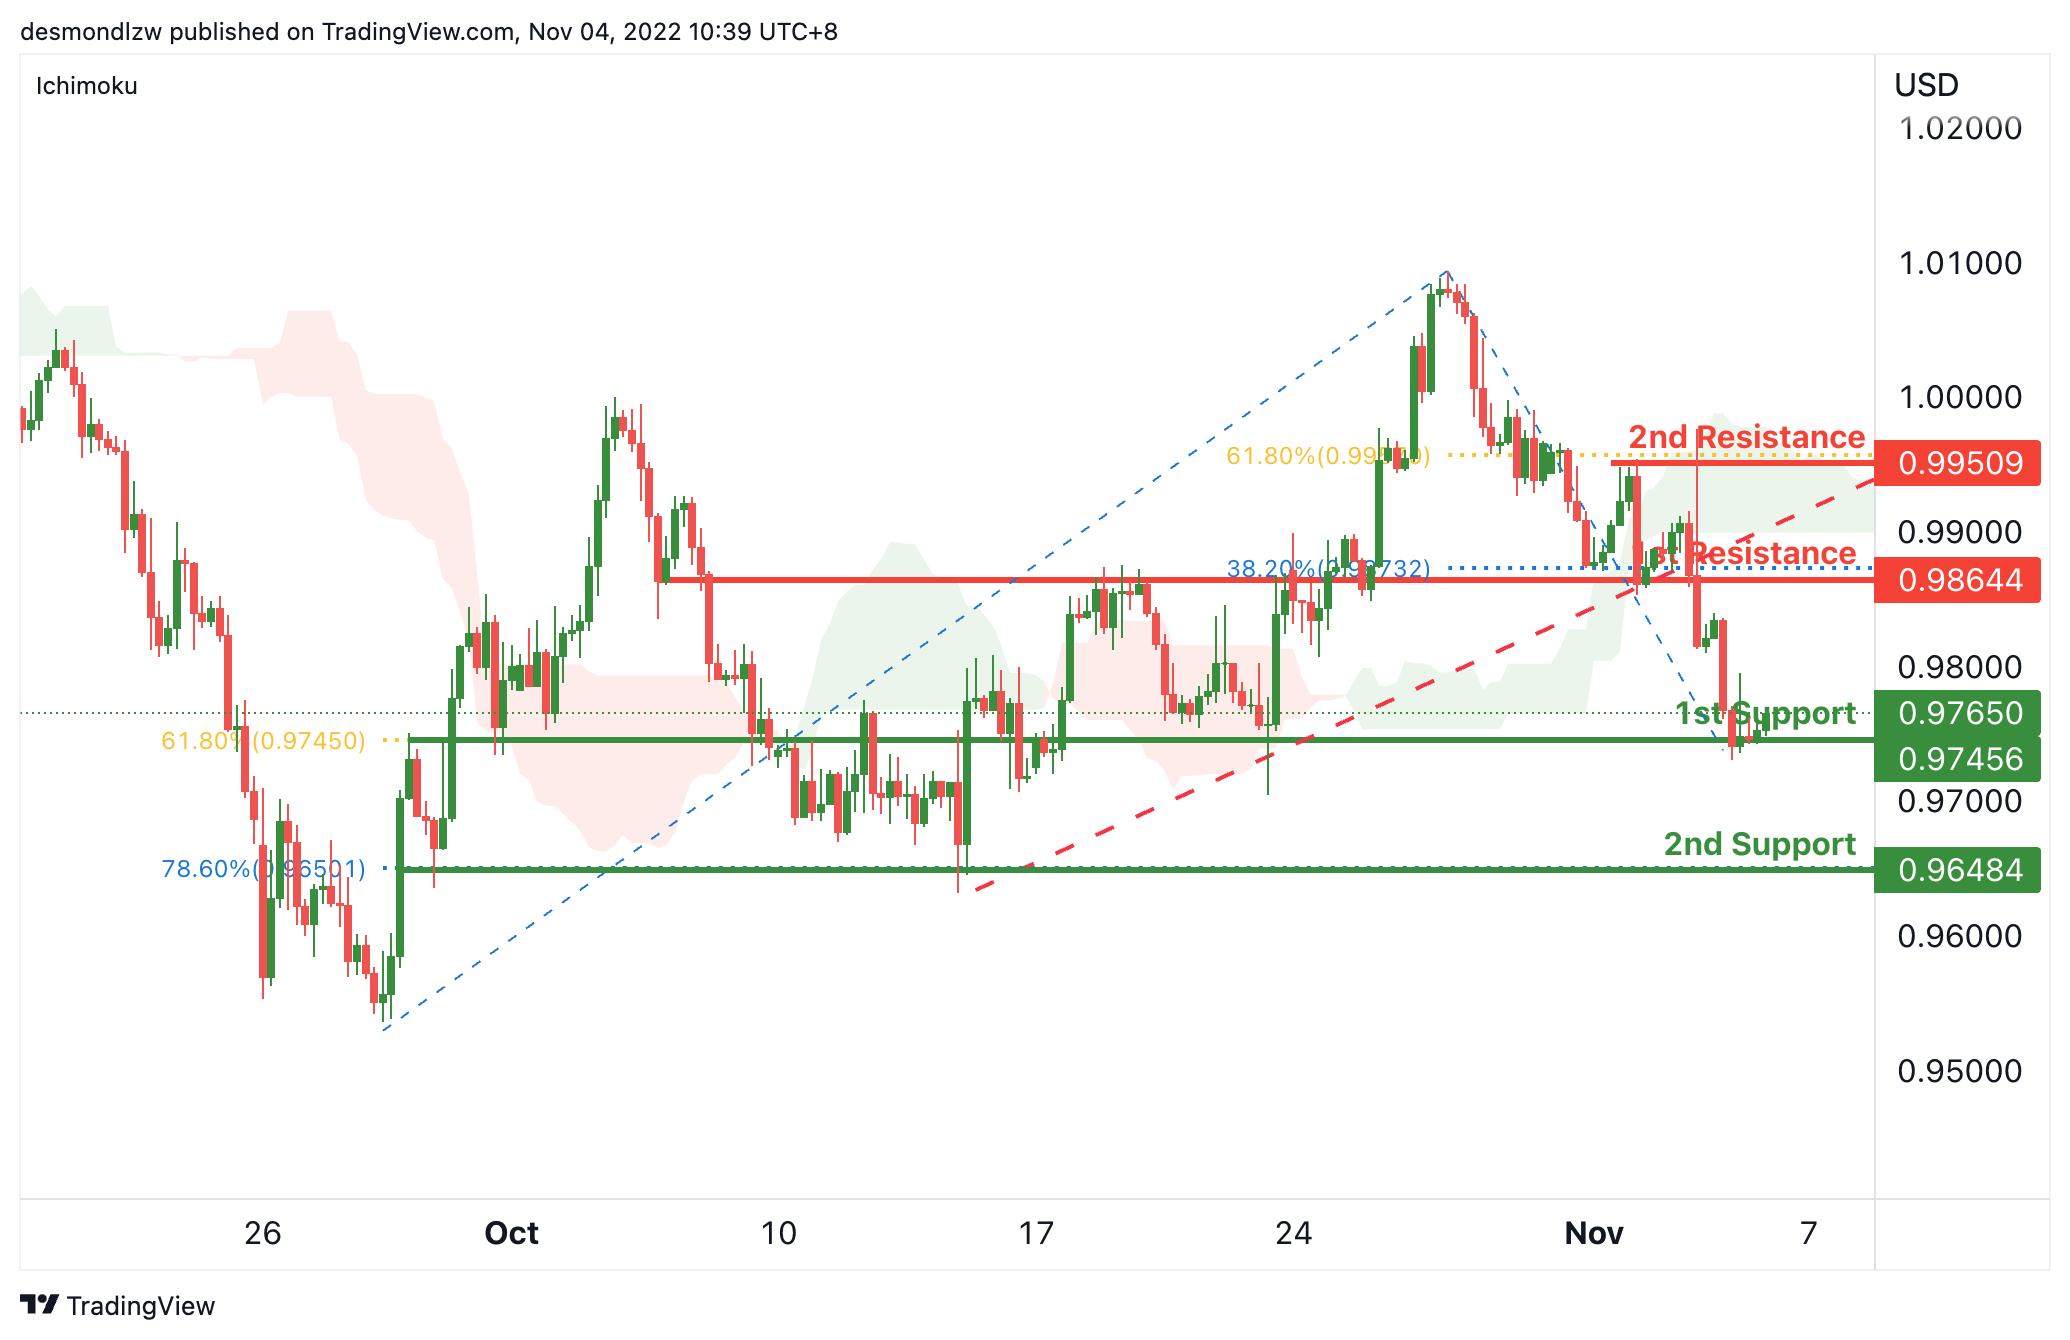
On the H4, with the price breaking the ascending trendline and ichimoku cloud, we have a bearish bias that the price may drop from the 1st support at 0.97456, which is in line with overlap support and 61.8% fibonacci retracement. If the 1st support is broken, the 2nd support is at 0.96484, which is in line with the 78.6% fibonacci retracement. Alternatively, the price may rise to the 1st resistance at 0.98644, where the overlap resistance and 38.2% fibonacci retracement are. If the 1st resistance is broken, the 2nd resistance is at 0.99509, which is in line with the overlap resistance and 61.8% fibonacci retracement.
Areas of consideration :
- H4 1st support at 0.97456
- H4 2nd support is 0.96484,
GBP/USD:
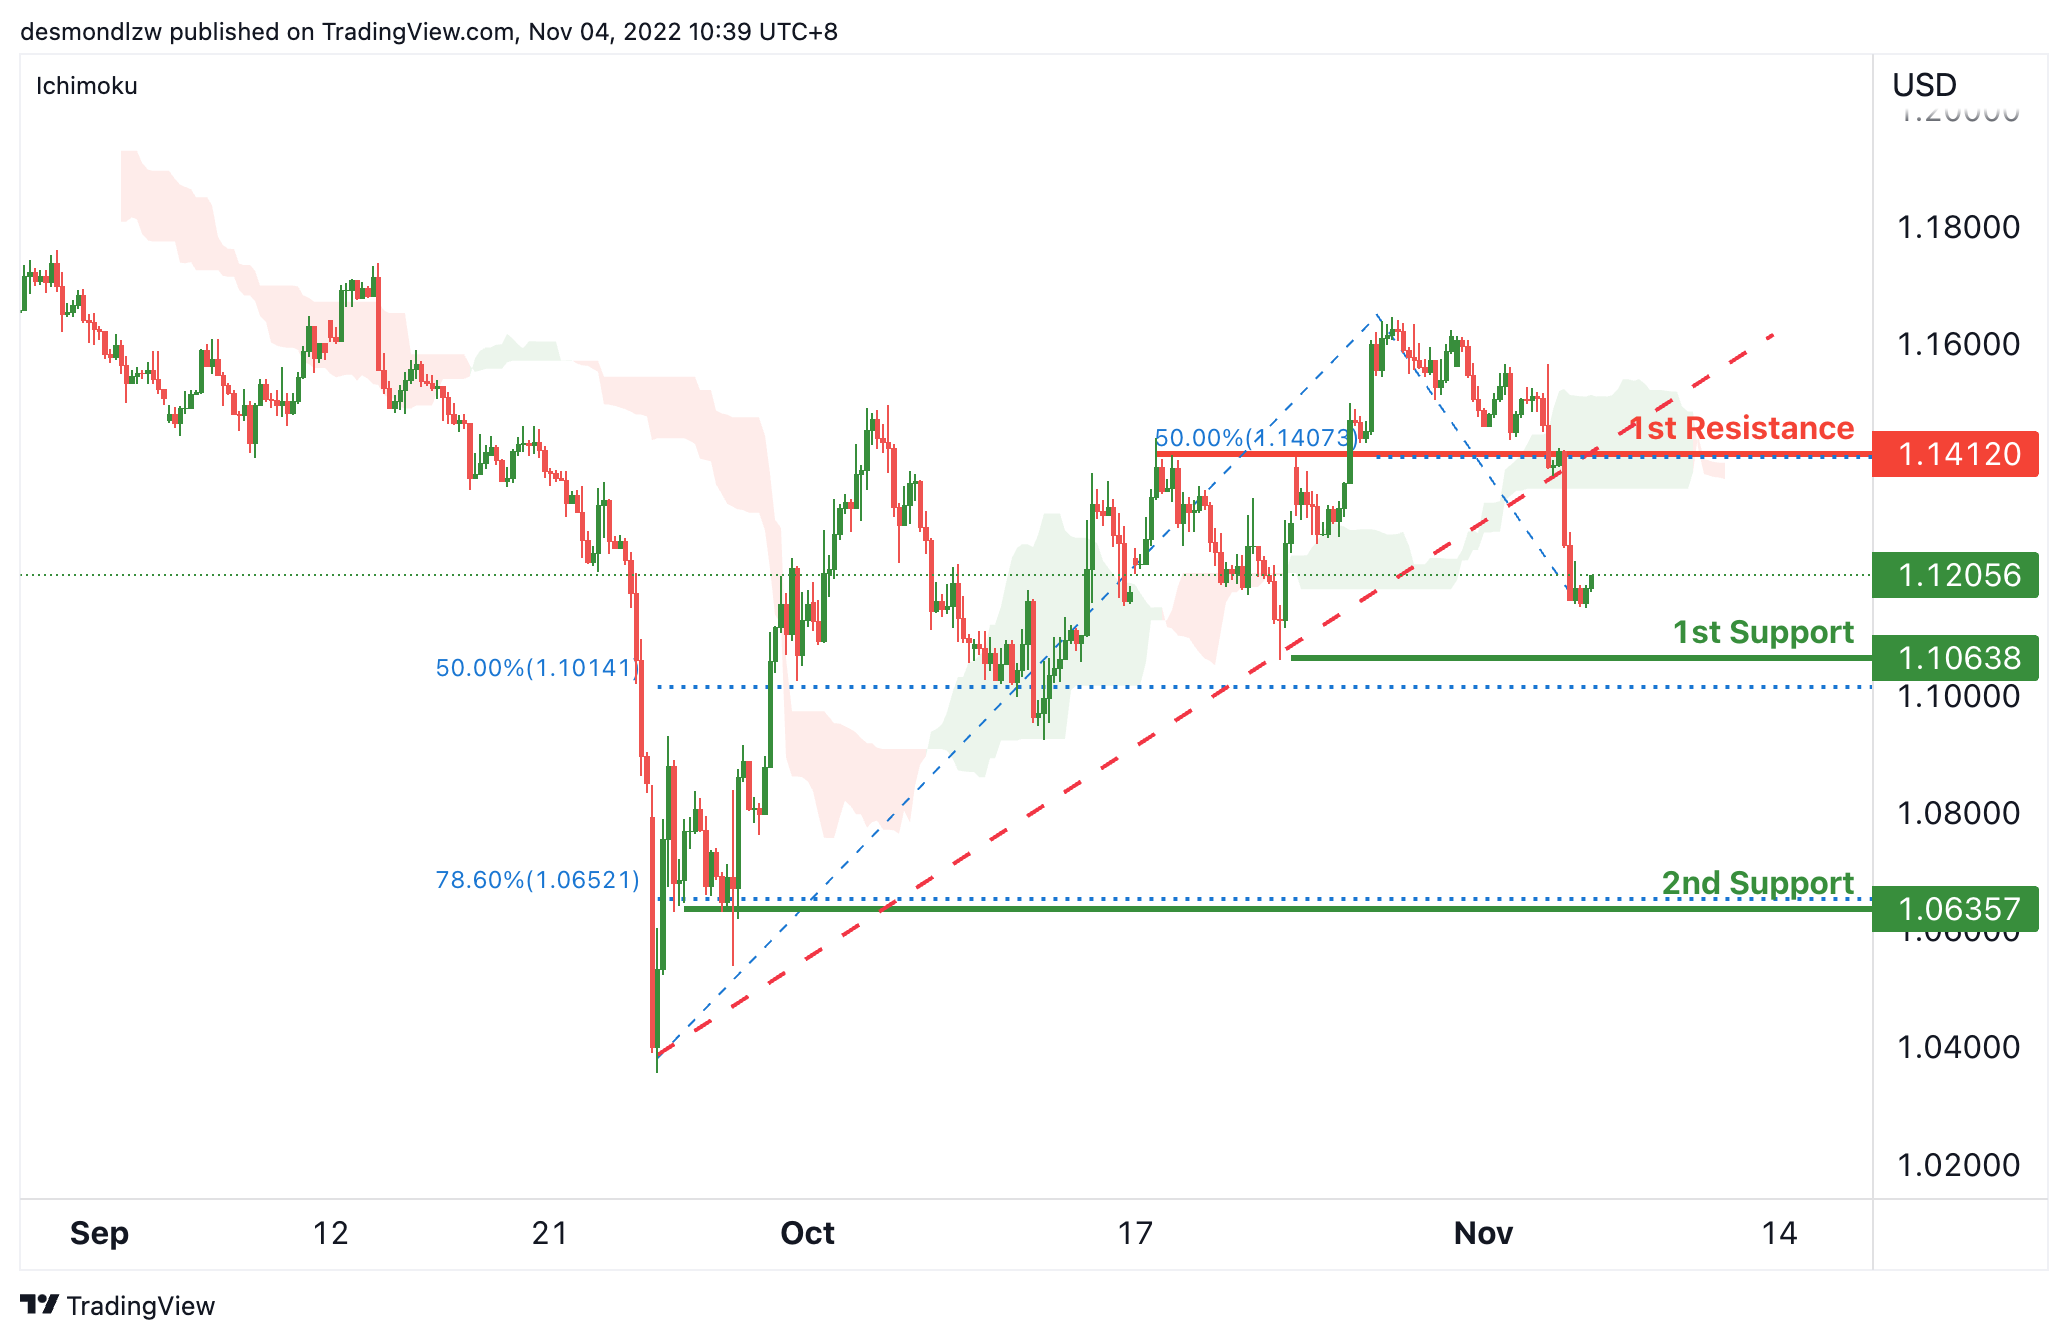
On the H4, price is below the ichimoku cloud and breaking the ascending trendline, we have a bearish bias that the price may drop to the 1st support at 1.10638, which is in line with the previous support and 50% fibonacci retracement. If the 1st support is broken, the 2nd support is at 1.06357, where the 78.6% fibonacci retracement is. Alternatively, the price may rise to the 1st resistance at 1.14120, where the overlap resistance and 50% fibonacci retracement are.
Areas of consideration:
- H4 current price
- H4 1st support at 1.10638
USD/CHF:
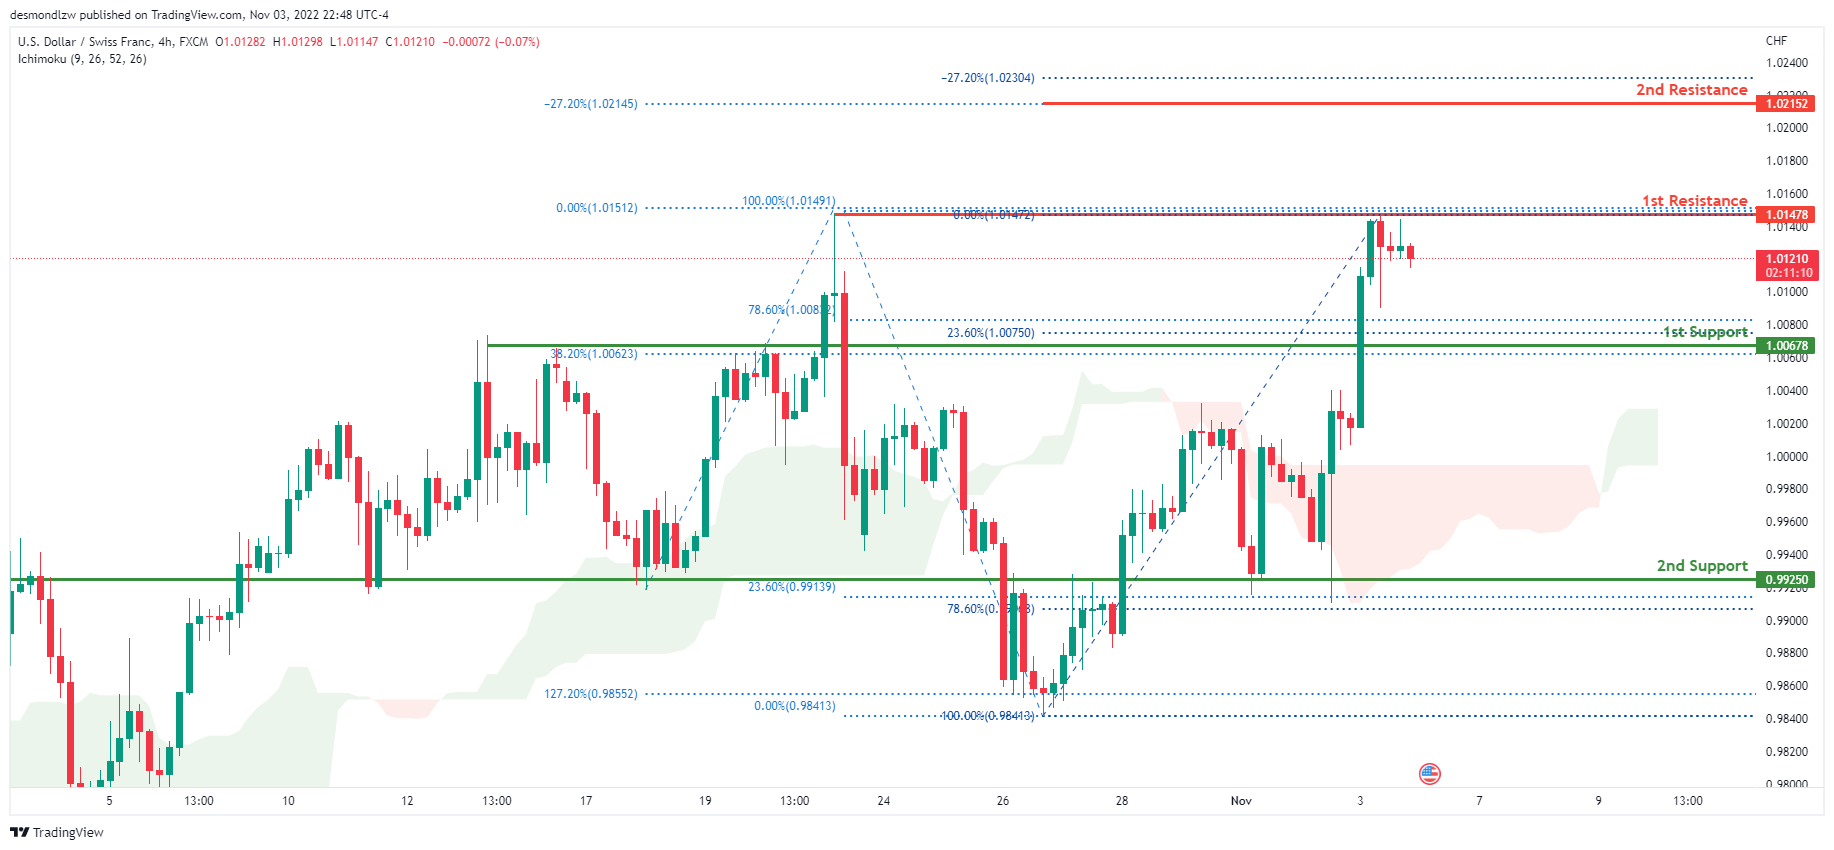
On the H4 chart, the overall bias for USDCHF is bullish. To add confluence to this, the price is above the Ichimoku cloud which indicates a bearish market. Overnight, USDCHF continued its bullish momentum upwards with the price currently trading at 1.01210 under the 1st resistance line at 1.01478 where the 100% Fibonacci line and previous swing high was located. If this bullish momentum continues, expect price to possibly break the 1st resistance and head towards the 2nd resistance at 1.02152 where 2 of the -27.2% Fibonacci lines are located.
Areas of consideration
- H4 1st support at 1.00678
- H4 1st resistance at 1.01210
- H4 2nd resistance at 1.02152
XAU/USD (GOLD):
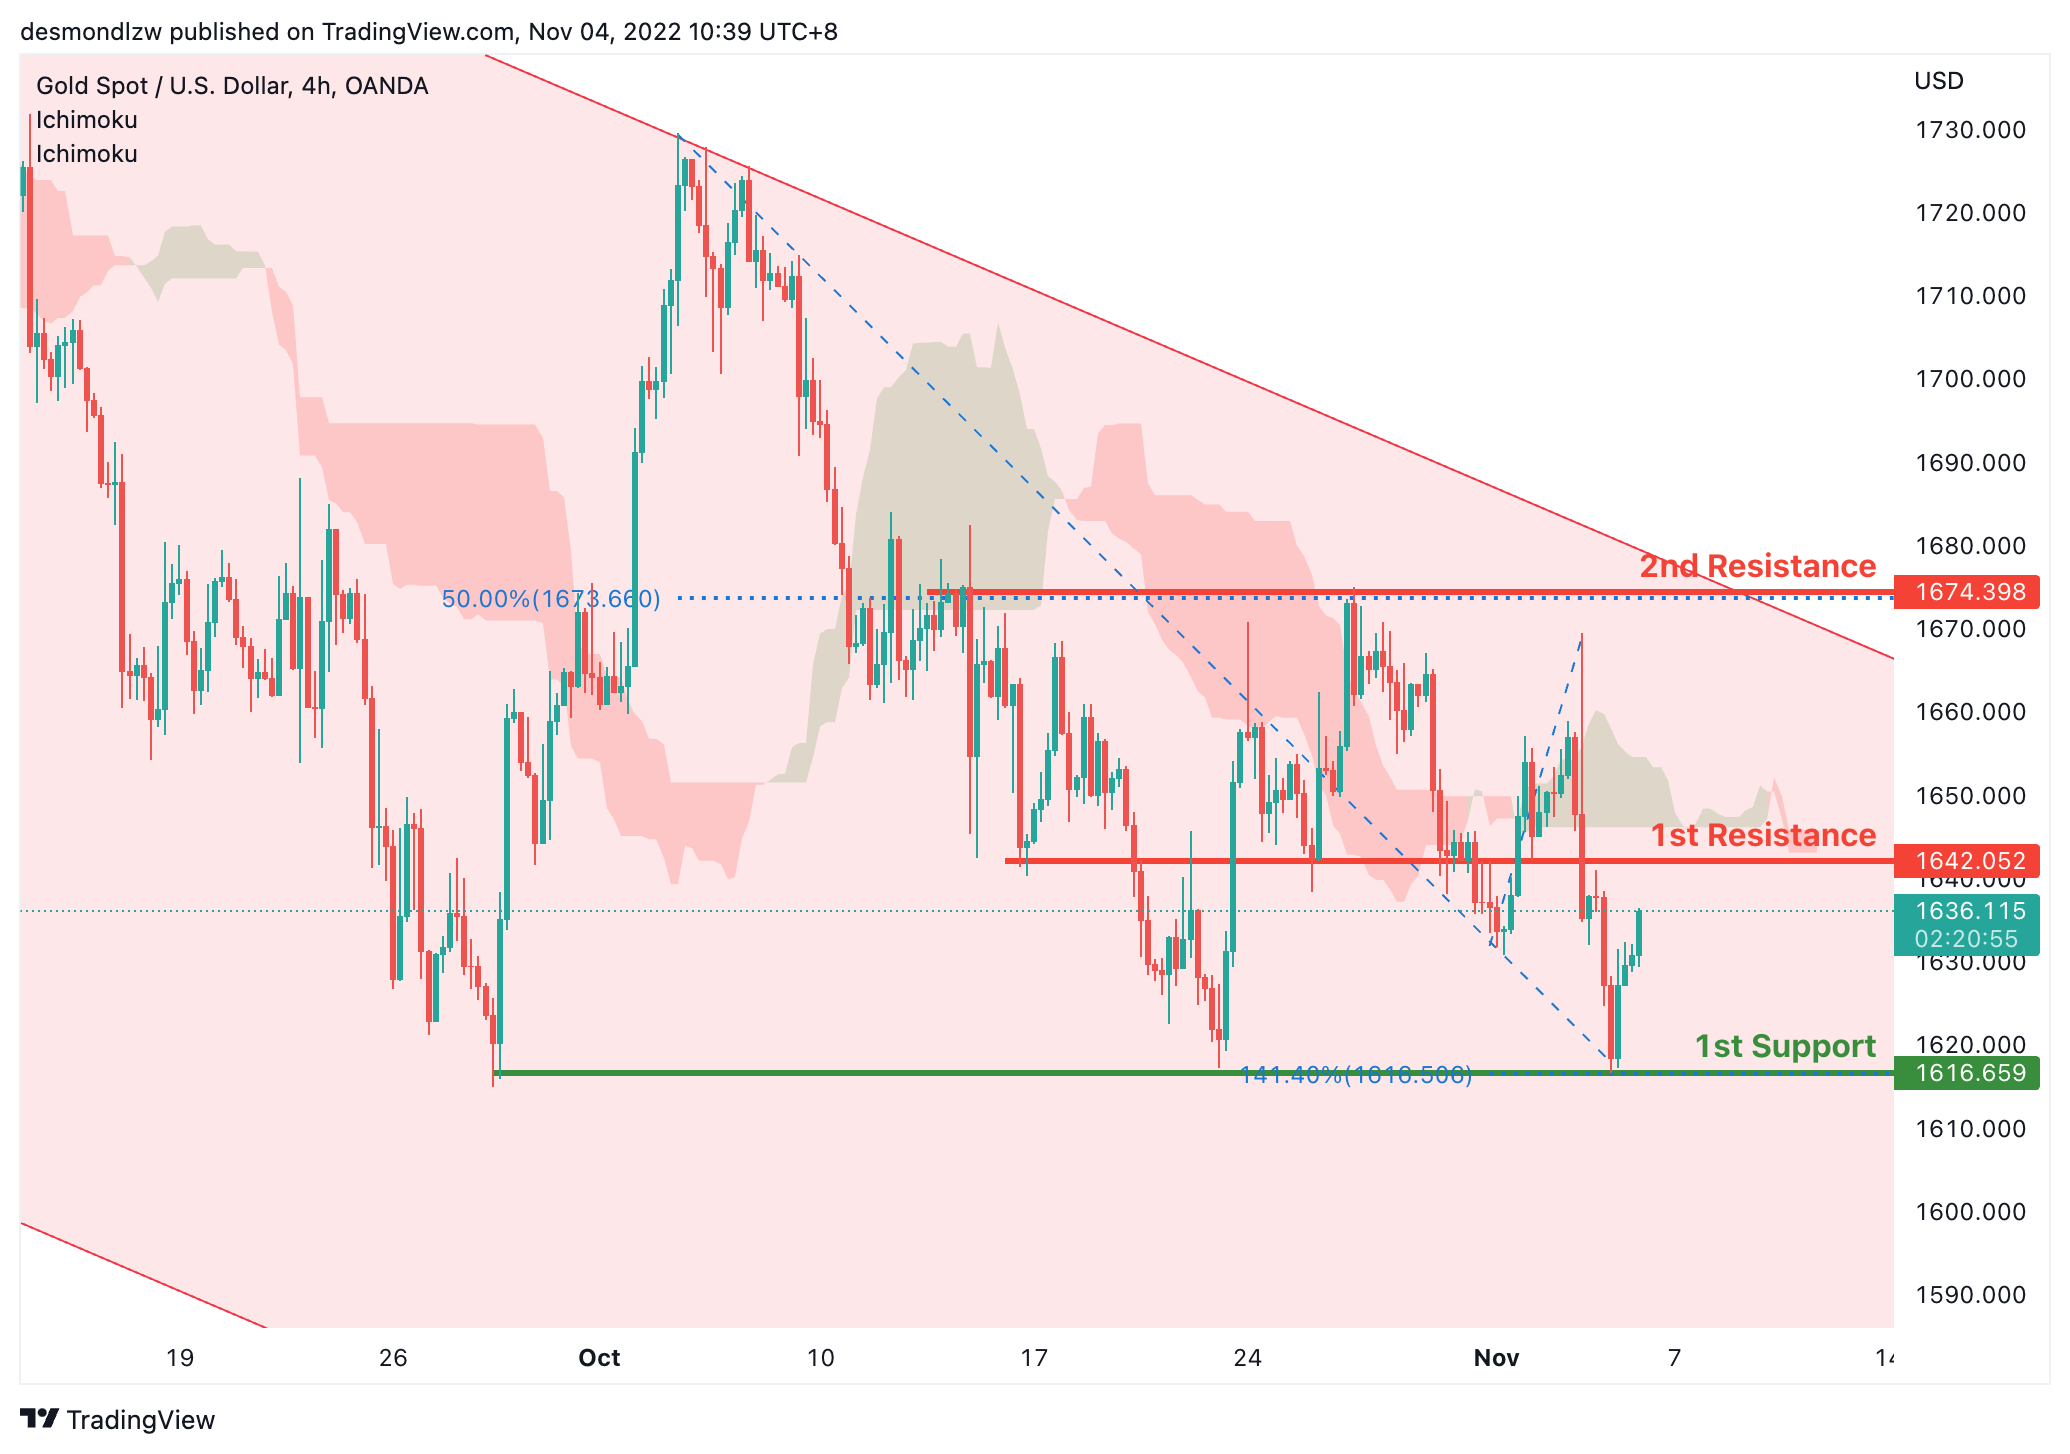
On H4, with the price within the descending channel and crossing ichimoku cloud, we have a bullish bias that the price may rise to the 1st resistance at 1642.052, which is in line with the overlap resistance and then drop back to the 1st support at 1616.659, where the previous swing lows are. Alternatively, the price may break the 1st resistance and rise to the 2nd resistance at 1674.398, where the previous swing high and 50% fibonacci retracement are.
Areas of consideration:
- H4 time frame, 1st resistance at 1642.052
- H4 time frame, 1st support at 1616.659
AUD/USD:
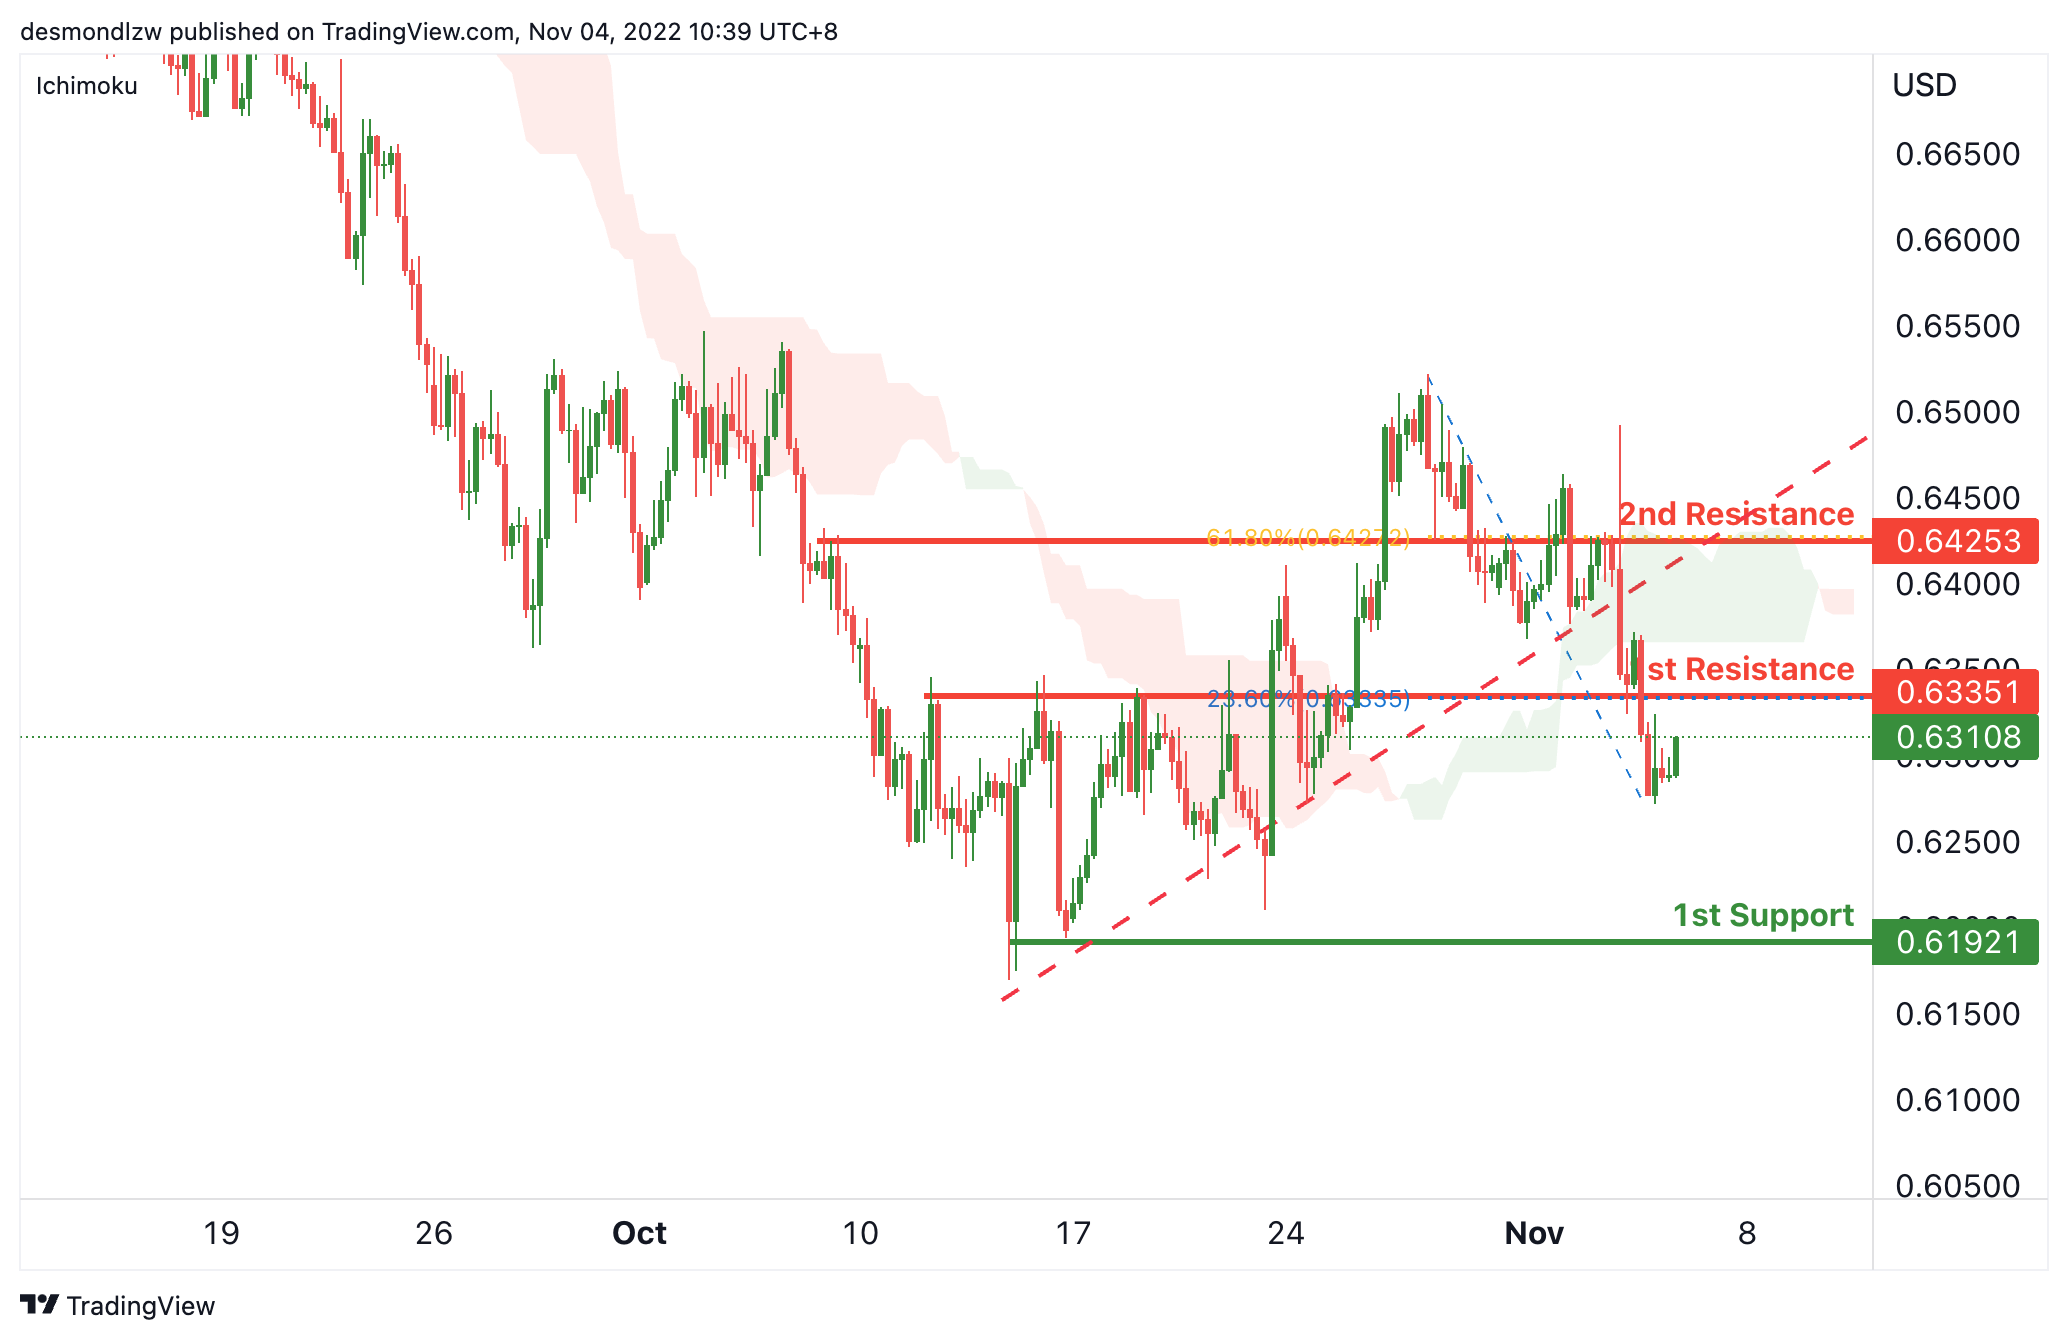
On the H4, with the price crossing the ichimoku cloud and breaking ascending trendline, we can expect the price drop from the 1st resistance at 0.63351, which is in line with the overlap resistance and 23.6% fibonacci retracement to the 1st support at 0.61921, where the swing low is. Alternatively, the price may rise to the 2nd resistance at 0.64252, where the 61.8% fibonacci retracement is.
Areas of consideration
- H4, 1st resistance at 0.63351
- H4, 1st support at 0.61921
NZD/USD:
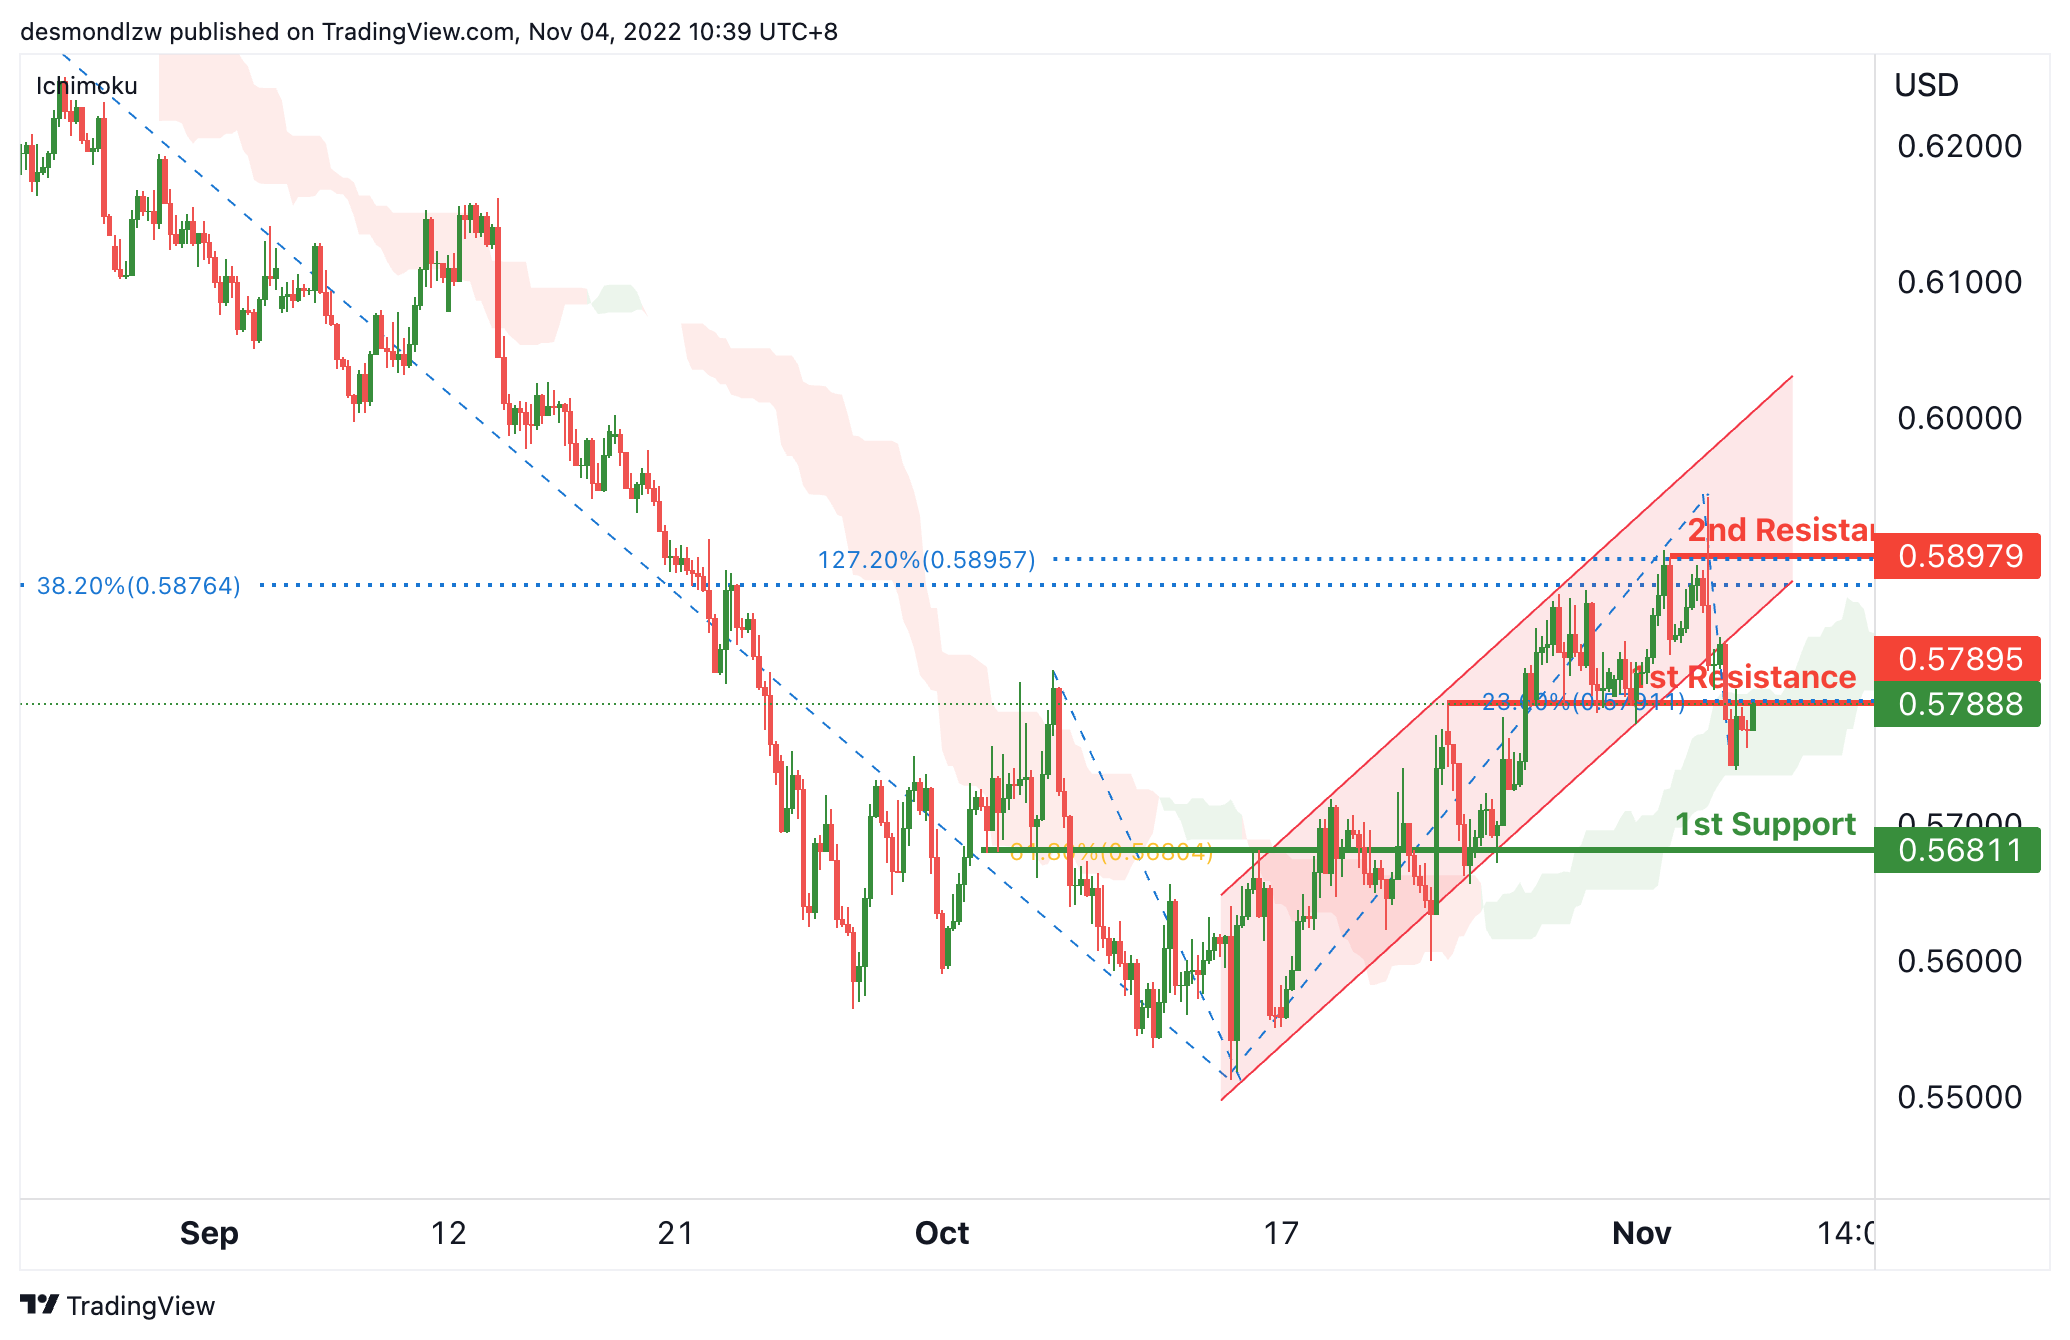
On the H4 chart, as the price is breaking the ascending channel, we have a bearish bias that the price may drop from the 1st resistance at 0.57863, which is in line with the overlap resistance and 23.6% fibonacci retracement to the 1st support at 0.56811, which is in line with the 61.8% fibonacci retracement. Alternatively, the price may rise to the 2nd resistance at 0.58979, where the previous swing high, 38.2% fibonacci retracement and 127.2% fibonacci extension are.
Areas of consideration:
- H4 time frame, 1st resistance at 0.57863
- H4 time frame, 1st support at 0.56811
USD/CAD:
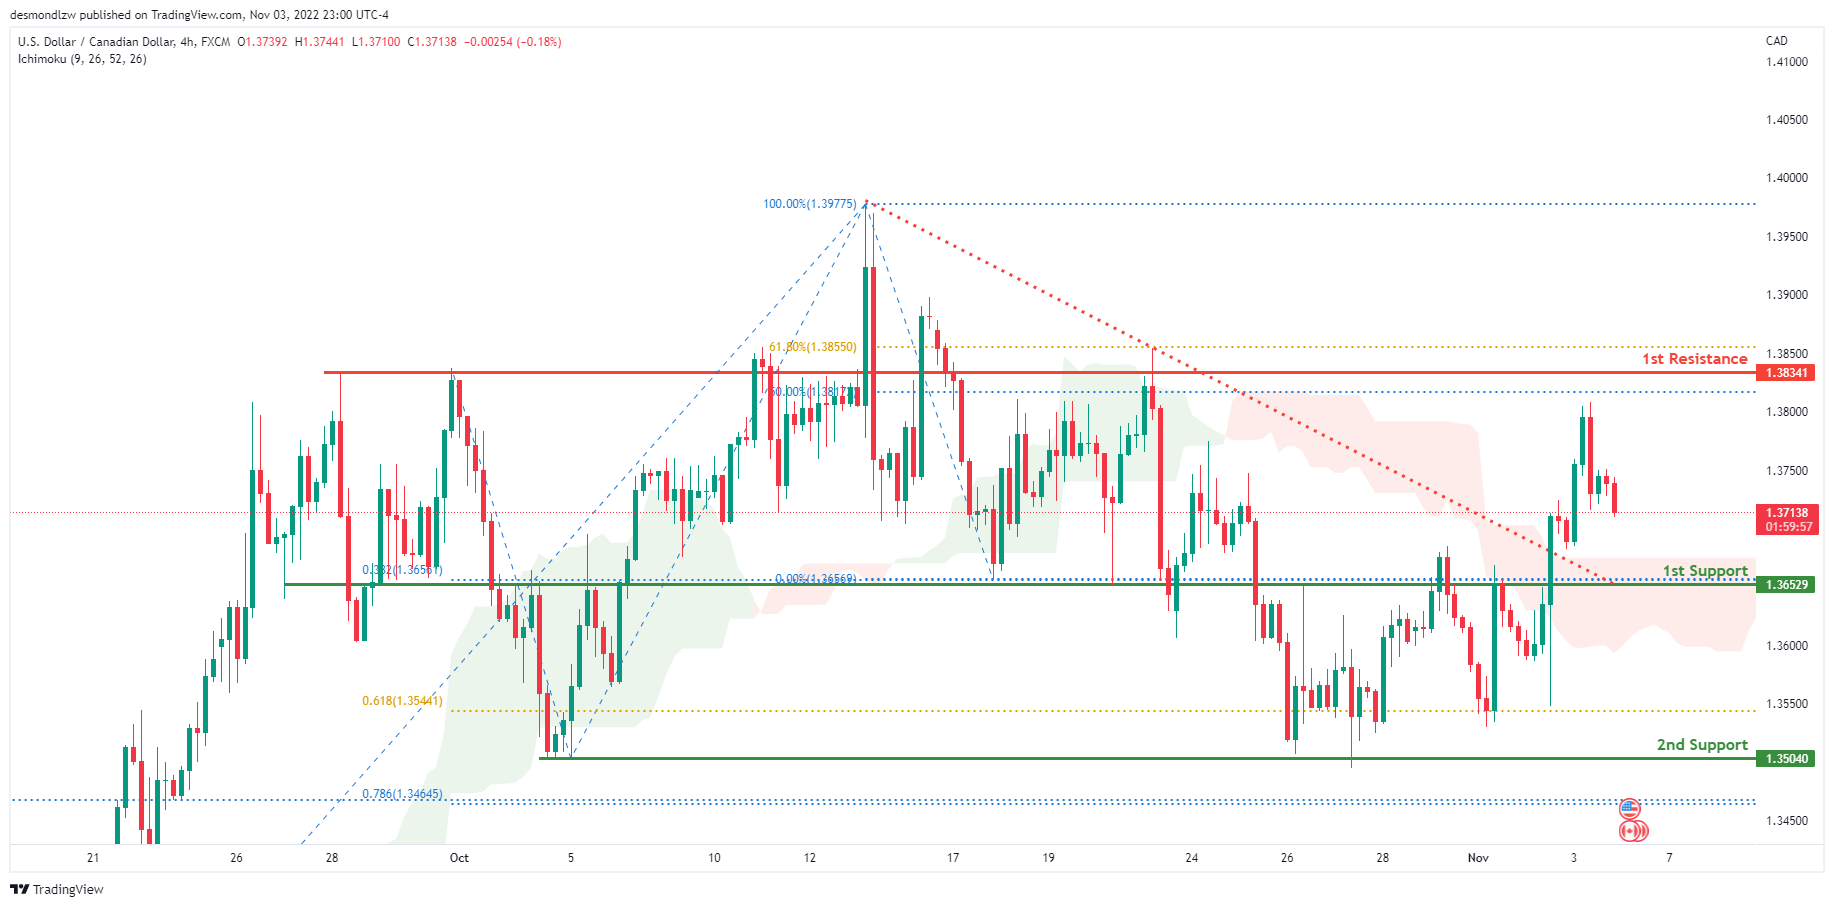
On the H4 chart, the overall bias for USDCAD is bullish with price breaking the bearish trend line. To add confluence to this, the price is above the Ichimoku cloud which indicates a bullish market. Overnight, price had some bearish retracement with price currently trading at 1.37093 at the time of writing. If this bullish momentum continues, expect price to possibly head towards the 1st resistance line at 1.38341 where the 61.8% and 50% Fibonacci lines are located.
Areas of consideration:
- H4 time frame, 1st resistance at 1.38341
- H4 time frame, 1st support at 1.36529
- H4 time frame, 2nd support at 1.35040
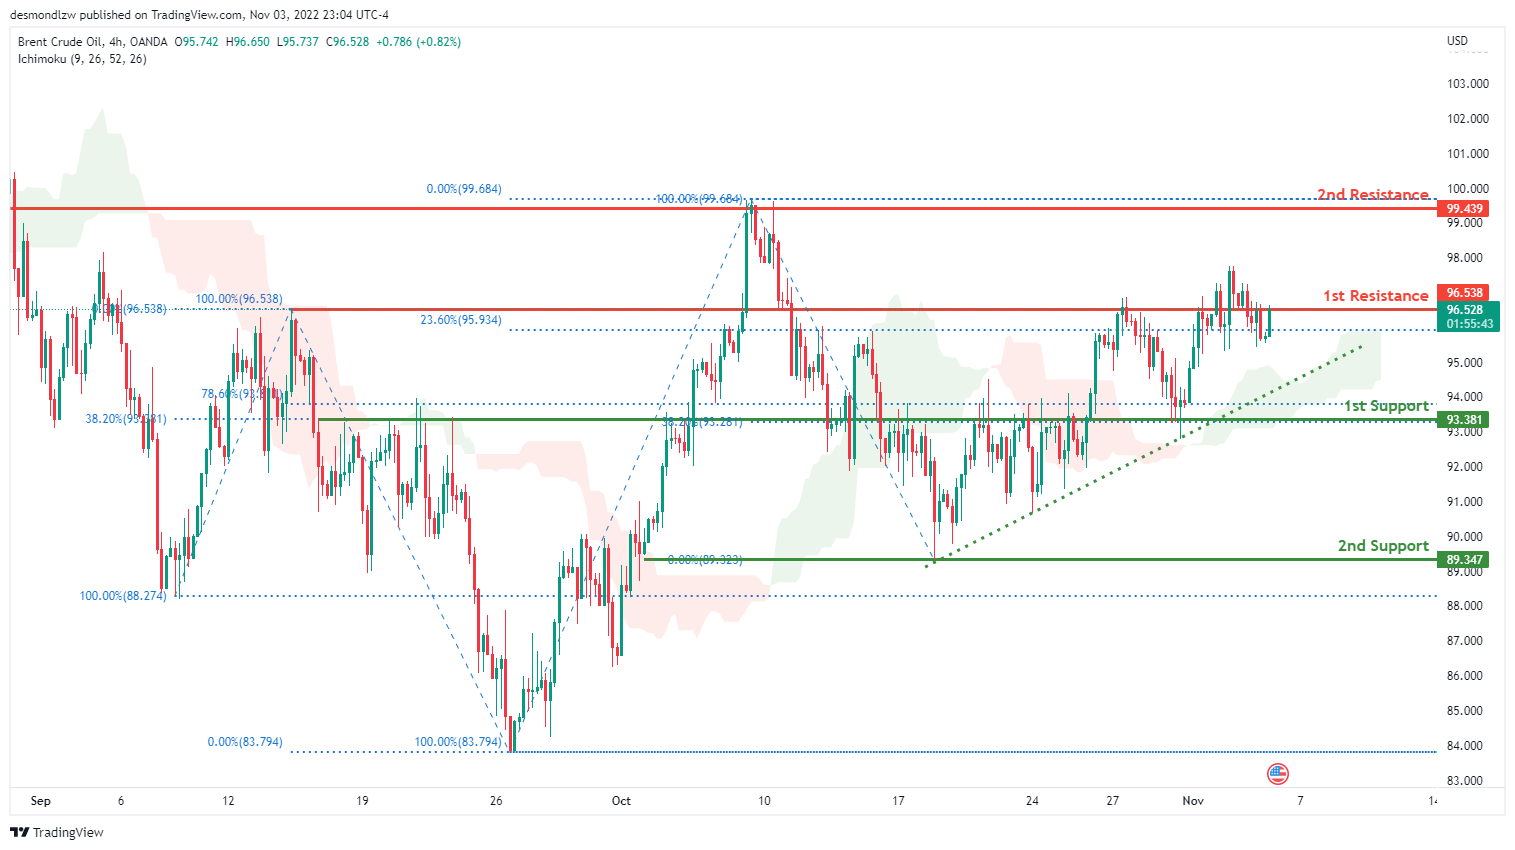
OIL:
Looking at the H4 chart, the current overall bias for Oil is bullish. To add confluence to this, the price is above the Ichimoku cloud which indicates a bullish market. Overnight, price continued to consolidate along the 1st support line at 96.538 where the 100% and 23.6% Fibonacci lines are located. If this bullish momentum continues, expect price to possibly head towards the 1st resistance at 99.439 where previous swing high and 0% Fibonacci line is located.
Areas of consideration:
- H4 time frame, 1st resistance at 99.439
- H4 time frame, 1st support at 96.538
Dow Jones Industrial Average:
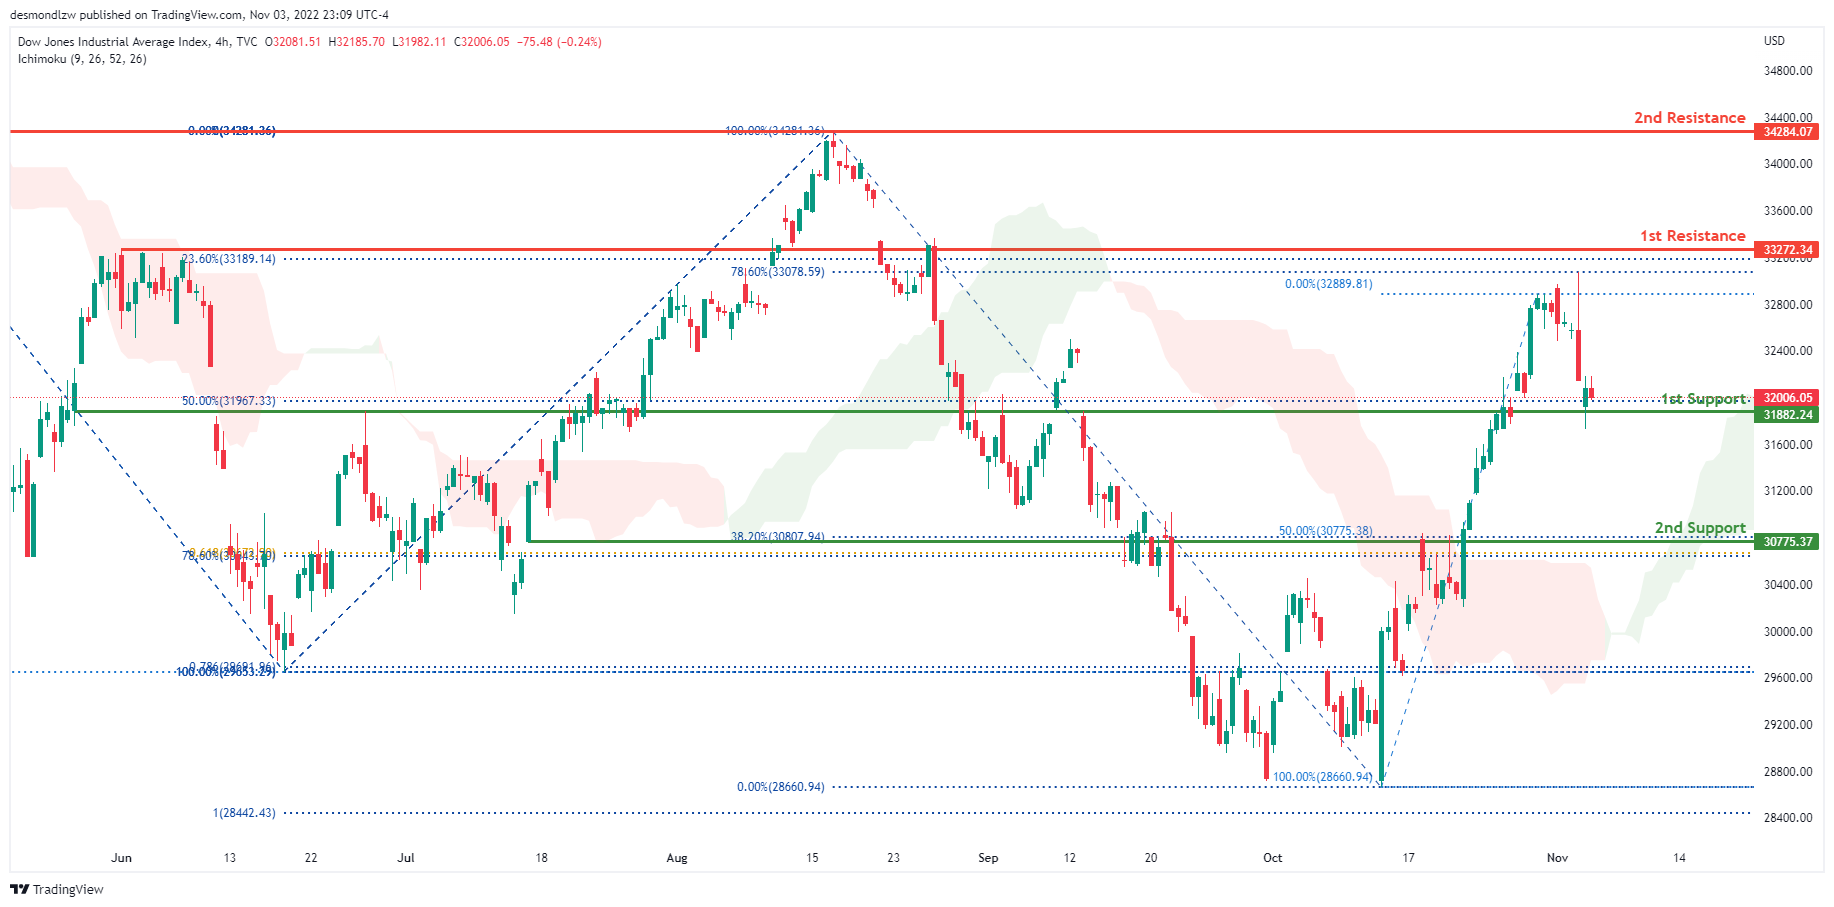
On the H4 chart, the overall bias for DJI is bullish. To add confluence to this, the price is above the Ichimoku cloud which indicates a bullish market. Overnight, it continued its bearish momentum downwards with the price currently resting along the 1st support at 31882.24 where the 50% Fibonacci line is located. The price is currently trading at 32006.05 at time of writing. If this bullish momentum continues, expect the price to possibly head towards the 1st resistance at 33272.34 where the 23.6% and 78.6% Fibonacci lines are located.
Areas of consideration:
- H4 time frame, 1st support at 31882.24
- H4 time frame, 1st Resistance at 33272.34
DAX:
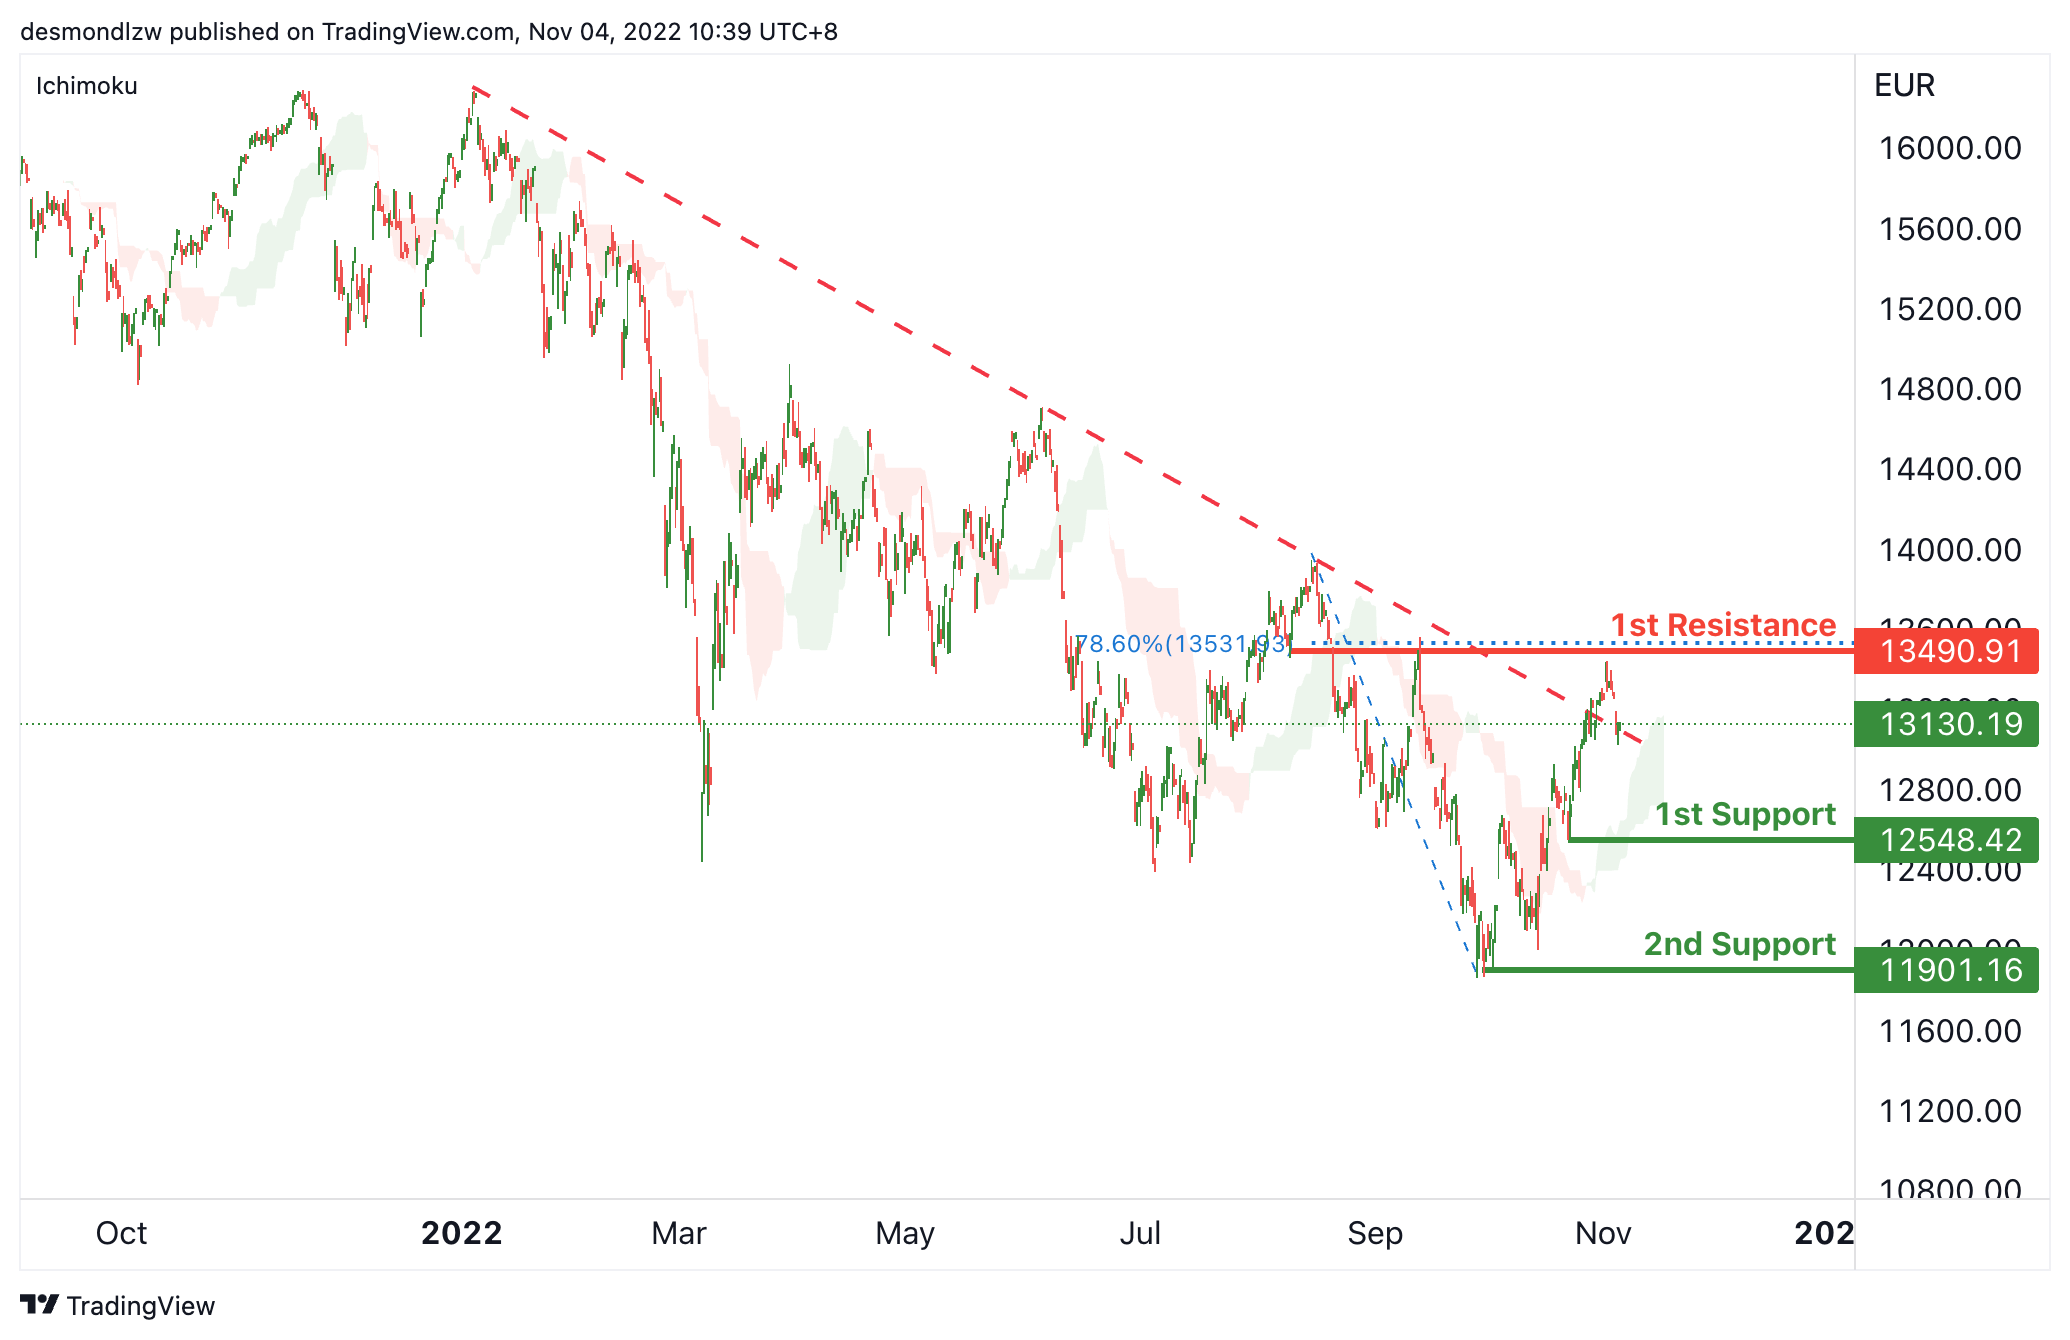
On the H4 chart, the price dropped back to the descending trendline. Expecting price to possibly continue this bearish momentum and head towards the 1st support at 12548.42, which is in line with the previous swing low. If the 1st support is broken, the 2nd support is at 11901.16, which is in line with the significant swing low. Alternatively, as the price is above ichimoku cloud, the price may rise to the 1st resistance at 13490.91, where the 78.6% Fibonacci line is located.
Areas of consideration:
- H4 time frame, current price
- H4 time frame, 1st support at 12548.42
ETHUSD:
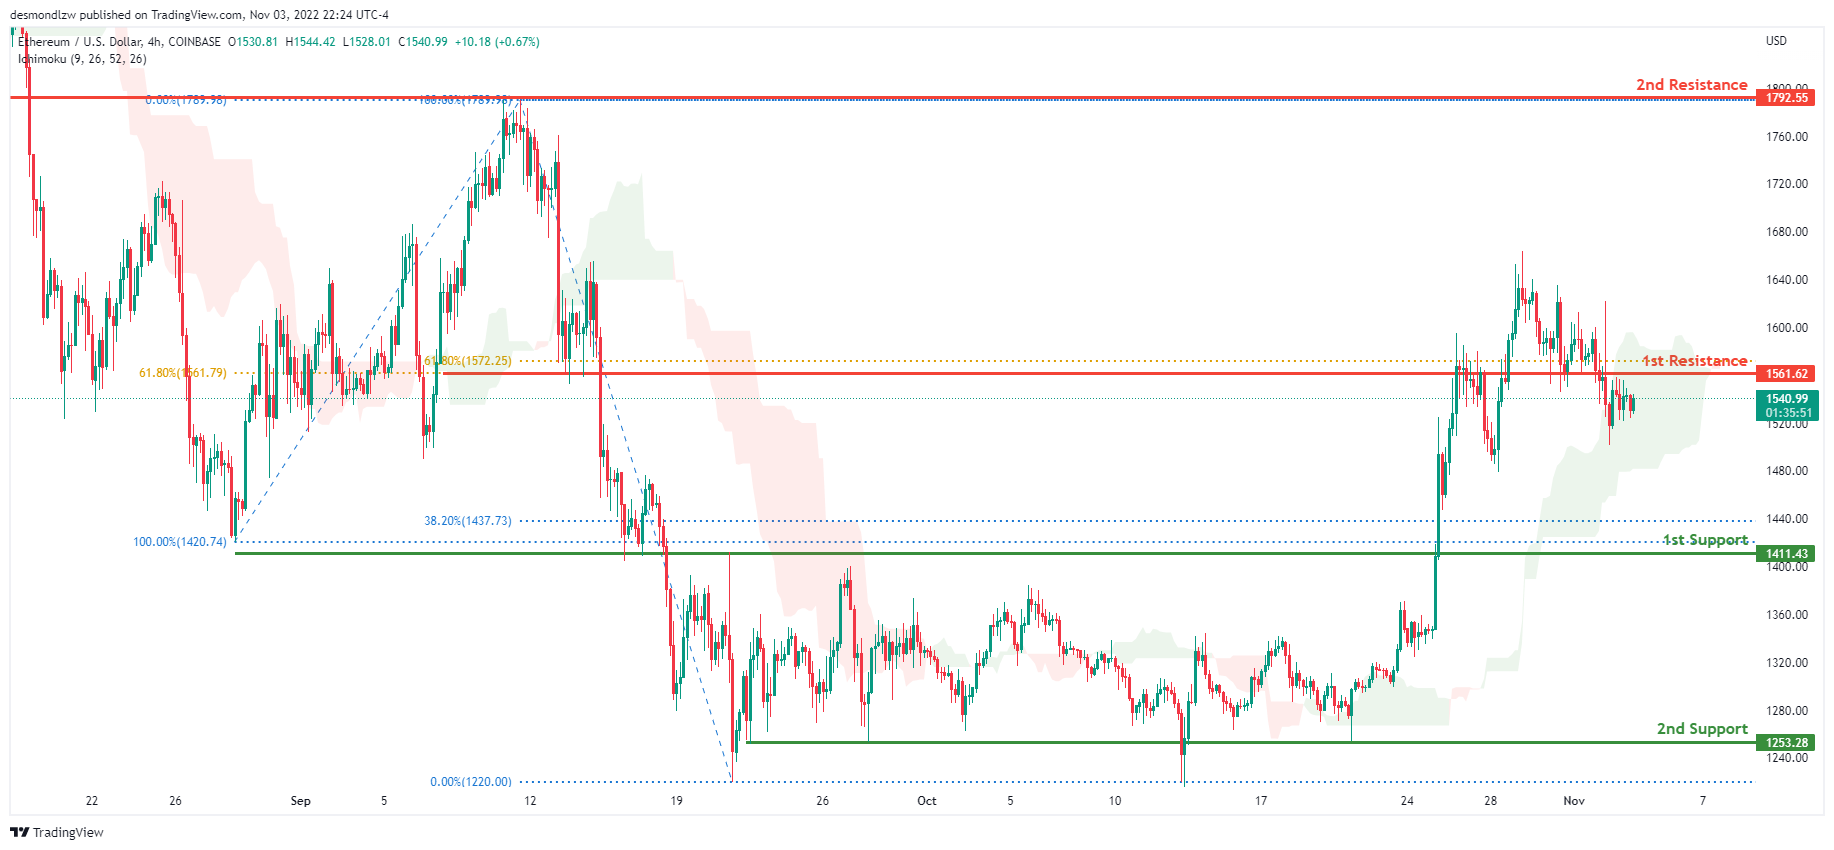
Looking at the H4 chart, the current overall bias for ETHUSD is bullish, with price currently within the green Ichimoku cloud. Overnight, price continued to consolidate under the 1st resistance level at 1561.62 where 2 of the 61.8% Fibonacci lines are located. Expecting price to possibly retrace back up and retest the 1st resistance level.
Areas of consideration:
- H4 time frame, 1st resistance of 1561.62
- H4 time frame, 1st support at 1411.43
BTCUSD:
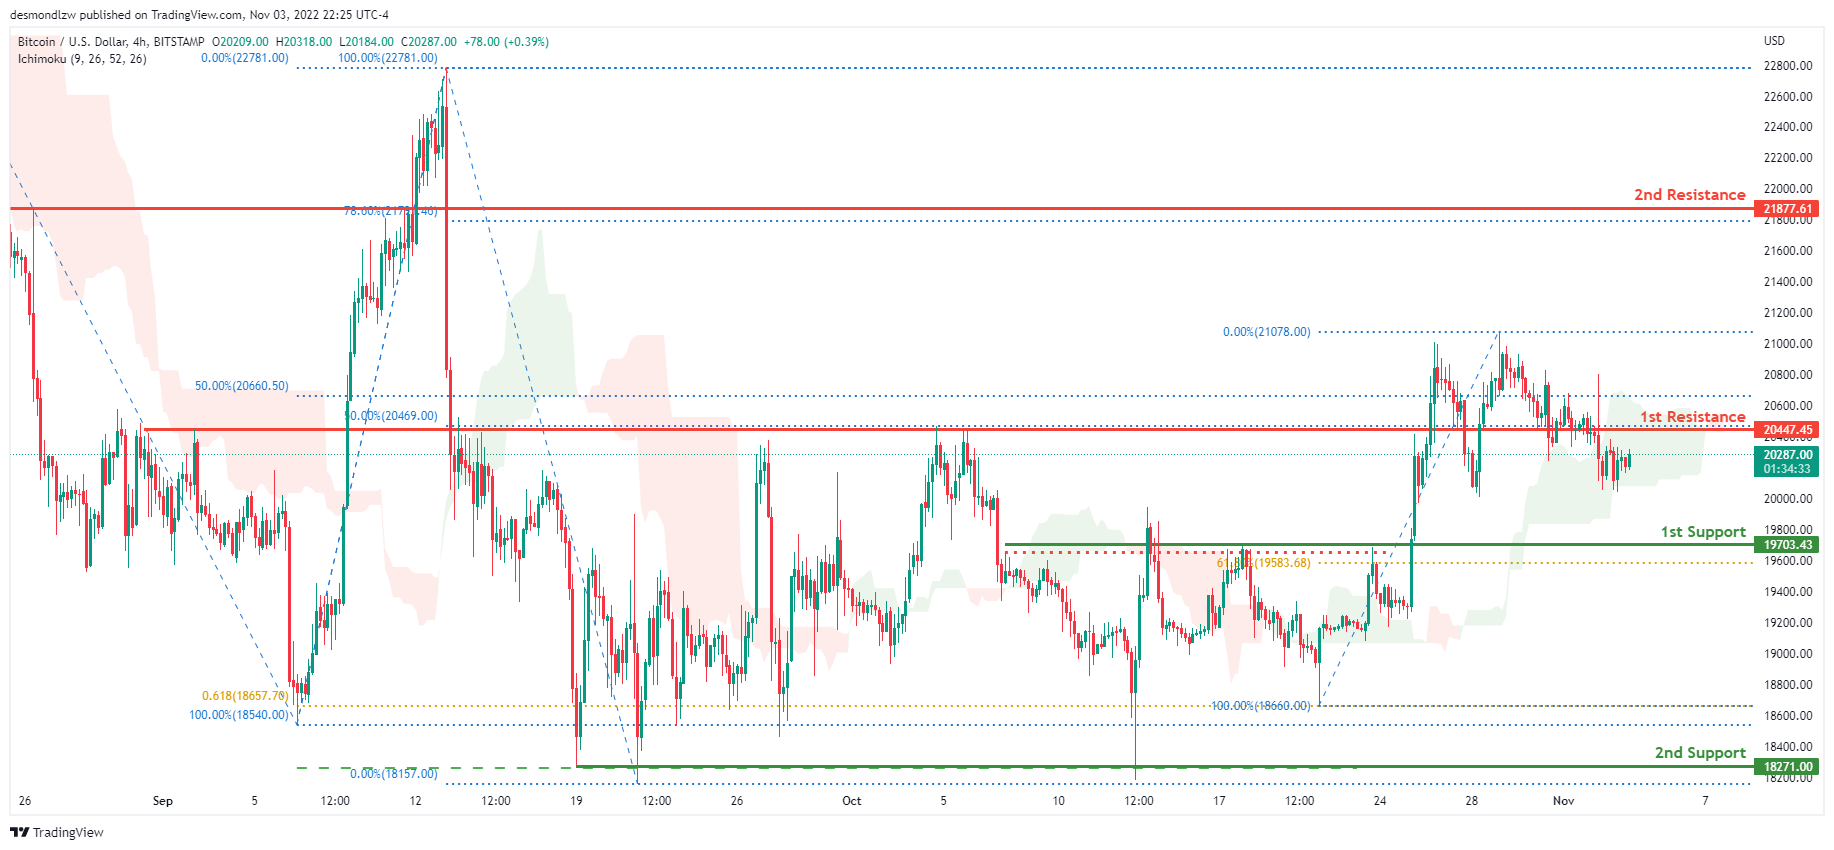
Overnight, the price continued to consolidate under the 1st resistance 20447.45 where the 2 of the 50% Fibonacci lines are located. With the price crossing the Ichimoku cloud and resting on the bullish trend line. We can expect price to continue bearish towards the 1st support level at 19703.43 where the 61.8% Fibonacci line is located.
Areas of consideration:
- H4 time frame, 1st resistance 20447.45
- H4 time frame, 1st support at 19703.43
S&P 500:
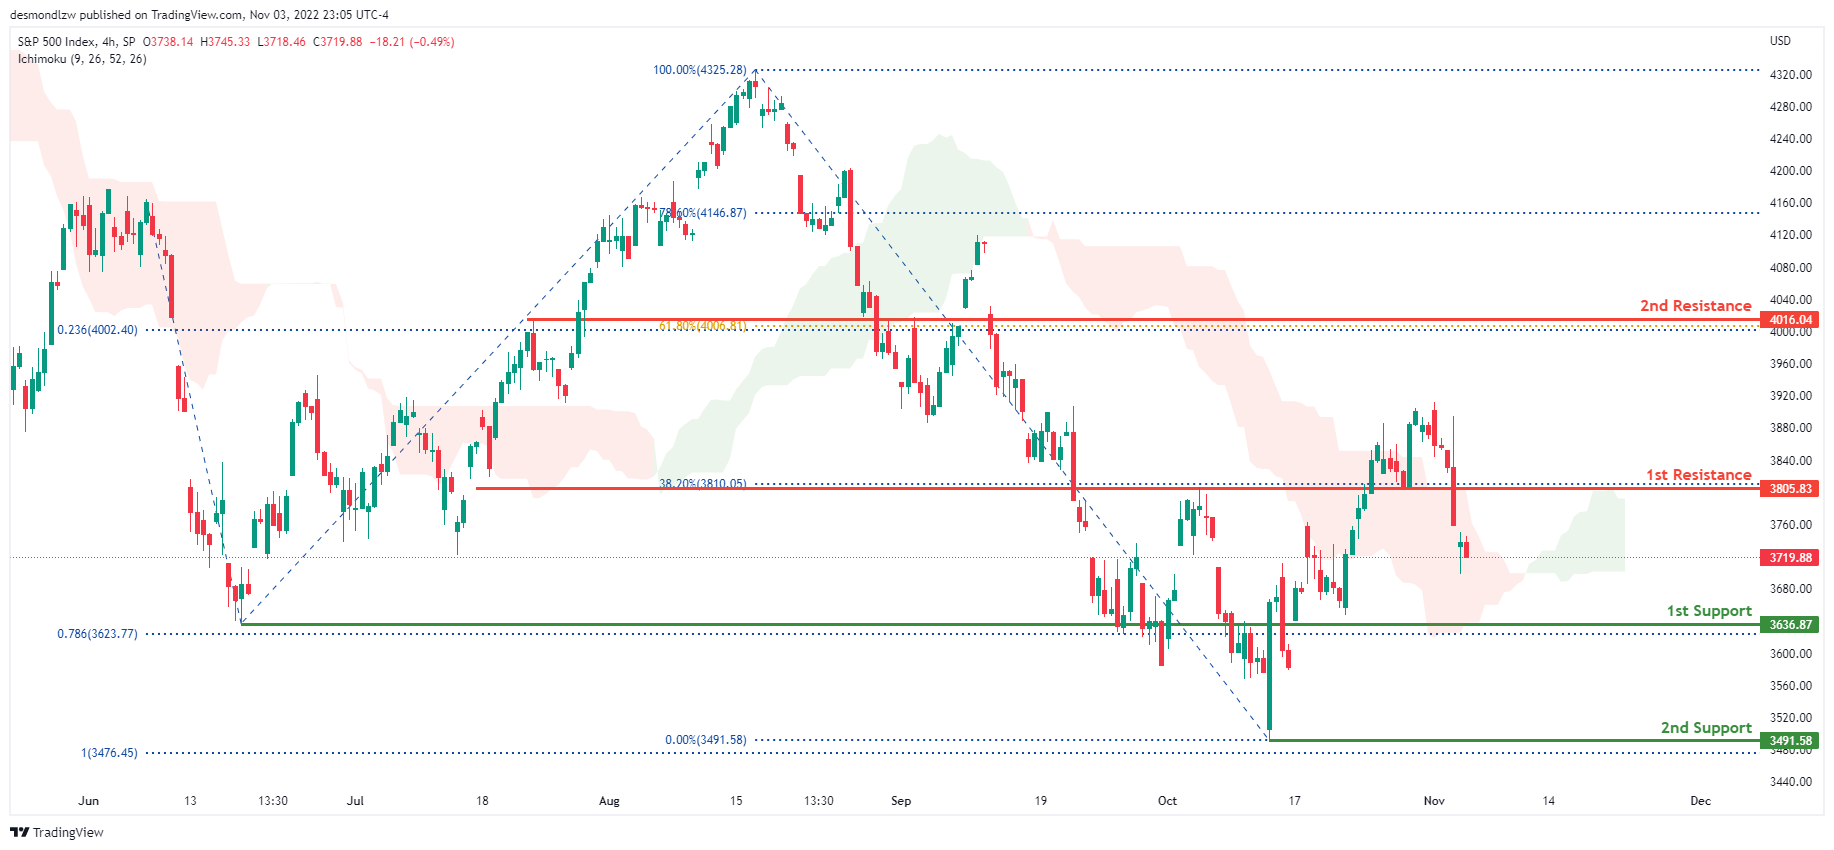
On the H4 chart, the overall bias for S&P500 is bearish . Overnight, price continued its bearish momentum with price closing under the 1st resistance at 3805.83 where the 38.2% Fibonacci line is located. The price is currently trading at 3719.88 at time of writing. If this bearish momentum continues, expect price to possibly head towards the 1st support at 3636.87 where the previous swing low and 78.6% Fibonacci projection line is located.
Areas of consideration:
- H4 time frame, 1st support at 3636.87
- H4 time frame, 1st resistance at 3805.83
USD/CHF Daily Outlook
Daily Pivots: (S1) 1.0044; (P) 1.0095; (R1) 1.0187; More...
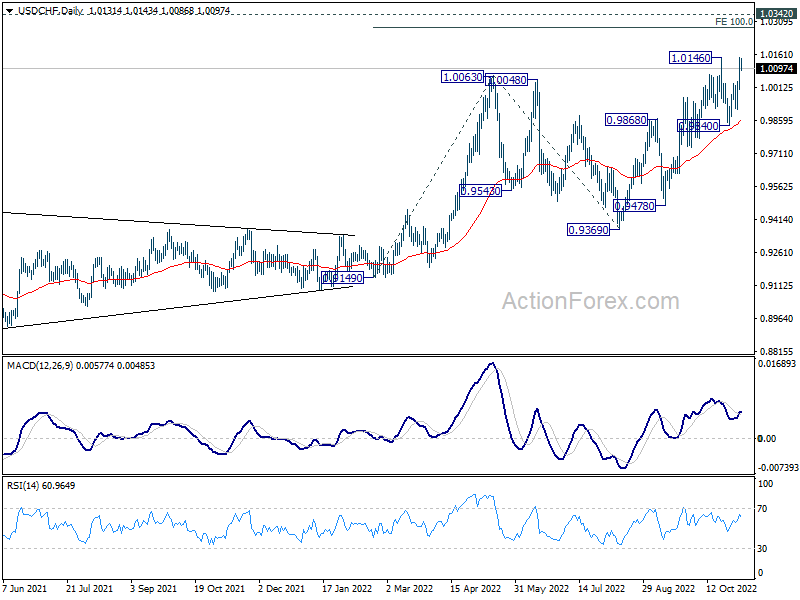
USD/CHF retreats mildly ahead of 1.0146 resistance, but intraday bias stays neutral first. On the upside, firm break of 1.0146 will resume larger up trend. Next target is 1.0283 projection level. On the downside, below 1.0031 minor support will turn intraday bias neutral first. But outlook will stay bullish as long as 0.9840 support holds, in case of retreat.
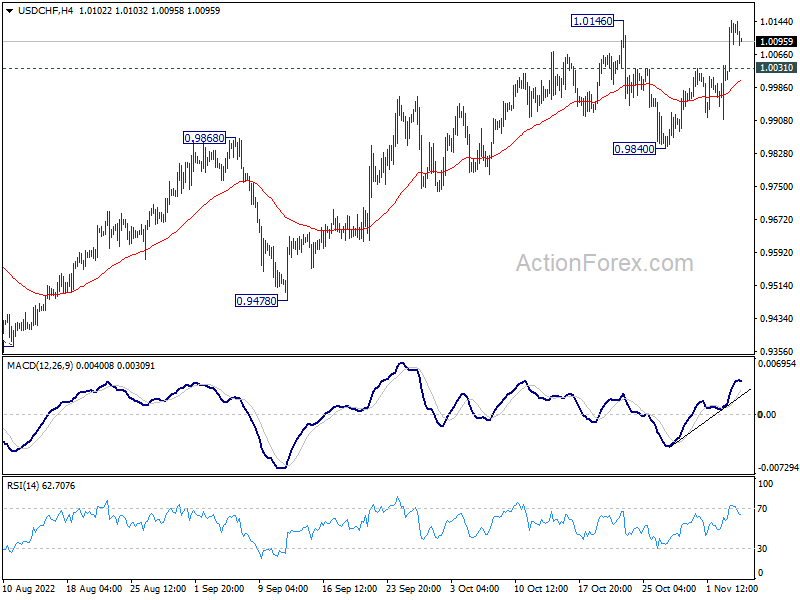
In the bigger picture, current development suggests that up trend from 0.8756 (2021 low) is still in progress. Next target is 100% projection of 0.9149 to 1.0063 from 0.9369 at 1.0283, and then 1.0342 (2016 high). For now, this will remain the favored case as long as 0.9779 support holds, even in case of deep pull back.