Sample Category Title
Aussie, Kiwi Slip on Asia Stock Retreat, PMIs Weigh, Dollar Awaits Fed’s Bowman and Powell
Commodity currencies slipped in quiet trading today, with Aussie and Kiwi leading losses as regional equities pulled back. With Japan on holiday, volumes were thin, but risk sentiment deteriorated after both Chinese and Hong Kong tech stocks retreated from a month-long rally.
Australia’s PMI data added further weight to the currency. The September surveys showed softening momentum in both manufacturing and services, eroding confidence and fueling expectations that growth may be fragile heading into year-end. Markets widely expect the RBA to stand pat next week, but speculation lingers over whether policymakers will signal readiness to cut again in November.
Dollar, meanwhile, traded mixed. Investors are parsing a steady stream of Fed commentary following last week’s 25bps rate cut. New Governor Stephen Miran continued to push for larger moves, but other officials leaned more cautious, stressing that additional cuts are not automatic and depend on data.
Attention now turns to upcoming speeches from other Fed officials, with focus on Governor Michelle Bowman. Markets will be listening for her explanation of why she backed a 25bps reduction but resisted a deeper 50bps move last week. Chair Jerome Powell is also due to speak, though few expect him to deviate from the steady tone he struck just a week ago.
In performance terms, Loonie is the weakest performer so far this week, followed by Kiwi and Aussie. On the other side, Euro leads gains, with Swiss Franc and Sterling also firm. Dollar and Yen are positioned mid-pack. The tilt in momentum now favors Europe.
In Asia, at the time of writing, Hong Kong HSI is down -1.10%. China Shanghai SSE is down -1.22%. Singapore Strait Times is up 0.18%. Japan is on holiday. Overnight, DOW rose 0.14%. S&P 500 rose 0.44%. NASDAQ rose 0.70%. 10-year yield rose 0.004 to 4.122.
Fed’s Miran pushes for aggressive cuts, Bostic and others push back
New Fed Governor Stephen Miran defended his lone call for a 50bps rate cut last week, signaling he would back another such move if given the chance. In a speech overnight, Miran warned that the central bank is underestimating how tight policy is, putting the job market at risk without faster easing.
Miran argued that the appropriate federal funds rate should be in the “mid-2 percent area,” nearly 200 basis points below the current target. He said leaving policy this restrictive risks unnecessary layoffs and higher unemployment, with monetary settings “well into restrictive territory.”
His remarks highlighted the divide inside the FOMC. While Miran sees the economy requiring swift and decisive support, other Fed officials made clear they prefer a slower pace of adjustment.
Atlanta Fed President Raphael Bostic told the Wall Street Journal that inflation remains “too high for a long time” and warned against signaling premature victory. He flatly opposed another cut at the October meeting, indicating that "I today would not be...in favor of it."
Cleveland Fed President Beth Hammack echoed caution, saying the policy rate is only a "short distance to neutral". She warned that removing too much restriction could "start overheating again", urging the Fed to tread carefully, and "stay restrictive to bring inflation back down to target."
St. Louis Fed President Alberto Musalem said he backed last week’s 25bps cut as a "precautionary" measure to support employment but stressed there is only “limited room for easing further” without risking an overly accommodative stance.
Australia PMI composite hits three-month low at 52.1, confidence slumps
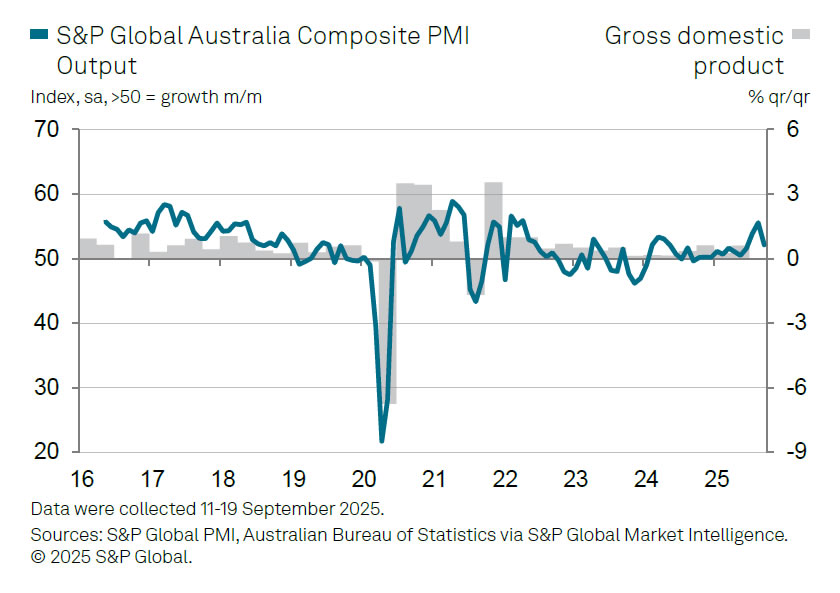
Australia’s private sector momentum slowed sharply in September, with PMI Composite falling from 55.5 to 52.1, its lowest in three months. Manufacturing eased from 53.0 to 51.6, while services slipped more heavily from 55.8 to 52.0, signaling a broad moderation in activity.
S&P Global’s Jingyi Pan noted that new business growth weakened after two strong months, with manufacturing orders slipping back into contraction as U.S. tariffs began to weigh. Export orders also faltered, while overall business confidence dropped to its lowest in a year, hinting at a softer growth outlook into Q4.
The survey did show resilience in employment, with job creation little changed from August. However, selling price inflation remained "at a level that was above the long-run average", and a steep rise in manufacturing cost inflation underscored margin pressures for goods producers.
Gold’s record surge sets sights on 4000; Silver pushes toward 50
Gold and Silver extended their relentless rallies this week, with the former printing fresh record highs and the latter touching its strongest levels since 2011. The moves came despite a rebound in Dollar, highlighting the resilience of demand for safe-haven and strategic asset allocations. Gold is eyeing 4000 level, while Silver is pushing toward 50 mark, both psychologically and technically significant.
Extended inflows from central banks, sovereign wealth funds, and institutional investors remain at the core of the rally. The World Gold Council’s 2025 Central Bank Gold Reserves Survey, released in June, showed that 95% of central bankers expect global reserves to rise this year, with none forecasting a decline. Heightened geopolitical risk is the primary driver, while diversification away from Dollar continues to add impetus.
Silver’s fundamentals have reinforced its performance too. Tight supply conditions have helped maintain upward momentum, while structural demand from solar energy, electric vehicles, and electronics has added another source of resilience. Together, these factors explain why Silver has outpaced Gold in recent weeks.
Technically, there are various interpretations on the price actions since last record high at 3499.79. But in most cases, current up-leg should have started from 3267.90. For now, near term outlook will stay bullish as long as 3627.76 support holds. Next target is 61.8% projection of 2584.24 to 3499.79 from 3267.90 at 3833.70.
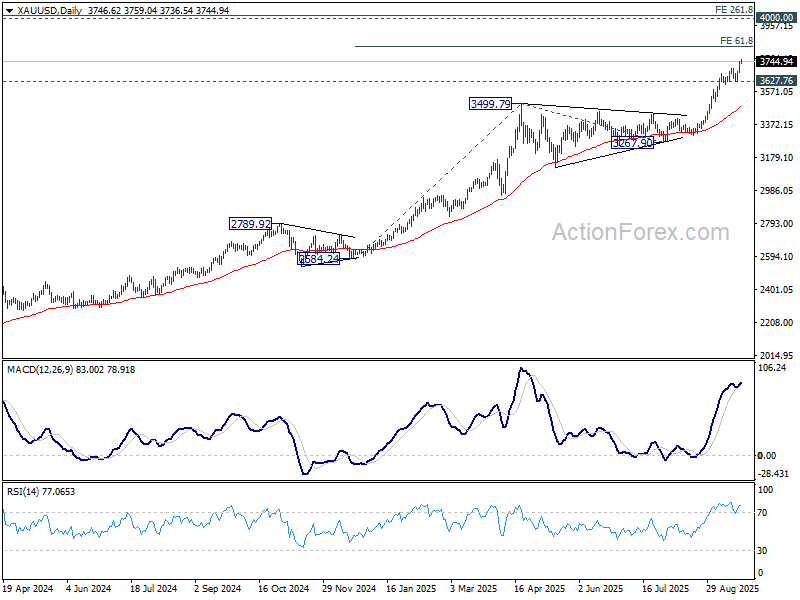
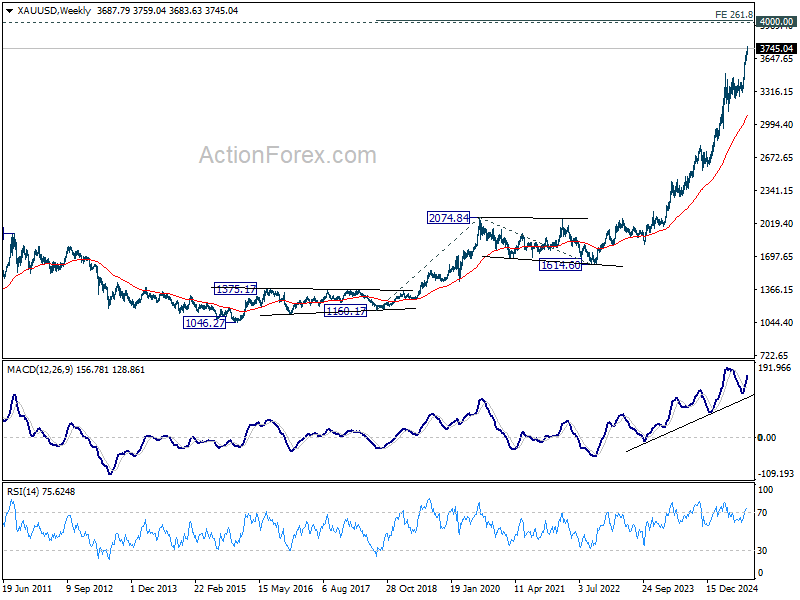
The longer-term picture for Gold is more compelling. The uptrend from 1046.27 (2015 low) is still in acceleration phase. Current rise from 1614.60 is seen as the fifth leg of the rally, targeting 261.8% projection of 1160.17 to 2074.84 from 1614.60 at 4009.20.
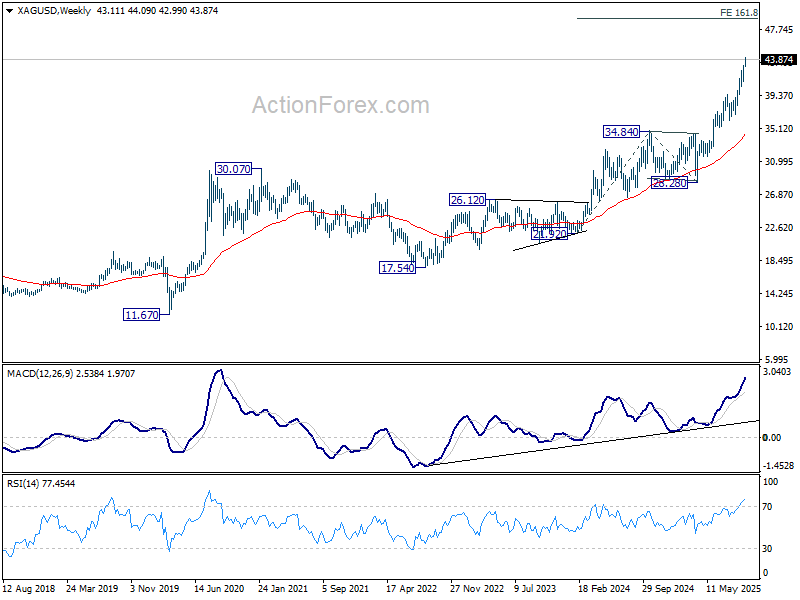
As for Silver, 61.8% projection of 28.28 to 39.49 from 36.93 at 43.85 target is already met and momentum stays strong as seen in D MACD. Outlook will remain bullish as long as 41.09 support holds even in case of retreat. Sustained trading above 43.85 will pave the way to 100% projection at 48.14.
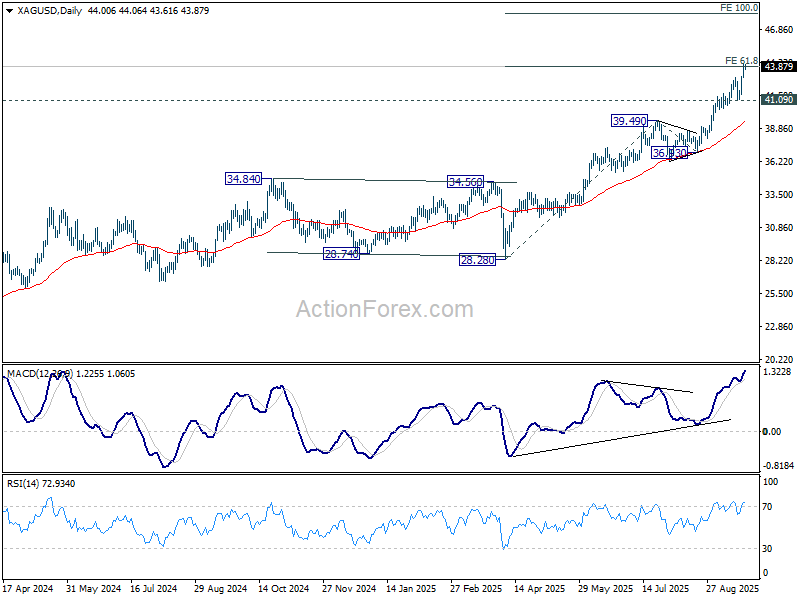
More importantly, as the fifth wave of the rise from 17.54 (2022 low), Silver is on track to 161.8% projection of 21.92 to 34.84 from 28.28 at 49.18 too.
EUR/AUD Daily Outlook
Daily Pivots: (S1) 1.7812; (P) 1.7850; (R1) 1.7916; More...
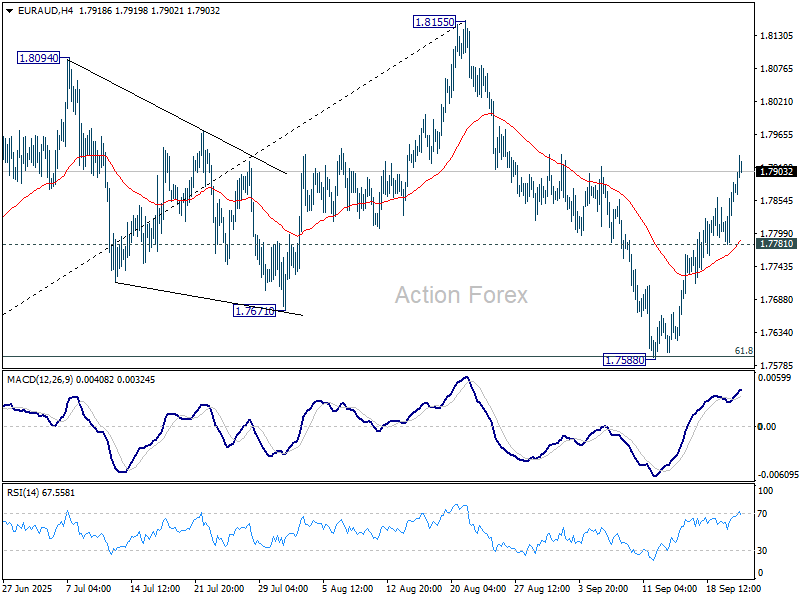
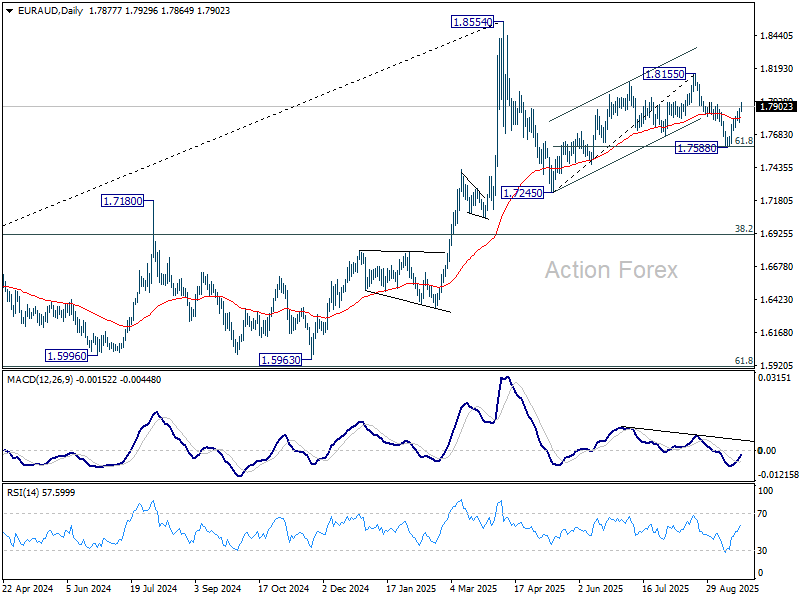
EUR/AUD's rally from 1.7588 continues today and intraday bias stays on the upside. Further rally should be seen to retest 1.8155 resistance next. Firm break there will resume the whole rise from 1.7245. On the downside, below 1.7781 minor support will turn intraday bias neutral first.
In the bigger picture, price actions from 1.8554 medium term top are seen as a corrective pattern. Deeper fall could be seen as the pattern extends, but downside should be contained by 38.2% retracement of 1.4281 (2022 low) to 1.8554 at 1.6922 to bring rebound. Uptrend from 1.4281 is expected to resume at a later stage.
Gold’s record surge sets sights on 4000; Silver pushes toward 50
Gold and Silver extended their relentless rallies this week, with the former printing fresh record highs and the latter touching its strongest levels since 2011. The moves came despite a rebound in Dollar, highlighting the resilience of demand for safe-haven and strategic asset allocations. Gold is eyeing 4000 level, while Silver is pushing toward 50 mark, both psychologically and technically significant.
Extended inflows from central banks, sovereign wealth funds, and institutional investors remain at the core of the rally. The World Gold Council’s 2025 Central Bank Gold Reserves Survey, released in June, showed that 95% of central bankers expect global reserves to rise this year, with none forecasting a decline. Heightened geopolitical risk is the primary driver, while diversification away from Dollar continues to add impetus.
Silver’s fundamentals have reinforced its performance too. Tight supply conditions have helped maintain upward momentum, while structural demand from solar energy, electric vehicles, and electronics has added another source of resilience. Together, these factors explain why Silver has outpaced Gold in recent weeks.
Technically, there are various interpretations on the price actions since last record high at 3499.79. But in most cases, current up-leg should have started from 3267.90. For now, near term outlook will stay bullish as long as 3627.76 support holds. Next target is 61.8% projection of 2584.24 to 3499.79 from 3267.90 at 3833.70.
The longer-term picture for Gold is more compelling. The uptrend from 1046.27 (2015 low) is still in acceleration phase. Current rise from 1614.60 is seen as the fifth leg of the rally, targeting 261.8% projection of 1160.17 to 2074.84 from 1614.60 at 4009.20.
As for Silver, 61.8% projection of 28.28 to 39.49 from 36.93 at 43.85 target is already met and momentum stays strong as seen in D MACD. Outlook will remain bullish as long as 41.09 support holds even in case of retreat. Sustained trading above 43.85 will pave the way to 100% projection at 48.14.
More importantly, as the fifth wave of the rise from 17.54 (2022 low), Silver is on track to 161.8% projection of 21.92 to 34.84 from 28.28 at 49.18 too.
Australia PMI composite hits three-month low at 52.1, confidence slumps
Australia’s private sector momentum slowed sharply in September, with PMI Composite falling from 55.5 to 52.1, its lowest in three months. Manufacturing eased from 53.0 to 51.6, while services slipped more heavily from 55.8 to 52.0, signaling a broad moderation in activity.
S&P Global’s Jingyi Pan noted that new business growth weakened after two strong months, with manufacturing orders slipping back into contraction as U.S. tariffs began to weigh. Export orders also faltered, while overall business confidence dropped to its lowest in a year, hinting at a softer growth outlook into Q4.
The survey did show resilience in employment, with job creation little changed from August. However, selling price inflation remained "at a level that was above the long-run average", and a steep rise in manufacturing cost inflation underscored margin pressures for goods producers.
Bitcoin Retreats – Market Fears More Pain If Key Level Fails
Key Highlights
- Bitcoin started a fresh decline from the $118,000 region.
- BTC/USD traded below a major bullish trend line with support at $115,800 on the 4-hour chart.
- Ethereum also trimmed some gains and tested $4,050.
- XRP price struggled above $3.120 and settled below $3.00.
Bitcoin Price Technical Analysis
Bitcoin price failed to extend gains above $118,000 against the US Dollar. BTC reacted to the downside and traded below the $115,000 support.
Looking at the 4-hour chart, the price declined sharply below a major bullish trend line with support at $115,800. There was a clear move below the 50% Fib retracement level of the upward move from the $107,234 swing low to the $117,933 high.
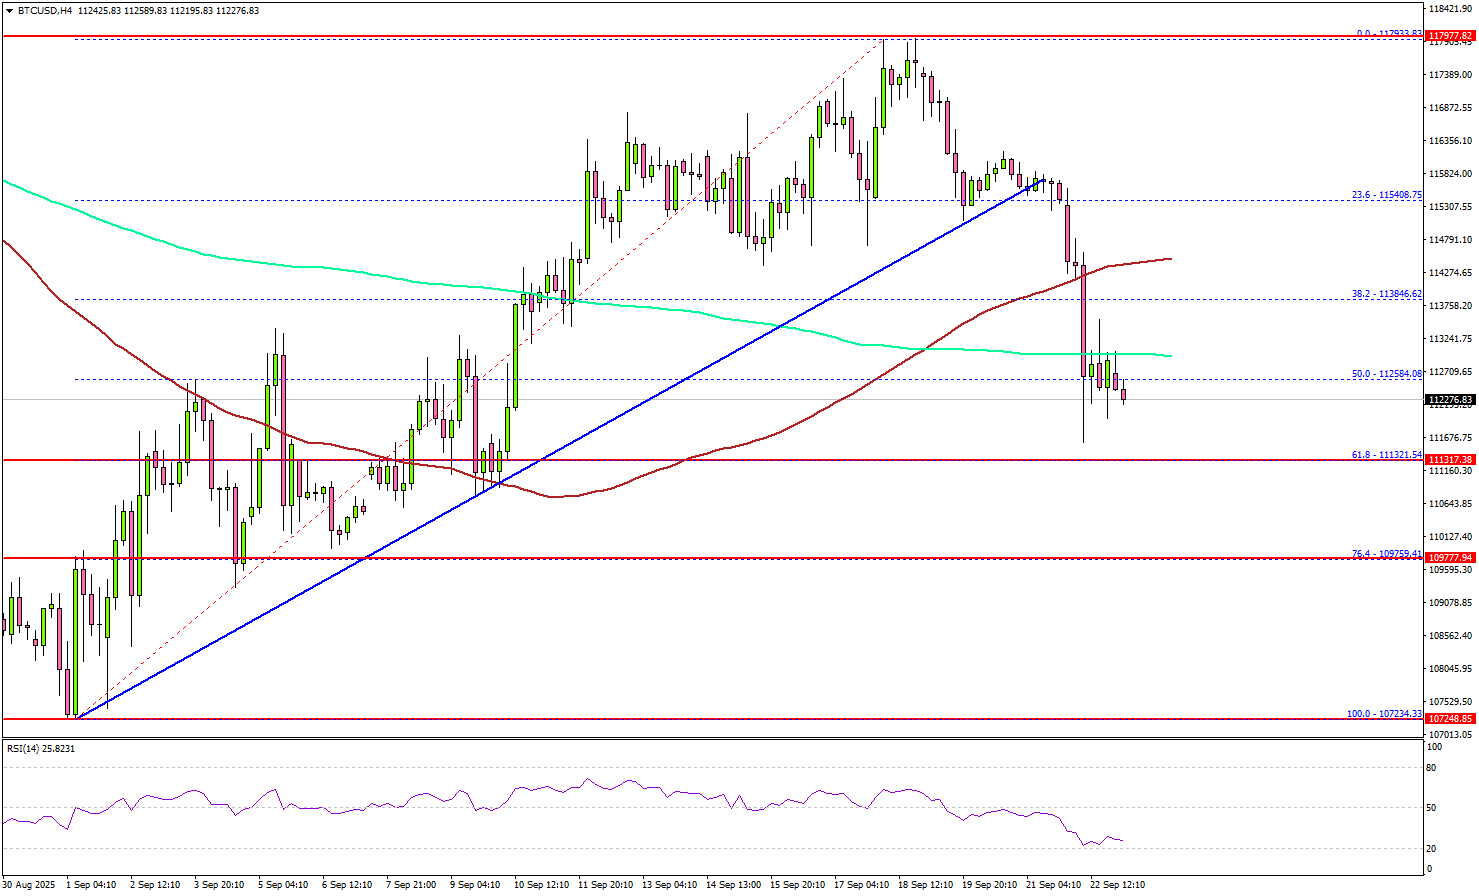
The pair settled below the 100 simple moving average (red, 4-hour) and spiked below the 200 simple moving average (green, 4-hour). Immediate support is $112,000. A downside break below $112,000 might send BTC toward the $110,000 support. Any more losses might send the price toward the $107,500 support zone.
On the upside, the price now faces resistance near the $113,800 level. The main hurdle is now forming near $115,000 and the 100 simple moving average (red, 4-hour).
A successful close above $115,000 might start another steady increase. In the stated case, the price may perhaps rise toward the $116,500 level. Any more gains might call for a test of $118,000.
Looking at Ethereum, the price reacted to the downside below $4,200 and might extend losses toward the $3,880 support.
Today’s Key Economic Releases
- ECB's Nagel speech.
- Fed's Barkin speech.
- Fed's Hammack speech.
- Fed's Miran speech.
- BoE's Governor Bailey speech.
Fed’s Miran pushes for aggressive cuts, Bostic and others push back
New Fed Governor Stephen Miran defended his lone call for a 50bps rate cut last week, signaling he would back another such move if given the chance. In a speech overnight, Miran warned that the central bank is underestimating how tight policy is, putting the job market at risk without faster easing.
Miran argued that the appropriate federal funds rate should be in the “mid-2 percent area,” nearly 200 basis points below the current target. He said leaving policy this restrictive risks unnecessary layoffs and higher unemployment, with monetary settings “well into restrictive territory.”
His remarks highlighted the divide inside the FOMC. While Miran sees the economy requiring swift and decisive support, other Fed officials made clear they prefer a slower pace of adjustment.
Atlanta Fed President Raphael Bostic told the Wall Street Journal that inflation remains “too high for a long time” and warned against signaling premature victory. He flatly opposed another cut at the October meeting, indicating that "I today would not be...in favor of it."
Cleveland Fed President Beth Hammack echoed caution, saying the policy rate is only a "short distance to neutral". She warned that removing too much restriction could "start overheating again", urging the Fed to tread carefully, and "stay restrictive to bring inflation back down to target."
St. Louis Fed President Alberto Musalem said he backed last week’s 25bps cut as a "precautionary" measure to support employment but stressed there is only “limited room for easing further” without risking an overly accommodative stance.
GBPJPY Rejects 200.00 Mark as Sellers Defend the Range
GBPJPY is one of the most volatile FX pair available to trade including only major currencies – Yet, it's been stuck in a huge range since August 2024.
As explained in our previous article on this currency pair, a continuous uptrend from 2020 lows (127.30!) to July 2024 highs (208.12) has been met with a sharp correction as carry trades saw a consequent slowdown amid a sudden market-breakdown which suddenly saw yen rebuying speed up.
At the same time, equities saw a huge correction, which got followed with the usual dip-buying.
Anyways, this time, a consistent shorter-range uptrend has built up momentum from April lows (184.50) to the higher bound of the year-long consolidation.
With buyers stepping in after a August retracement, a consequent bull-sequence took the pair to a wick at new yearly highs (201.27).
Let's have a look at multi-timeframe charts to spot levels of interest and see if the most recent rejection below 200.00 can hold further or a breakout is due.
GBPJPY multi-timeframe analysis
GBPJPY daily timeframe
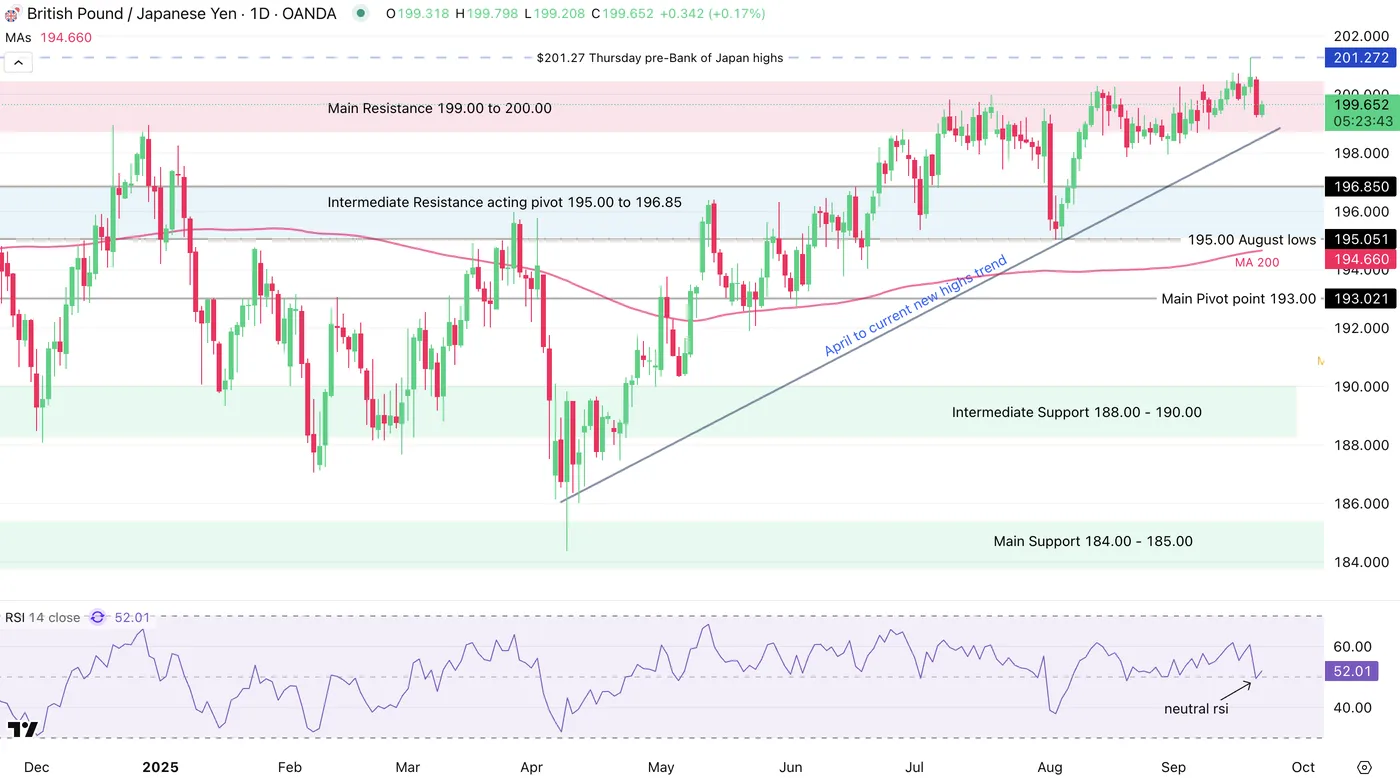
GBPJPY Daily Chart, September 22, 2025 – Source: TradingView
Markets have built towards higher levels in the pair throughout the past 5 months as weak fundamentals haven't helped the Yen to find consequent buying.
However, some hawkishness as been denoted in last week's Bank of Japan meeting and as the Bank of England just cut its rate to 4% at its last meeting, rates between Japan and the UK are still expected to converge through time.
The rest is for markets to spot when the BoJ will actually hike which should provide a further boost to the yen – a sign for sellers to step in further.
But markets react to such noise initially before being more patient and waiting for the actual news to drop – There is a bit less of a hike priced in the Japanese short-end curve for the rest of the year.
But increased hawkish talk may assist the selling in the pair and needs to be tracked closely, particularly after the most recent failed bullish-breakout.
GBPJPY 4H chart and levels
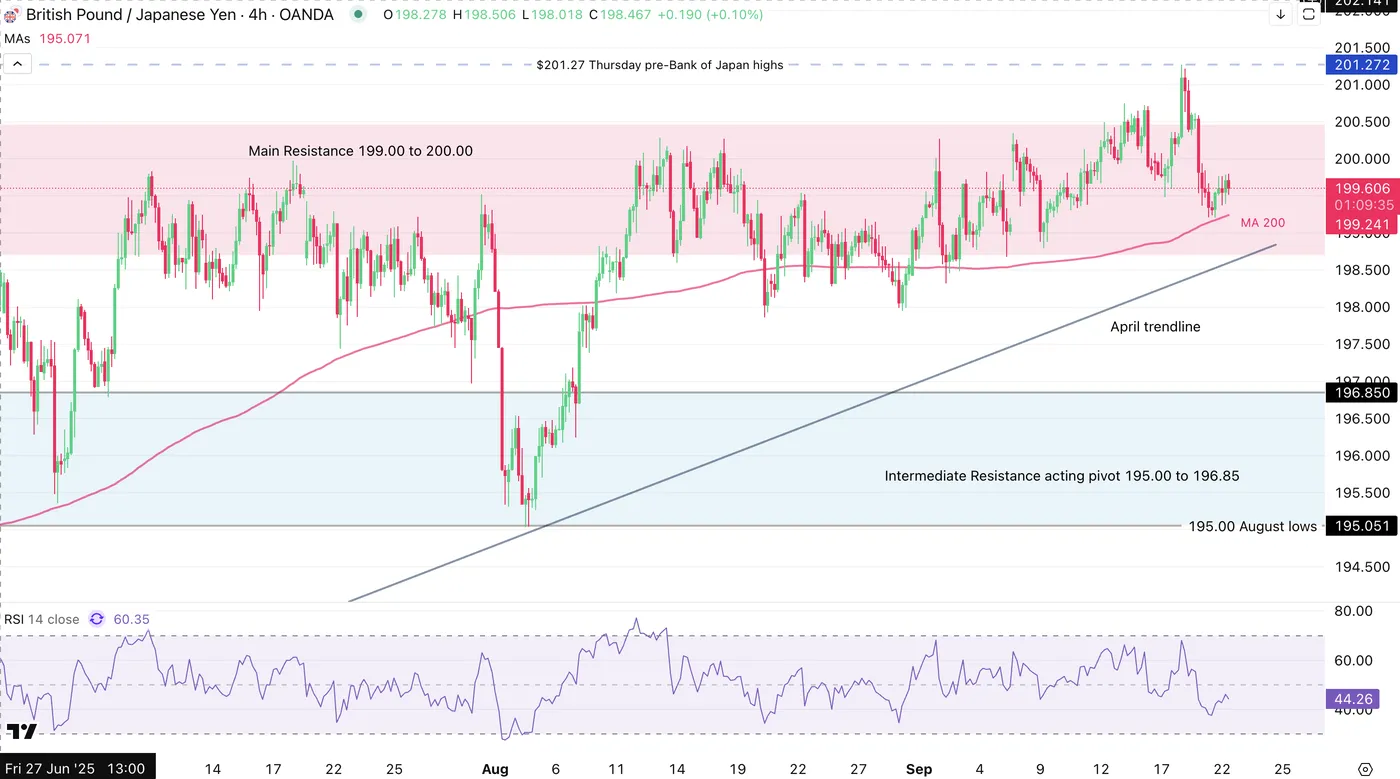
GBPJPY 4H Chart, September 22, 2025 – Source: TradingView
As can be observed on this 4H chart, the V-shaped return to the 199.00 to 200.00 resistance has built a consolidation level just above the 200-period MA which now serves as immediate momentum level for future action.
A break below should accelerate selling towards the April trendline, and further downside could be expected below (towards a retest of the August 5th lows).
A failure to break the low of the resistance should amplify the consolidation further – Keep a close eye on the 4H 200-period MA.
Levels to watch for GBPJPY trading:
Support Levels:
- Low of 199.00 to 200.00 resistance (198.70)
- Intermediate Range Resistance Zone turned pivot near 195.00 to 196.85
- Higher timeframe Main Pivot point 193.00
- Range Intermediate Support Zone around the 190.00 level
Resistance Levels:
- Resistance Zone extremes 199.00 to 200.00
- 201.27 Bank of England and pre-Bank of Japan highs
- 208.120 July 2024 highs
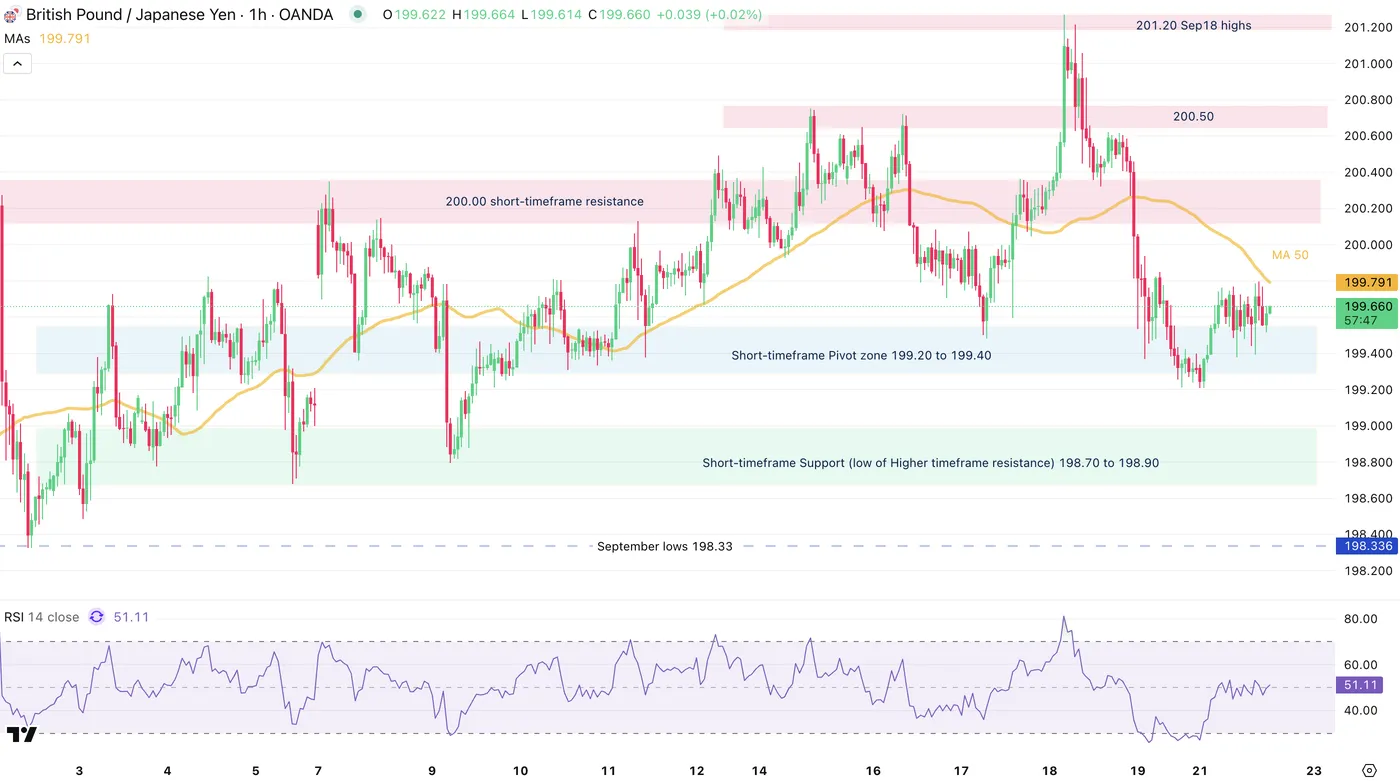
GBPJPY 1H Chart, September 22, 2025 – Source: TradingView
Bulls and bears are battling within the resistance of the range.
The 50-hour Moving average may act as immediate resistance but will only see confirmation if momentum breaches the pivot zone.
Not closing below the pivot on the daily would imply further consolidation within the range.
Safe Trades and Shana Tovah for those who celebrate!
EURNZD Wave Analysis
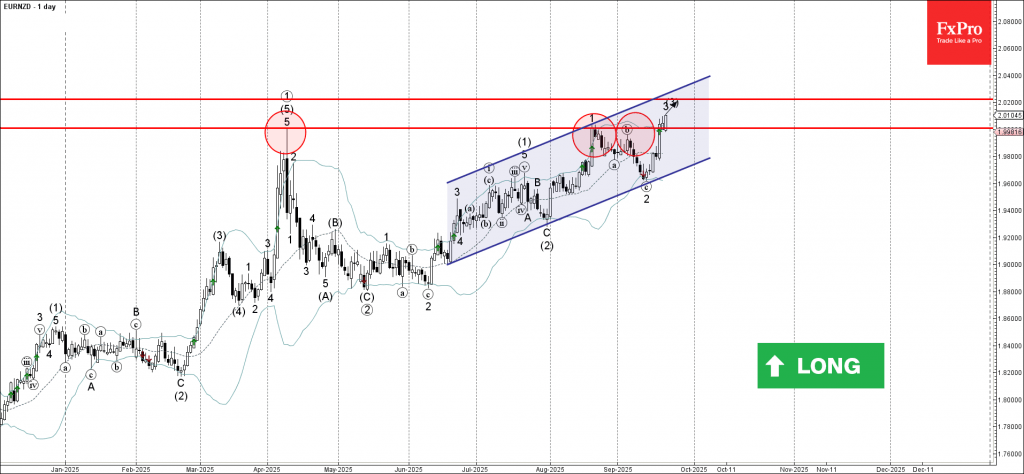
EURNZD: ⬆️ Buy
- EURNZD broke key resistance level 2.0010
- Likely to rise to resistance level 2.0200
EURNZD currency pair recently broke above the key resistance level 2.0010 (which has been reversing the price from the start of April).
The breakout of the resistance level 2.0010 continues the active impulse waves 3 and (3) – which belong to the long-term upward impulse sequence 3 from May.
Given the clear daily uptrend, EURNZD currency pair can be expected to rise to the next resistance level 2.0200 (target price for the completion of the active impulse wave 3).
EURAUD Wave Analysis
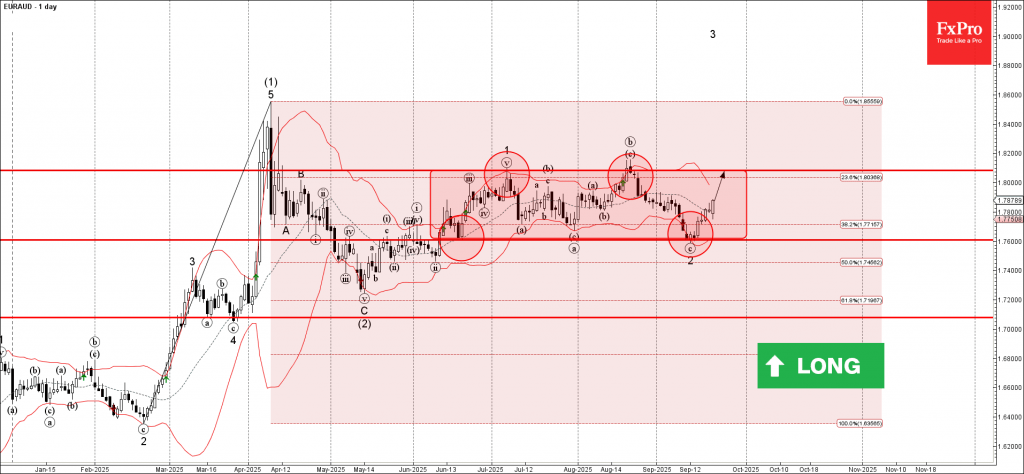
EURAUD: ⬆️ Buy
- EURAUD reversed from support zone
- Likely to rise to resistance level 1.8085
EURAUD currency pair recently reversed up from the support zone between the support level 1.7600 (lower border of the sideways price range from June) and the lower daily Bollinger Band.
The support level 1.7600 was further strengthened by the 38.2% Fibonacci correction of the sharp upward impulse from February.
Given the bullish euro sentiment seen today, EURAUD currency pair can be expected to rise to the next resistance level 1.8085 (upper border of the active sideways price range).
Gold Wave Analysis
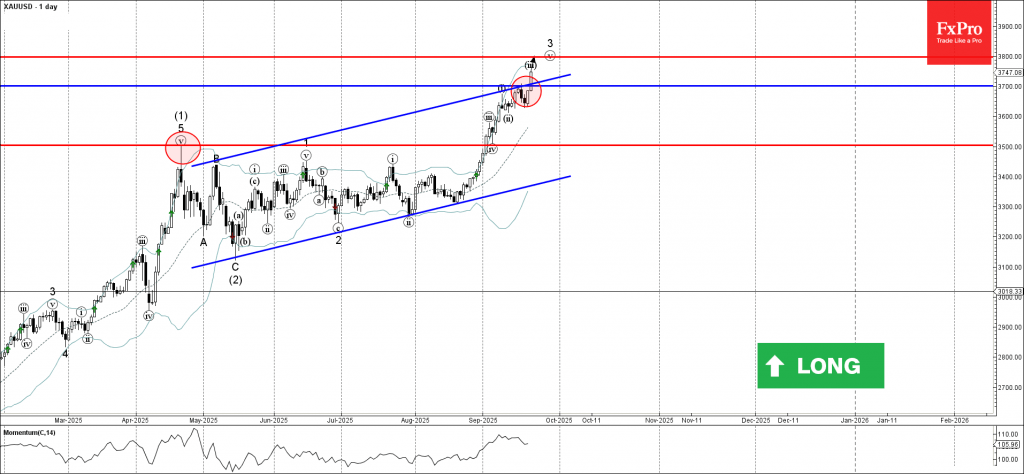
Gold: ⬆️ Buy
- Gold broke resistance zone
- Likely to rise to resistance level 3800.00
Gold recently broke the resistance zone between the resistance level 3700.00 and the resistance trendline of the daily up channel from April.
The breakout of this resistance zone accelerated the active impulse wave v of the impulse wave 3 from the end of June.
Given the strong daily uptrend, Gold can be expected to rise to the next resistance level 3800.00 (target price for the completion of the active impulse wave 3).
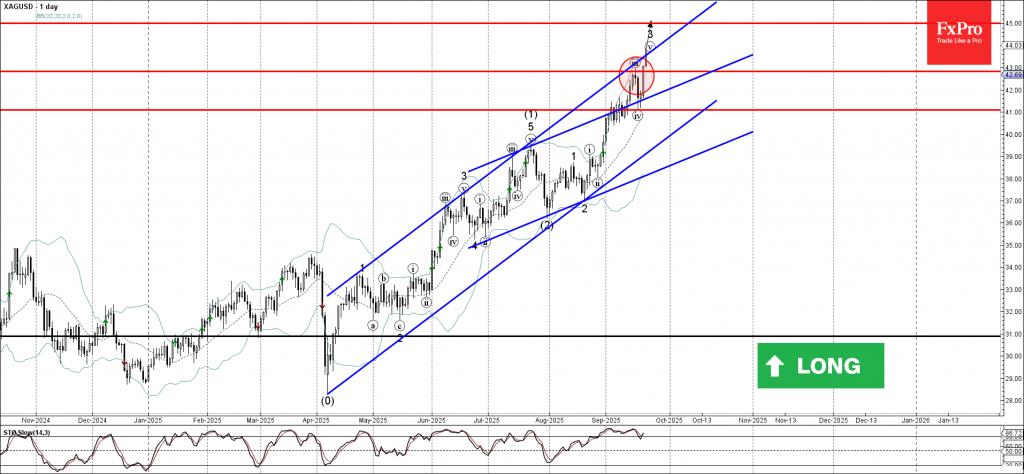
Silver Wave Analysis
Silver: ⬆️ Buy
- Silver reversed from support zone
- Likely to rise to resistance level 45.00
Silver recently reversed from the support zone between the support level 41.00 and the upper trendline of the recently broken up channel from June (acting as the support after it was broken at the start of September).
The upward reversal from this support zone created the daily Japanese candlesticks reversal pattern Morning Star – which started the active impulse wave v.
Given the clear daily uptrend, Silver can be expected to rise to the next resistance level 45.00 (target price for the completion of the active impulse wave v).