
Sample Category Title
Markets Weekly Outlook: July PMI Week, NZ Inflation and ECB’s Rate Decision
Week in review: Cryptos on top and Decent US Data
It’s been a roller‑coaster week—between volatile macro data, tariff threats, and fresh geopolitical turmoil, all jostling with record‑breaking crypto moves.
US inflation data eased a touch as CPI (core at 0.2% vs 0.3% exp) and PPI (unchanged, 0.2% consensus) both came in cooler than expected, while Retail Sales surprised to the upside, showing consumer demand still holding firm.
Equities briefly hit new highs—the S&P 500 and Nasdaq 100 climbed on solid earnings reports—but traders have been taking profits in today's session. Both indices still finish the week up comfortably, except for the Dow which has really been mixed in rangebound action throughout the week.
Lower-than-expected (yet still high) inflation expectations did not do much to slow today’s selling flows.
Global Equities have also been dawdling round in the first half of July as the sudden rise in the US Dollar coming from better than expected US Data has rewired some Financial flows.
Trade tensions resurfaced as Trump floated 15–20 % tariffs on EU goods, a reminder that protectionist rhetoric remains ever‑present even as markets largely shrugged off the threat – Keep this in check for the upcoming weeks.
Meanwhile, crypto stole the spotlight: Bitcoin blasted through to a new peak of $123,230, fuelled by ETF inflows and macro hedge demand, while Ethereum outpaced BTC on the week, riding a wave of DeFi optimism and relative strength. Altcoins have been shining on this newfound Crypto trend.
Elsewhere, Australia’s jobs report was disappointing, intensifying bets on RBA rate cuts, and the UK’s employment data proved a mixed bag—wage growth held up, but unemployment ticked higher.
To cap it off, tensions flared along the Israel‑Syria border around Druze communities, adding a fresh geopolitical twist that quickly faded by Markets who don’t care too much about these headlines since the Israel-Iran tensions from the end of June.
Still, buckle up, as looking at charts and fundamentals, volatility isn’t going anywhere.
The Week ahead: Global PMIs and more inflation data
We will already be entering the fourth week of July and markets have been awaiting for the PMIs to get an idea if anything evolved for the business around the world as tariffs keep looming around.
Asia-Pacific Markets
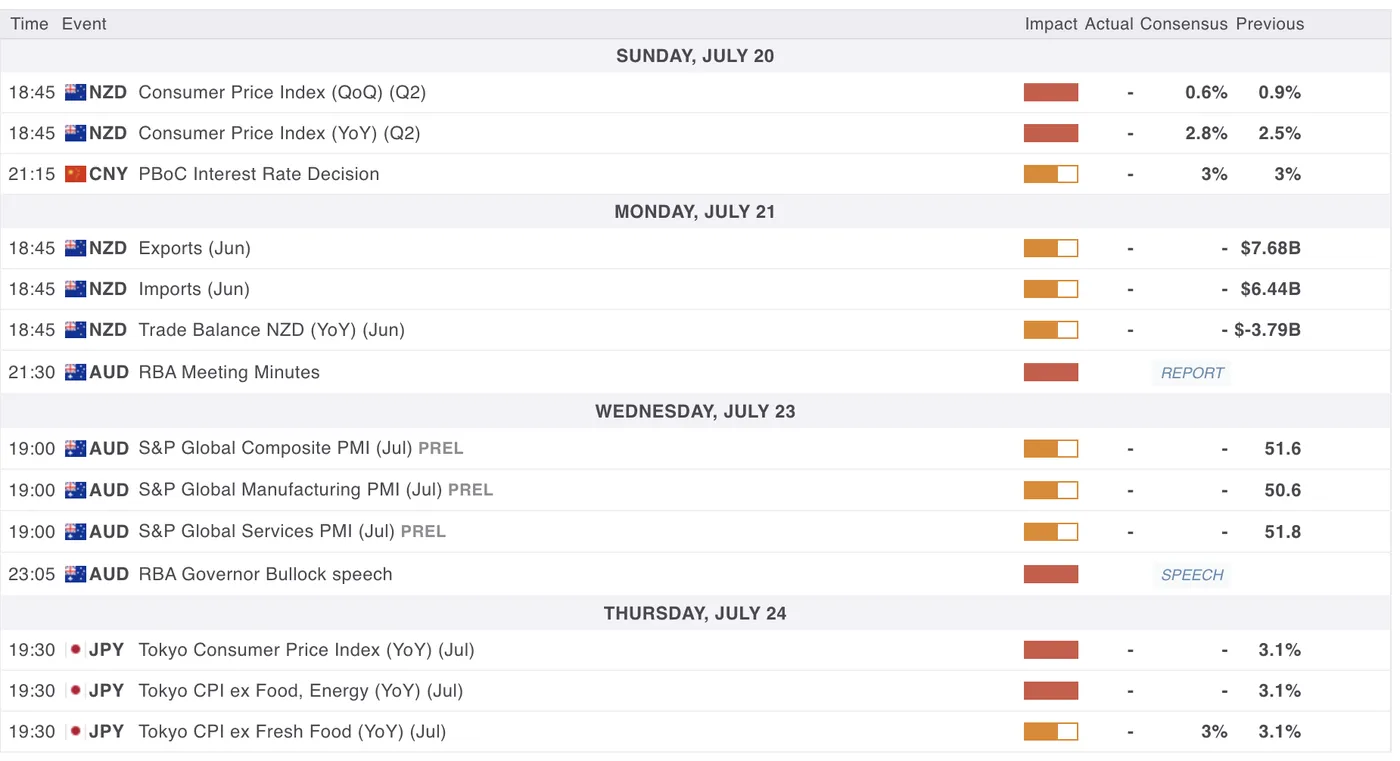
Next week's high-tier Data for Asia-Pacific nations – MarketPulse Economic Calendar
Next week will see bouts of key data particularly for New Zealand and Australia.
The week starts early for NZD traders with the New Zealand inflation (consensus + 0.6%) release on Sunday's overnight session.
The rest is considered slightly lower tier – PBOC Rate Decision, NZD Trade Balance data, Australian PMIs and RBA Minutes and finally on Thursday, Tokyo region's Regional CPI for JPY Traders.
Asian stock markets (Singapore and Hong Kong) have been performing well on good Chinese data with the latest round of financial injection from the PBOC through Reverse Repo Ops (1 Trillion Yuan).
Economic Data from Europe, UK and North America - ECB Rate Decision
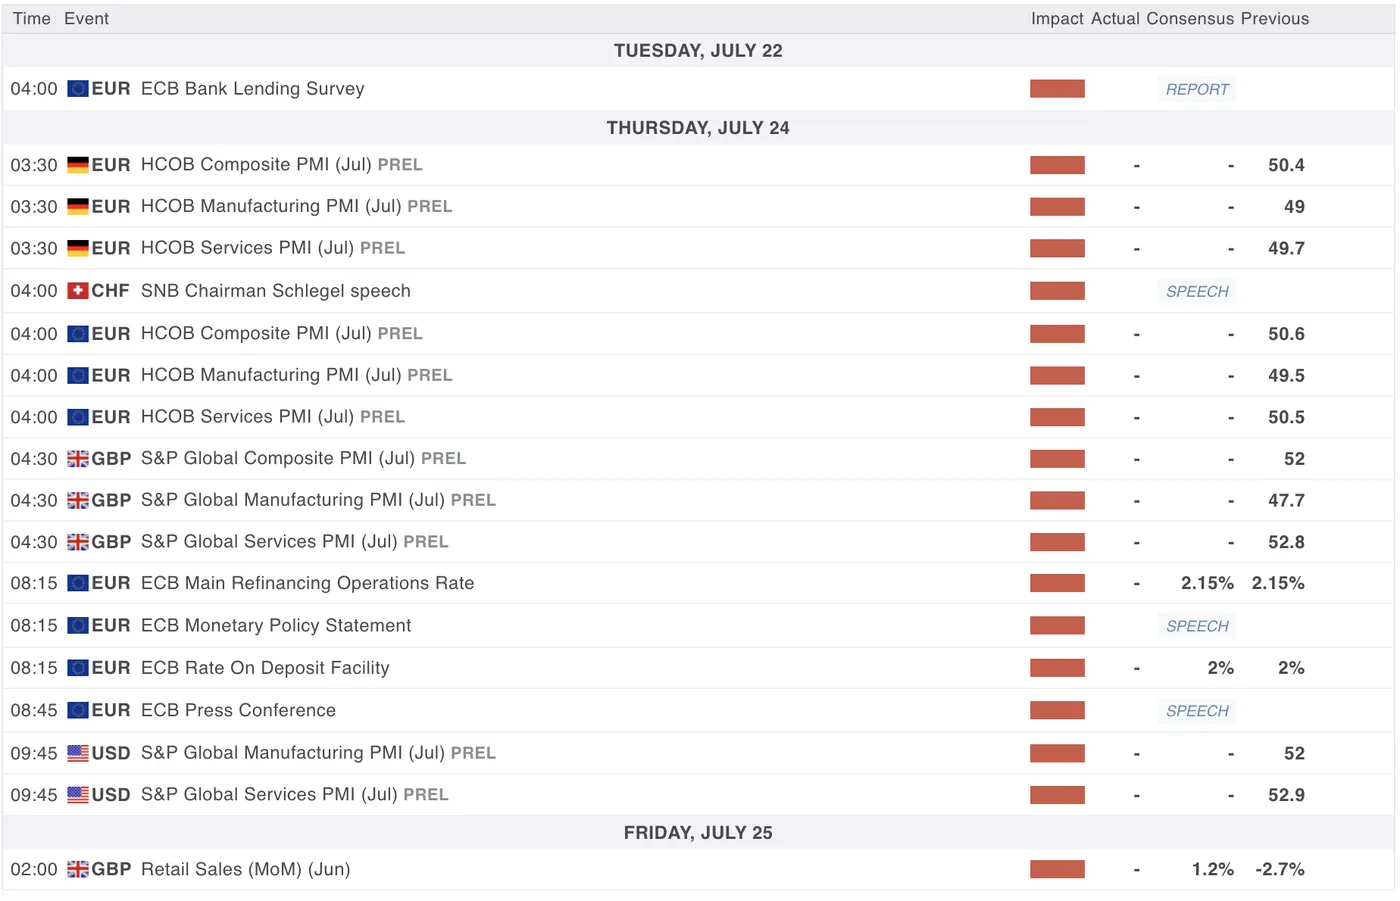
Next week's high-tier Data for Europe and North-American nations – MarketPulse Economic Calendar
Next week might be a bit heavier on occidental Data releases with a slow start to the week (more action towards the middle of the week).
The week will start with mid-tier Business Outlook Surveys for Canada (typically interesting reports to get to know more what businesses are expecting for inflation etc).
We will also get Retail Sales for Canada (exp -1.1%) on Wednesday and the UK (exp 1.2%) on Friday.
European data will be heavy with ECB's Bank Lending Survey (published once every 4 years), Eurozone, UK and German PMIs & finally, ECB's Rate Decision on Thursday 24 (pause largely expected) – (8:45).
Don't forget the main US Data release of the week – US Global Manufacturing and Services PMIs also on Thursday (9:45).
US Dollar performance versus other Forex Major counterparts
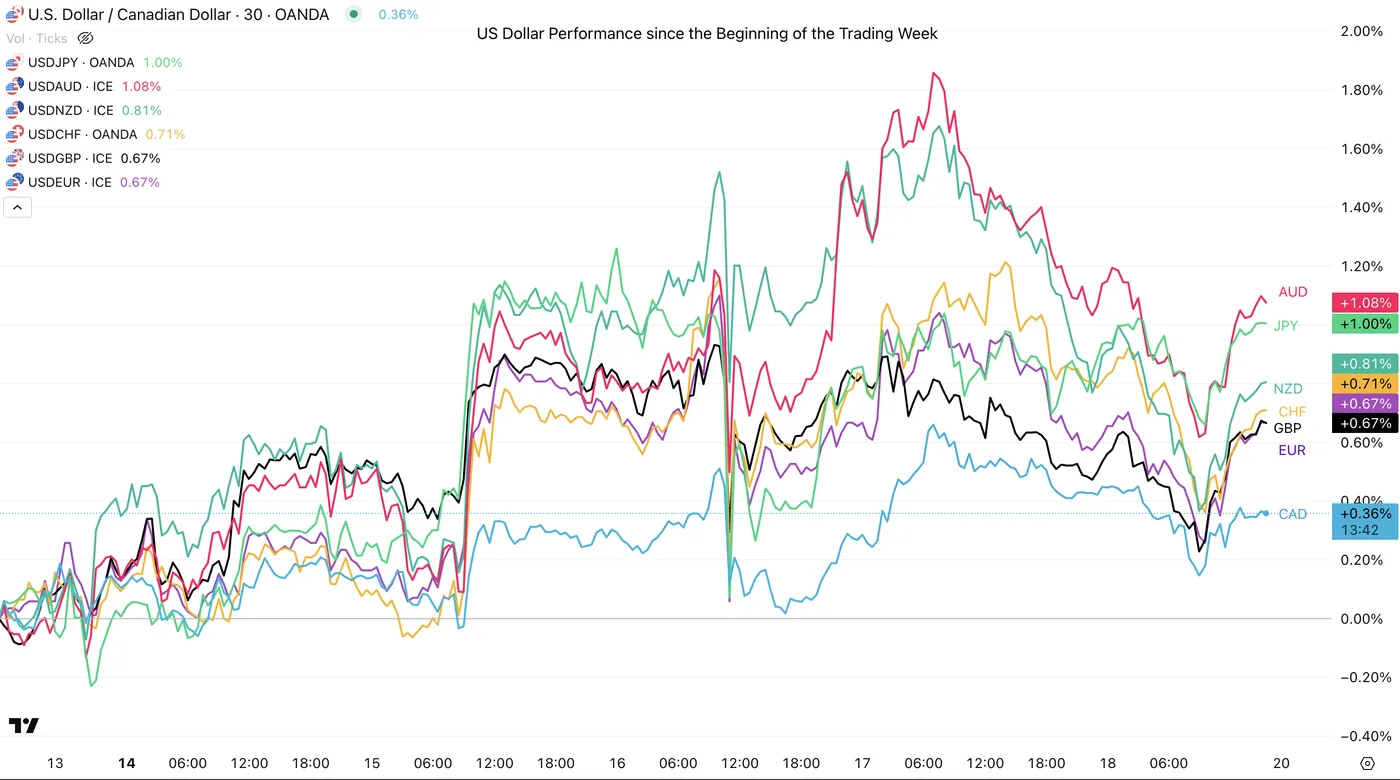
US Dollar Performance since the Beginning of the Trading Week, July 18, 2025 – Source: TradingView
The US Dollar kept rallying against other currencies throughout the week, particularly after the CPI Report which preceded a major rally with the DXY touching 98.90.
The AUD got sold off particularly strongly and the JPY got dumped again with USDJPY attaining the extremes of its range.
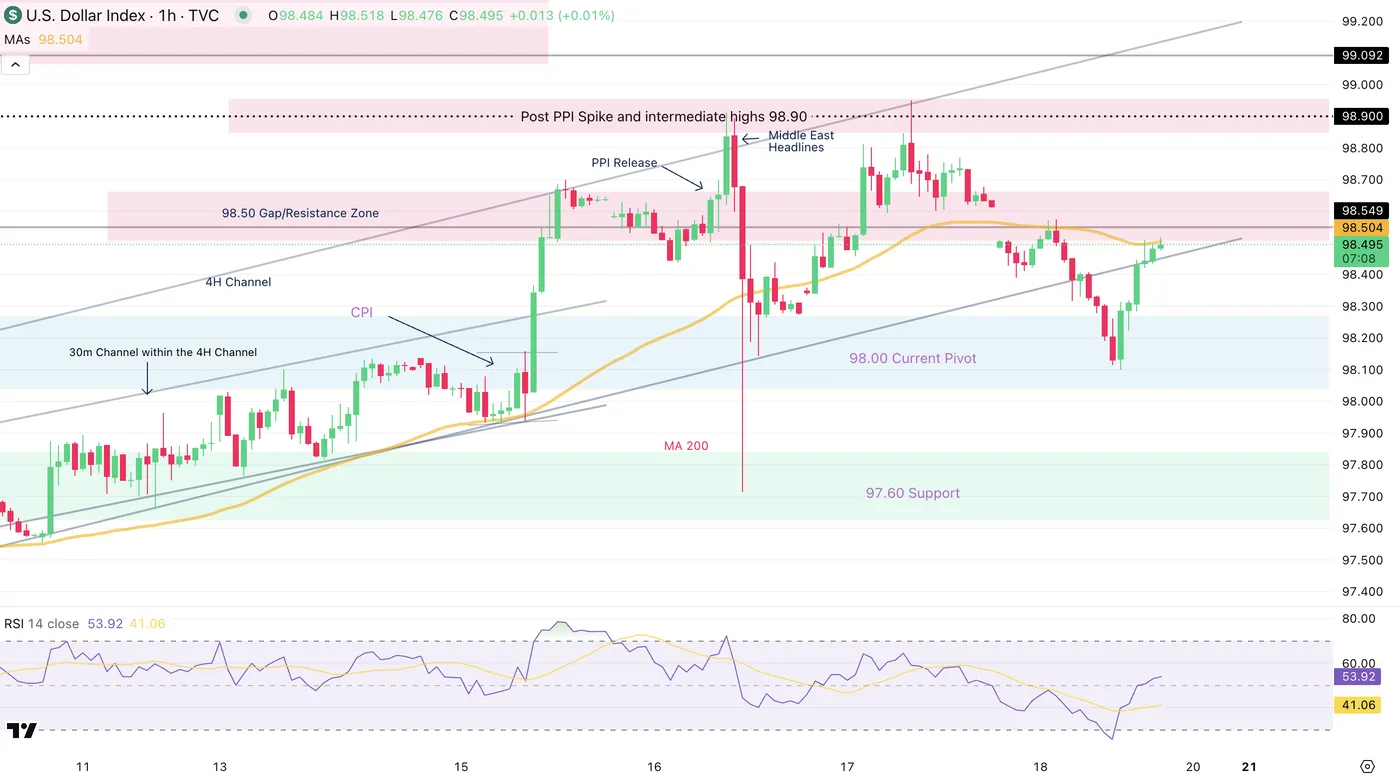
Dollar Index 1H Chart, July 18, 2025 – Source: TradingView
Despite a rebound today, the price action looks a bit inconclusively bearish – Let's see what might happen next week (Expect an in-depth analysis beginning next week)
Weekly Asset Performance
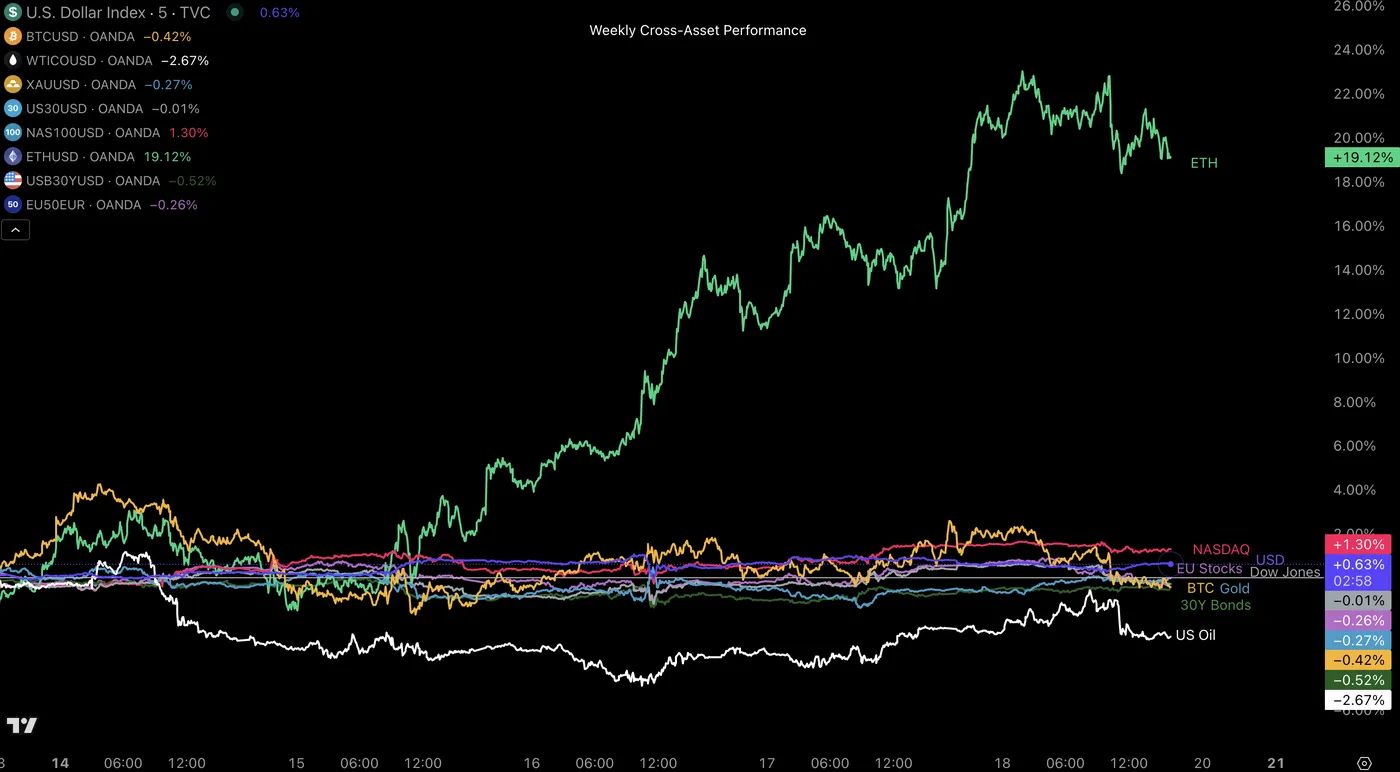
Cross-Asset Weekly Performance, July 18, 2025 – Source: TradingView
Ethereum's uprise had been warranted from its consistent rise in the past few weeks.
For the rest, despite volatile swings the weekly performance is close to unchanged for most assets, except for Oil which lost some ground (Rangebound action).
Stock indices have started to slow down a bit, so we'll need to track sentiment closely in the upcoming sessions.
Safe Trades and Good Weekend to you all!
The Weekly Bottom Line: The Price of Trade
Canadian Highlights
- Headline inflation drifted higher in June, while core inflation measures remained sticky and elevated.
- Canadian home sales gained for a third consecutive month, but price growth continued to moderate. Housing starts capped the second quarter with a record gain.
- The recent data is likely to push the Bank of Canada to the sidelines at their next meeting. We don’t expect further rate easing until later this year.
U.S. Highlights
- Economic data released this week was mixed overall, as June retail sales painted a resilient picture of U.S. consumers despite trade uncertainty.
- However, June inflation data was more troubling, as preliminary impacts of tariffs likely helped to push core goods price gains to a two-year high.
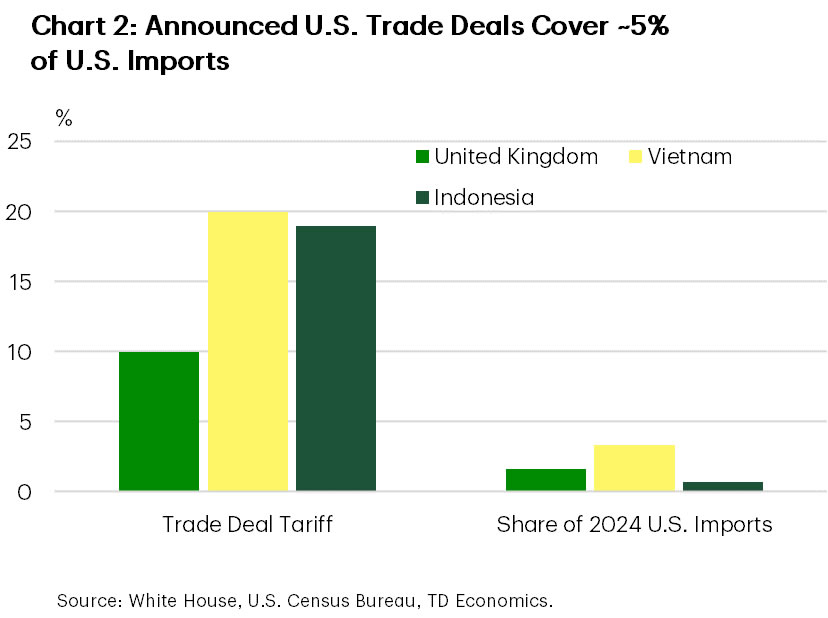
- President Trump also announced a trade deal with Indonesia, marking the third deal reached since ‘Liberation Day’.
Canada – Summer Heat Hasn’t Melted Inflation
This week, we received the second of two inflation reports that the Bank of Canada (BoC) will use to guide their next policy decision on July 30th. For the month of June, headline prices moved two ticks higher to 1.9% year-on-year (y/y), in line with market expectations. Core goods drove a majority of the upward move, as prices for components such as motor vehicles, household furniture, and apparel firmed up. Despite the increase, top-line price growth over the past several months has been tamped down below 2% thanks in part to the end of the consumer carbon tax, something we expect to linger in the coming months.
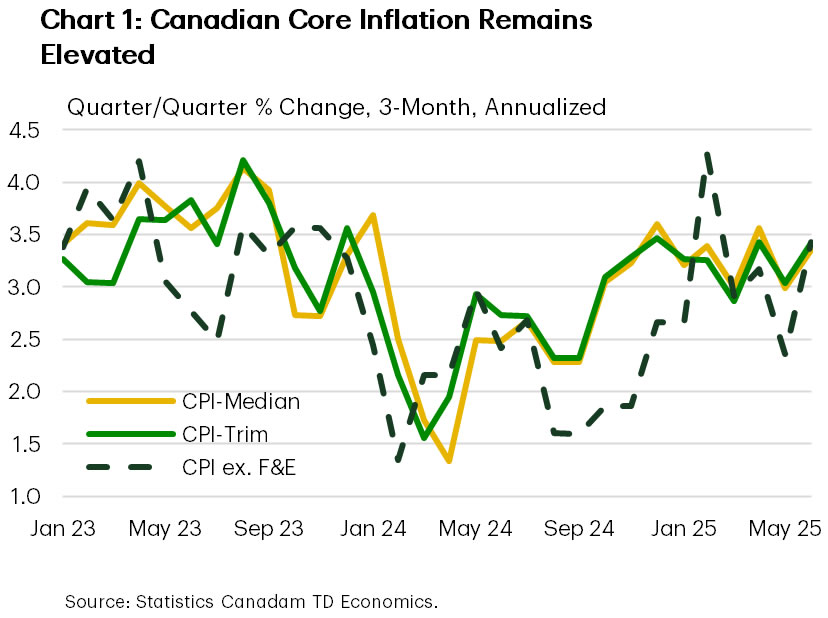
However, underlying price pressures, or core inflation, have been the thorn in the side of the BoC. The Bank’s preferred core measures (CPI-trim and CPI-median) and the traditional core measure (ex-food and energy) all moved higher to 3.4% on a three-month annualized basis (Chart 1), reversing much of last month’s move lower. Our view remains that a softening economic growth backdrop over the next two quarters should help keep a lid on further core inflationary pressure.
June’s warm inflation print was complimented by encouraging news for the Canadian housing market. Home sales advanced for a third consecutive month in June, and housing starts remained robust. However, home prices fell modestly, showing buyers still have bargaining power. We expect home sales will continue to rise in the second half of the year as pent-up demand continues to trickle into the market, though elevated uncertainty may leave sales levels subdued.
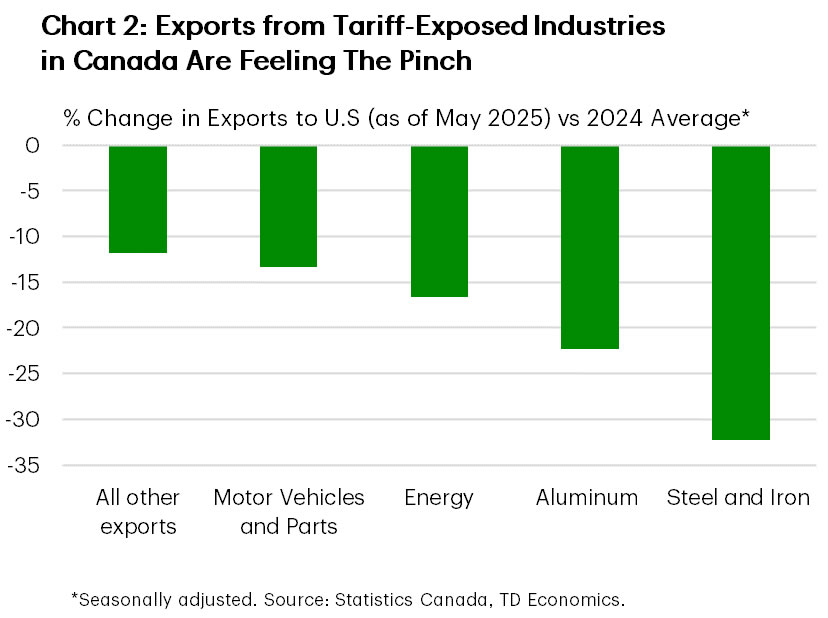
Based on the recent data, including last week’s robust employment numbers, we can make two conclusions. First, tariff-exposed industries are showing the effects of U.S. tariffs in their export and jobs data (Chart 2), while business and consumer confidence measures have also taken a hit. Second, is that when taken altogether, Canada’s economy is holding up better so far than most have feared. For this reason, the BoC will almost certainly remain on pause later this month. Markets have nearly wiped the probability of a July cut off the table after pricing a near coin flip just a few weeks ago.
This doesn’t mean Canada’s economy is out of the woods, it just means the BoC has been afforded more time to assess cost pressures and the overall economic impacts of the trade war. We are now dealing with a new wave of uncertainty, not least from Trump’s recent threat to raise Canadian tariffs as high as 35% by next month. Prime Minister Carney also appears to be embracing what could be the “new-normal”, acknowledging that a forthcoming trade deal will likely have tariffs included. Absent a clean and quick resolution on trade, which seems unlikely at this juncture, the economic backdrop faces downside risk and should give the BoC space to deliver more easing later this year.
U.S. – The Price of Trade
Tipping into the second half of July, we received a couple of key readings on the U.S. economy. On a positive note, retail sales in June were stronger than expected. However, we also received June’s inflation report which indicated that tariff price pressures were beginning to show up more materially in the economy. On that front, President Trump announced a third trade deal this week, while also stating that most nations would face a 10-15% reciprocal tariff rate. As of the time of writing, the S&P 500 was up 0.8% on the week, while U.S. Treasury yields were little changed.
U.S. consumer trends remained solid in June, with retail sales rising across most major product categories. Excluding the more volatile product categories, retail sales had its strongest gain in three months. This came at a time when tariff uncertainty was assumed to be fading, equity markets recovered their recent losses and consumer confidence was recovering gradually. However, these trends have since stalled in July amid renewed trade tensions, particularly in relation to the news last weekend that some of the largest U.S. trading partners will be assigned tariff rates on the higher end of the spectrum (Canada, Mexico, & E.U. all 30+%). Looking to the second half of the year, we expect consumer spending to cool as the impact of tariffs on consumer prices grows.
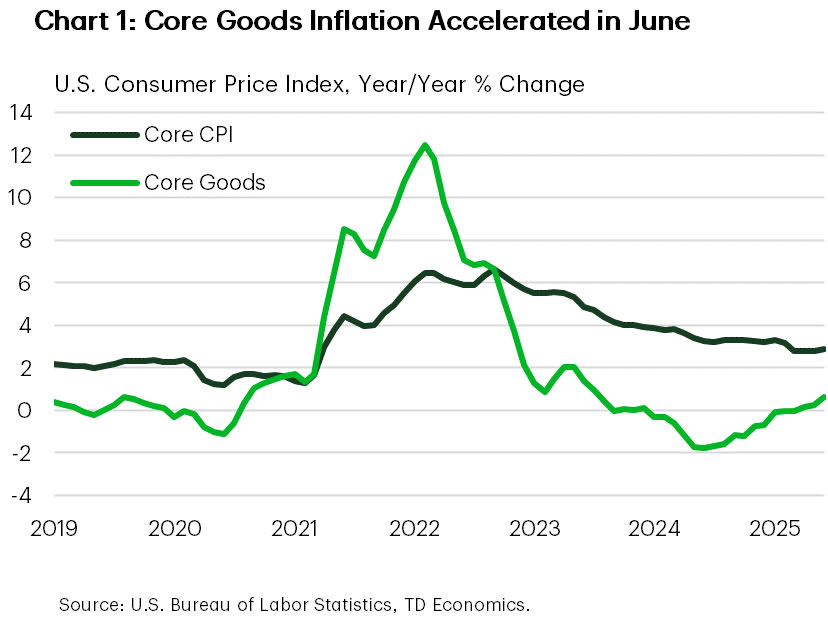
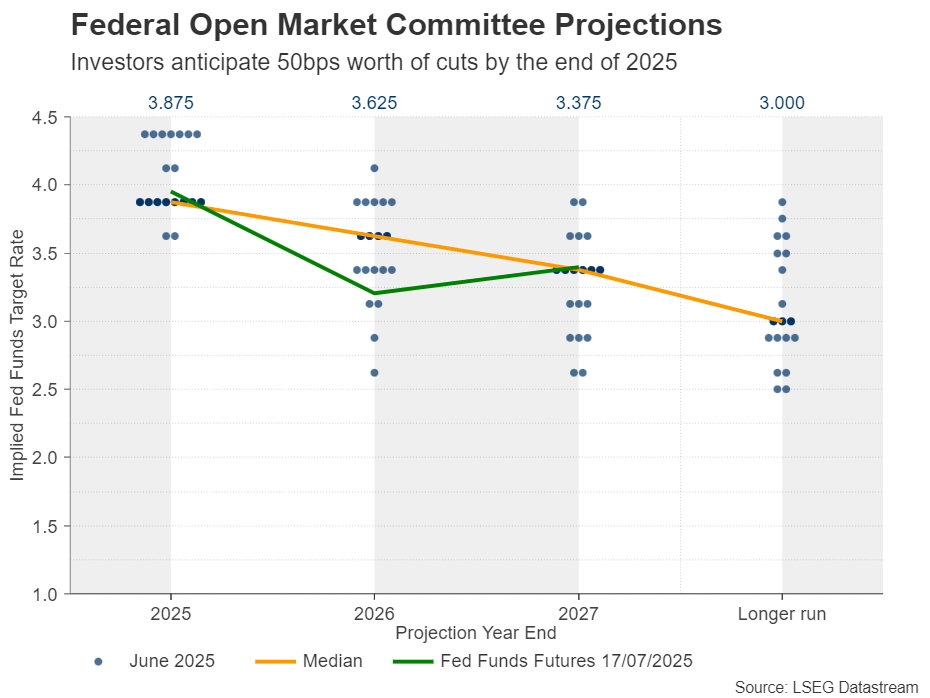
Some preliminary signs of this began to show up in the June CPI inflation report, as the monthly gain in core goods prices hit a two year high. This in turn pushed the annual growth in core CPI, which excludes the more volatile food & energy categories, up to 2.9% (Chart 1). Furthermore, this week’s Fed Beige Book noted that “contacts in a wide range of industries expected cost pressures to remain elevated in the coming months, increasing the likelihood that consumer prices will start to rise more rapidly by late summer”. With tariffs expected to rise further over the coming month, it is unlikely that the Federal Reserve will be able to shift its restrictive monetary policy stance over the near term. Markets see virtually no chance for a rate cut in two weeks, and a 60% chance of a cut in September.
Most of the Federal Reserve officials we heard from this week echoed the wait-and-see sentiment noted by Chair Powell in recent weeks. One notable exception was Governor Waller, who spoke after the release of the June CPI report and advocated for a 25-basis-point cut in July. Waller has been dovish for several months now, citing the slowdown in employment growth as the basis for easing monetary policy. However, the FOMC makes policy decisions by majority vote, and a cut in July is currently viewed as unlikely.
Lastly, the President announced a trade deal with Indonesia earlier this week, stating that it would face a tariff rate of 19%, in addition to agreeing to purchase tens of billions of dollars in American energy, agricultural, and aerospace goods. While tariffs lower than the initial April 2nd level are a positive development, these still represent notably higher levies than current levels, and trade deals with larger trading partners have remained elusive (Chart 2). Looking ahead, markets will be closely watching for additional trade deals with the August 1st deadline quickly approaching.
Weekly Economic & Financial Commentary: Fighting Fire with Fire
Summary
United States: Economic Data Clears the Bar, but Doesn’t Raise It
- The economic data calendar was packed this week. Better-than-expected retail sales, industrial production and home construction suggest activity has regained its footing after a loss of momentum during the first five months of the year. At the same time, data on inflation indicate the costs of tariffs are starting to get passed on to consumers, albeit slowly.
- Next week: Existing Homes Sales (Wed.), Durable Goods Orders (Fri.)
International: Mixed Signals from Foreign Economies
- This week’s economic data painted a mixed global picture. China’s Q2 GDP growth beat expectations but underlying momentum appears fragile. The United Kingdom faced an unwelcome inflation surprise, Canada saw its first inflation uptick in months, while Japan’s inflation cooled modestly. Meanwhile, in emerging markets, India’s inflation dropped sharply, strengthening the case for further easing.
- Next week: U.K. PMIs (Thu.), European Central Bank (Thu.)
Interest Rate Watch: Fighting Fire with Fire
- The potential firing of Chair Powell jolted markets this week. Even if President Trump were to bring in a dovish successor, changes in monetary policy are determined by a voting committee and the long end of the curve is influenced by factors outside the Federal Reserve's purview.
Credit Market Insights: Methodological Changes Cloud Recent Consumer Credit Trends
- Overall credit outstanding dropped by a whopping $110.9 billion in December 2024, the largest single-month decline since records began in 1968. Although more modest credit uptake lends additional evidence that tariffs are weakening consumer resolve, this nosedive likely overstates the extent to which consumers are pulling back.
Topic of the Week: Foreign Suppliers Resisting Tariff Pressures
- If foreign exporters were absorbing the cost of tariffs, U.S. import prices would be declining in proportion to the rise in the tariff rate. Yet, nonfuel import prices, which exclude the cost of tariffs, rose 1.2% year-over-year in June. With little relief on import prices, domestic firms are stomaching the cost of higher tariffs and starting to pass it on to consumers.
Summary 7/21 – 7/25
Monday, Jul 21, 2025
| GMT | Ccy | Events | Consensus | Previous |
|---|---|---|---|---|
| 22:45 | NZD | CPI Q/Q Q2 | 0.60% | 0.90% |
| 22:45 | NZD | CPI Y/Y Q2 | 2.80% | 2.50% |
| 01:00 | CNY | PBoC 1-Y Loan Prime Rate | 3.00% | 3.00% |
| 01:00 | CNY | PBoC 5-Y Loan Prime Rate | 3.50% | 3.50% |
| 12:30 | CAD | Industrial Product Price M/M Jun | 0.30% | -0.50% |
| 12:30 | CAD | Raw Material Price Index M/M Jun | -0.20% | -0.40% |
| 14:30 | CAD | BoC Business Outlook Survey | ||
| 22:45 | NZD | Trade Balance (NZD) Jun | 1020M | 1235M |
| GMT | Ccy | Events | |
|---|---|---|---|
| 22:45 | NZD | CPI Q/Q Q2 | |
| Forecast: 0.60% | Previous: 0.90% | ||
| 22:45 | NZD | CPI Y/Y Q2 | |
| Forecast: 2.80% | Previous: 2.50% | ||
| 01:00 | CNY | PBoC 1-Y Loan Prime Rate | |
| Forecast: 3.00% | Previous: 3.00% | ||
| 01:00 | CNY | PBoC 5-Y Loan Prime Rate | |
| Forecast: 3.50% | Previous: 3.50% | ||
| 12:30 | CAD | Industrial Product Price M/M Jun | |
| Forecast: 0.30% | Previous: -0.50% | ||
| 12:30 | CAD | Raw Material Price Index M/M Jun | |
| Forecast: -0.20% | Previous: -0.40% | ||
| 14:30 | CAD | BoC Business Outlook Survey | |
| Forecast: | Previous: | ||
| 22:45 | NZD | Trade Balance (NZD) Jun | |
| Forecast: 1020M | Previous: 1235M | ||
Tuesday, Jul 22, 2025
| GMT | Ccy | Events | Consensus | Previous |
|---|---|---|---|---|
| 01:30 | AUD | RBA Meeting Minutes | ||
| 06:00 | GBP | Public Sector Net Borrowing (GBP) Jun | 17.6B | 17.7B |
| GMT | Ccy | Events | |
|---|---|---|---|
| 01:30 | AUD | RBA Meeting Minutes | |
| Forecast: | Previous: | ||
| 06:00 | GBP | Public Sector Net Borrowing (GBP) Jun | |
| Forecast: 17.6B | Previous: 17.7B | ||
Wednesday, Jul 23, 2025
| GMT | Ccy | Events | Consensus | Previous |
|---|---|---|---|---|
| 01:00 | AUD | Westpac Leading Index M/M Jun | -0.10% | |
| 12:30 | CAD | New Housing Price Index M/M Jun | 0.00% | -0.20% |
| 14:00 | USD | Existing Home Sales Jun | 4.02M | 4.03M |
| 14:00 | EUR | Eurozone Consumer Confidence Jul P | -14.5 | -15.3 |
| 14:30 | USD | Crude Oil Inventories | -3.9M | |
| 23:00 | AUD | Manufacturing PMI Jul P | 50.6 | |
| 23:00 | AUD | Services PMI Jul P | 51.8 |
| GMT | Ccy | Events | |
|---|---|---|---|
| 01:00 | AUD | Westpac Leading Index M/M Jun | |
| Forecast: | Previous: -0.10% | ||
| 12:30 | CAD | New Housing Price Index M/M Jun | |
| Forecast: 0.00% | Previous: -0.20% | ||
| 14:00 | USD | Existing Home Sales Jun | |
| Forecast: 4.02M | Previous: 4.03M | ||
| 14:00 | EUR | Eurozone Consumer Confidence Jul P | |
| Forecast: -14.5 | Previous: -15.3 | ||
| 14:30 | USD | Crude Oil Inventories | |
| Forecast: | Previous: -3.9M | ||
| 23:00 | AUD | Manufacturing PMI Jul P | |
| Forecast: | Previous: 50.6 | ||
| 23:00 | AUD | Services PMI Jul P | |
| Forecast: | Previous: 51.8 | ||
Thursday, Jul 24, 2025
| GMT | Ccy | Events | Consensus | Previous |
|---|---|---|---|---|
| 00:30 | JPY | Manufacturing PMI Jul P | 50.2 | 50.1 |
| 00:30 | JPY | Services PMI Jul P | 51.7 | |
| 06:00 | EUR | Germany GfK Consumer Confidence Aug | -19 | -20.3 |
| 07:15 | EUR | France Manufacturing PMI Jul P | 48.7 | 48.1 |
| 07:15 | EUR | France Services PMI Jul P | 49.7 | 49.6 |
| 07:30 | EUR | Germany Manufacturing PMI Jul P | 49.4 | 49 |
| 07:30 | EUR | Germany Services PMI Jul P | 50.2 | 49.7 |
| 08:00 | EUR | Eurozone Manufacturing PMI Jul P | 49.9 | 49.5 |
| 08:00 | EUR | Eurozone Services PMI Jul P | 50.9 | 50.5 |
| 08:30 | GBP | Manufacturing PMI Jul P | 48.1 | 47.7 |
| 08:30 | GBP | Services PMI Jul P | 53 | 52.8 |
| 12:15 | EUR | ECB Deposit Rate | 2.00% | 2.00% |
| 12:15 | EUR | ECB Main Refinancing Rate | 2.15% | 2.15% |
| 12:15 | EUR | ECB Monetary Policy Statement | ||
| 12:30 | CAD | Retail Sales M/M May | -0.90% | 0.30% |
| 12:30 | CAD | Retail Sales ex Autos M/M May | -0.20% | -0.30% |
| 12:30 | USD | Initial Jobless Claims (Jul 18) | 230K | 221K |
| 13:45 | USD | Manufacturing PMI Jul P | 52.4 | 52 |
| 13:45 | USD | Services PMI Jul P | 52.9 | 52.9 |
| 14:00 | USD | New Home SalesJun | 651K | 623K |
| 14:30 | USD | Natural Gas Storage | 46B | |
| 23:01 | GBP | GfK Consumer Confidence Jul | -20 | -18 |
| 23:30 | JPY | Tokyo CPI Y/Y Jul | 3.10% | |
| 23:30 | JPY | Tokyo CPI Core Y/Y Jul | 3.00% | 3.10% |
| 23:30 | JPY | Tokyo CPI Core-Core Y/Y Jul | 3.10% | |
| 23:50 | JPY | Corporate Service Price Index Y/Y Jun | 3.20% | 3.30% |
| GMT | Ccy | Events | |
|---|---|---|---|
| 00:30 | JPY | Manufacturing PMI Jul P | |
| Forecast: 50.2 | Previous: 50.1 | ||
| 00:30 | JPY | Services PMI Jul P | |
| Forecast: | Previous: 51.7 | ||
| 06:00 | EUR | Germany GfK Consumer Confidence Aug | |
| Forecast: -19 | Previous: -20.3 | ||
| 07:15 | EUR | France Manufacturing PMI Jul P | |
| Forecast: 48.7 | Previous: 48.1 | ||
| 07:15 | EUR | France Services PMI Jul P | |
| Forecast: 49.7 | Previous: 49.6 | ||
| 07:30 | EUR | Germany Manufacturing PMI Jul P | |
| Forecast: 49.4 | Previous: 49 | ||
| 07:30 | EUR | Germany Services PMI Jul P | |
| Forecast: 50.2 | Previous: 49.7 | ||
| 08:00 | EUR | Eurozone Manufacturing PMI Jul P | |
| Forecast: 49.9 | Previous: 49.5 | ||
| 08:00 | EUR | Eurozone Services PMI Jul P | |
| Forecast: 50.9 | Previous: 50.5 | ||
| 08:30 | GBP | Manufacturing PMI Jul P | |
| Forecast: 48.1 | Previous: 47.7 | ||
| 08:30 | GBP | Services PMI Jul P | |
| Forecast: 53 | Previous: 52.8 | ||
| 12:15 | EUR | ECB Deposit Rate | |
| Forecast: 2.00% | Previous: 2.00% | ||
| 12:15 | EUR | ECB Main Refinancing Rate | |
| Forecast: 2.15% | Previous: 2.15% | ||
| 12:15 | EUR | ECB Monetary Policy Statement | |
| Forecast: | Previous: | ||
| 12:30 | CAD | Retail Sales M/M May | |
| Forecast: -0.90% | Previous: 0.30% | ||
| 12:30 | CAD | Retail Sales ex Autos M/M May | |
| Forecast: -0.20% | Previous: -0.30% | ||
| 12:30 | USD | Initial Jobless Claims (Jul 18) | |
| Forecast: 230K | Previous: 221K | ||
| 13:45 | USD | Manufacturing PMI Jul P | |
| Forecast: 52.4 | Previous: 52 | ||
| 13:45 | USD | Services PMI Jul P | |
| Forecast: 52.9 | Previous: 52.9 | ||
| 14:00 | USD | New Home SalesJun | |
| Forecast: 651K | Previous: 623K | ||
| 14:30 | USD | Natural Gas Storage | |
| Forecast: | Previous: 46B | ||
| 23:01 | GBP | GfK Consumer Confidence Jul | |
| Forecast: -20 | Previous: -18 | ||
| 23:30 | JPY | Tokyo CPI Y/Y Jul | |
| Forecast: | Previous: 3.10% | ||
| 23:30 | JPY | Tokyo CPI Core Y/Y Jul | |
| Forecast: 3.00% | Previous: 3.10% | ||
| 23:30 | JPY | Tokyo CPI Core-Core Y/Y Jul | |
| Forecast: | Previous: 3.10% | ||
| 23:50 | JPY | Corporate Service Price Index Y/Y Jun | |
| Forecast: 3.20% | Previous: 3.30% | ||
Friday, Jul 25, 2025
| GMT | Ccy | Events | Consensus | Previous |
|---|---|---|---|---|
| 06:00 | GBP | Retail Sales M/M Jun | 1.20% | -2.70% |
| 08:00 | EUR | Germany IFO Business Climate Jul | 89.2 | 88.4 |
| 08:00 | EUR | Germany IFO Current Assessment Jul | 86.2 | |
| 08:00 | EUR | Germany IFO Expectations Jul | 90.7 | |
| 08:00 | EUR | Eurozone M3 Money Supply Y/Y Jun | 3.70% | 3.90% |
| 12:30 | USD | Durable Goods Orders Jun | -11.00% | 16.40% |
| 12:30 | USD | Durable Goods Orders ex Transportation Jun | 0.10% | 0.50% |
| GMT | Ccy | Events | |
|---|---|---|---|
| 06:00 | GBP | Retail Sales M/M Jun | |
| Forecast: 1.20% | Previous: -2.70% | ||
| 08:00 | EUR | Germany IFO Business Climate Jul | |
| Forecast: 89.2 | Previous: 88.4 | ||
| 08:00 | EUR | Germany IFO Current Assessment Jul | |
| Forecast: | Previous: 86.2 | ||
| 08:00 | EUR | Germany IFO Expectations Jul | |
| Forecast: | Previous: 90.7 | ||
| 08:00 | EUR | Eurozone M3 Money Supply Y/Y Jun | |
| Forecast: 3.70% | Previous: 3.90% | ||
| 12:30 | USD | Durable Goods Orders Jun | |
| Forecast: -11.00% | Previous: 16.40% | ||
| 12:30 | USD | Durable Goods Orders ex Transportation Jun | |
| Forecast: 0.10% | Previous: 0.50% | ||
Week Ahead – Trump-Powell Saga, ECB and Earnings to Keep Traders Busy
- Dollar stays strong amid safe haven flows and inflation risks.
- US prel. PMIs and Powell speech to be closely monitored.
- ECB expected to stand pat, focus to fall on forward guidance.
- Pound traders await PMIs, but stay convinced about August BoE cut.
- Alphabet and Tesla earnings results also on tap.
Investors scale back Fed rate cut bets
The US dollar continued to outperform all its major counterparts this week, still driven by safe haven flows amid the uncertainty surrounding the global trade landscape, as well as due to the upside risks tariffs are posing to US inflation.
On Tuesday, the CPI data revealed that inflation accelerated in June, with underlying inflation mainly driven by a strong increase in core goods. This was seen as proof of tariff-driven inflation and prompted investors to scale back their rate cut bets, nearly erasing the probability of a July reduction.
Even September is not a done deal, with the probability of a quarter-point cut at that meeting dropping to 60%. Even after Wednesday’s PPI numbers pointed to a slowdown in producer prices during last month, investors were not convinced to bring rate cut bets back to the table.
Will Powell crack under Trump’s pressure
Next week’s agenda includes the preliminary S&P Global PMIs for July, due out on Thursday, but earlier on Tuesday, Fed Chair Powell will speak at a conference hosted by the Federal Reserve. With US President Turmp ramping up his attacks on him lately, it will be interesting to see whether the pressure has affected his stance. Trump has repeatedly called on Powell to lower interest rates, with reports this week suggesting that the US President has discussed with other Republicans the idea of firing him. However, Trump was quick to downplay the discussions, saying that “it is highly unlikely” that he will fire the head of the Fed.
Thus, should Powel insist on defending the Fed’s independence by highlighting once again that they should remain patient and wait for more data to reveal the impact of tariffs, the dollar is likely to extend its recovery. That said, it is still too early to start arguing about a bullish reversal in the US dollar. Yes, the world’s reserve currency is responding positively to headlines adding to tariff-related anxiety lately, but should tariffs begin refueling fears of recession, traders may start reacting the way they did back in April, when they were selling dollars.
Thursday’s PMIs will provide an updated picture of how the world’s largest economy has been performing in the midst of all this trade-related uncertainty, with the prices charged and employment subcomponents likely to draw extra interest. Existing home sales for June are due out on Wednesday and new home sales for the same month on Thursday.
Will Lagarde sound more dovish this time?
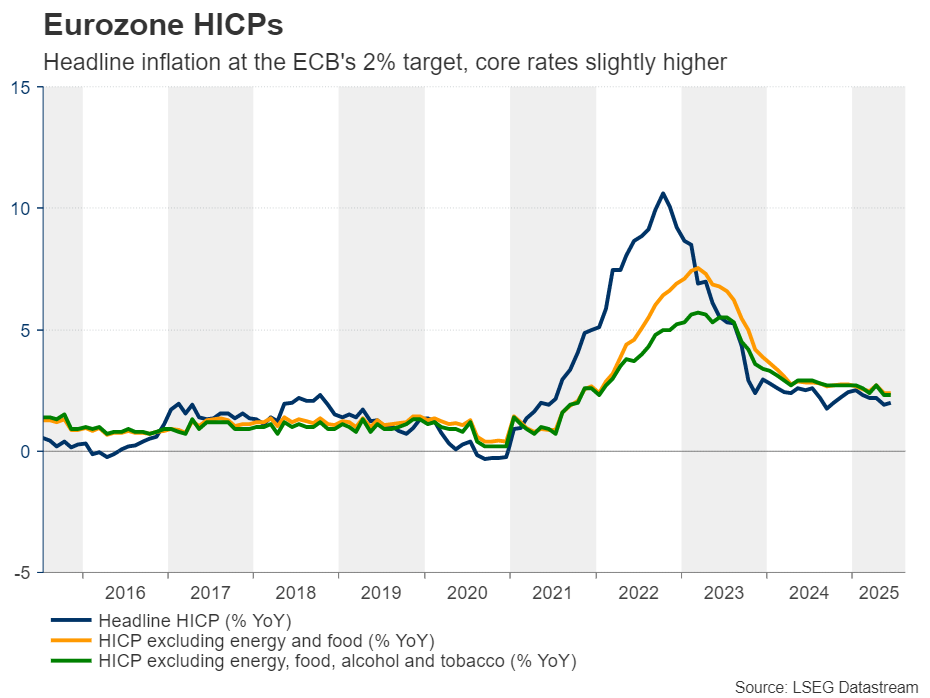
In the Eurozone, the ECB will decide on monetary policy on Thursday. In June, this Bank decided to cut rates by 25bps, taking the deposit rate to 2.0%. At the press conference, President Lagarde noted that they are in a “good position” with the current rate path, while a couple of days after the decision, a Reuters report noted that there was broad agreement at the meeting about taking the sidelines in July, with some members making the case for an even longer pause.
Since then, GDP data revealed higher than expected growth for Q1, while retail sales for April accelerated. Headline inflation ticked up to the Bank’s objective of 2% and the core rate held steady at 2.4%, corroborating the notion that the Bank could wait for a while before cutting interest rates again. According to money markets, investors expect only one additional quarter-point cut before this easing cycle ends, and they are fully factoring it in for December.
However, even if the Bank keeps rates untouched, Trump’s threats of a 30% tariff on European goods could complicate the Bank’s decision-making and should Lagarde appear more concerned about the trade landscape this time around, investors may start bringing forward the timing of the next rate cut, which could weigh on the euro. A disappointing set of preliminary PMIs for July ahead of the decision could prompt traders to add to their rate cut bets even before the rate announcement.
UK PMIs in focus as Pound traders bet on August BoE cut
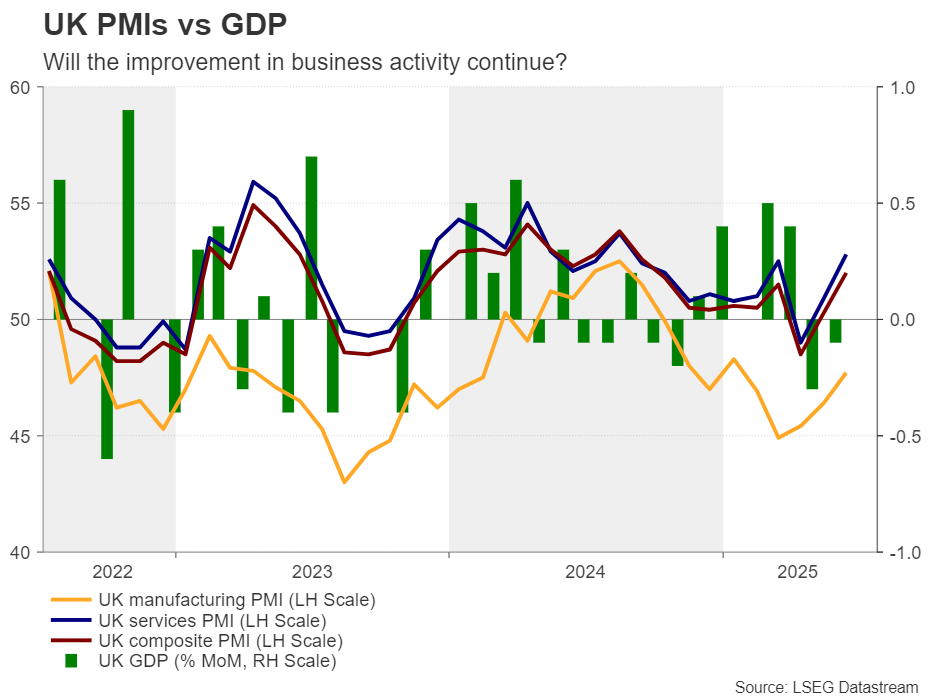
Pound traders will also have to digest PMIs, as just after the Eurozone’s numbers the preliminary numbers from the UK will be released. This week, the UK CPI data showed that inflation unexpectedly accelerated in June but did little to alter bets of an August rate cut, by the BoE.
After all, the BoE has been sounding dovish lately amid a deteriorating labour market, being already aware that inflation would accelerate this year. With that in mind, the PMIs may have the potential to shake rate-cut bets more than the inflation data. The numbers for June pointed to some improvement in business activity, and should this trend continue in July, traders may feel confident to reduce their rate cut bets. Even if they remain convinced that an August rate cut is appropriate, they may push back the timing of the next reduction from December to February next year. A strong set of retail sales figures on Friday could also help, allowing the pound to recover some of the recently lost ground.
Elsewhere, the RBA publishes the minutes of its latest decision on Tuesday, while during the Asian session on Friday, Japan’s Tokyo CPIs for July will be released.
Wall Street locks gaze on Alphabet and Tesla earnings
On the earnings front, Google’s parent Alphabet and Elon Musk’s Tesla will announce their results on Wednesday after the closing bell.
Getting the ball rolling with Alphabet, results for the previous quarter exceeded estimates, but for Q2, analysts expect growth to slow down. The earnings-per-share rate is forecast to have declined to $2.18 from $2.27 in Q1, and while revenue is expected to have increased to $93.9bn from 90.2bn, the year-on-year rate will decline to 10.85% from 12.04%.
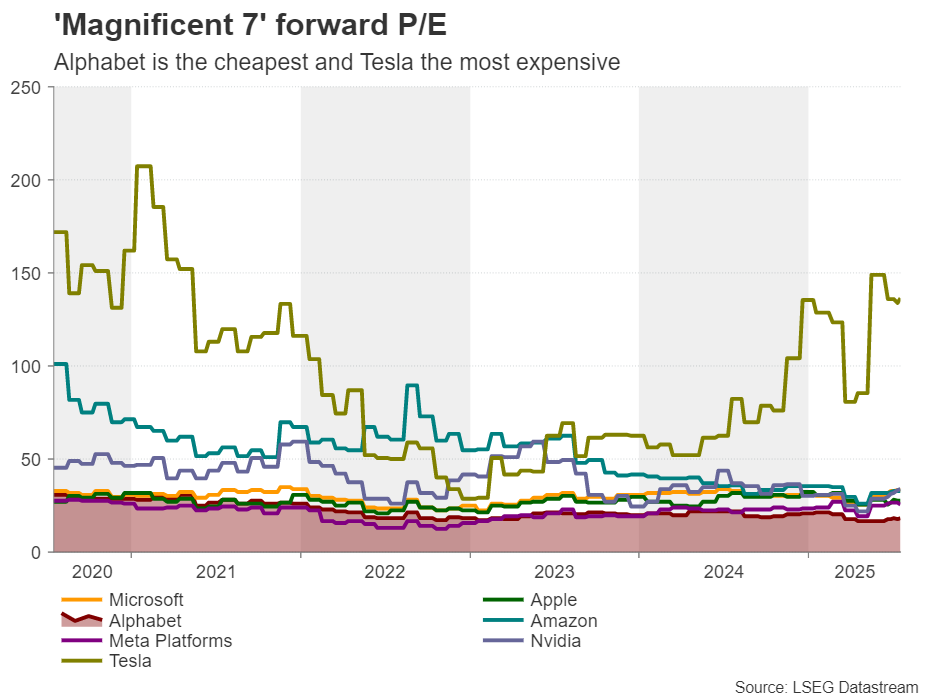
The rise of AI chatbots has undermined Google’s search business, weighing on the advertising revenue. Therefore, investors may be on the lookout for clues about how the firm will expand its user base of its own Gemini chatbot without further hurting its traditional search usage. With Alphabet’s forward price-to-earnings ratio also falling from its high of this year of 21.56x to 18.4x, decent results may help the stock extend the recovery that started back in April.
With regards to Tesla, its Q1 report revealed that revenue fell 9%, while management withdrew its full-year outlook, citing “evolving trade policies” and “uncertain macroeconomic conditions.”
Thus, the spotlight is likely to fall on the 2025 guidance, as well as any comments by Elon Musk on tariffs and politics in general, especially after his public spats with US President Trump. Investors will also be eager to learn updates about the robotaxi initiative. Following reports of erratic driving after the launch in Austin, it will be interesting to see whether Musk will address safety concerns and restore confidence in the firm’s autonomous driving plans.
Bitcoin: Repeated Failures at 120K Barrier Warn of Further Sideways Action
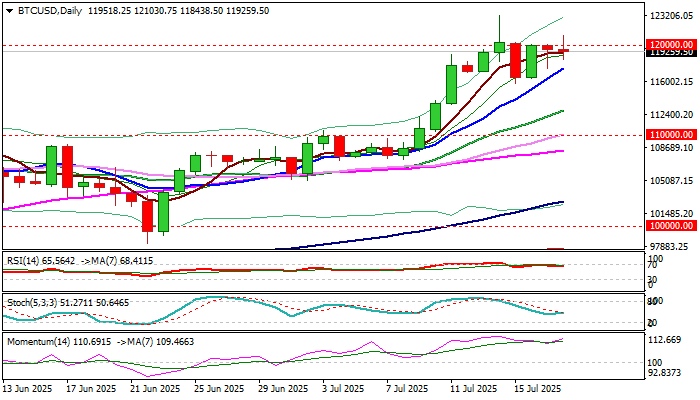
BTCUSD continues to trade in the sideways mode for the seventh straight day, with repeated failures to register close above psychological 120K level indicating that larger bulls might be losing traction after last Monday’s short-lived spike to new all-time high above 123K.
The notion could be supported by overbought weekly studies and weekly action being so far shaped in Doji candle which signals indecision.
This also indicates that bulls may hold under 120K for extended consolidation, before fresh push higher.
Dips should be ideally contained at 117.3/116 K zone (rising 10DMA / current range floor), with potential deeper pullback to find firm ground at 112.7 / 112 K zone (20DMA / former top) to keep larger bulls in play.
Res: 120000; 121030; 123260; 127100
Sup: 118400; 117300; 116000; 113500
GBPUSD Finding Buyers in a Dollar Index Top
Yesterday's reaction to a mixed UK Employment data had been confusing for the most part before taking a look at the bigger picture.
Despite seeing an employment change of 134K vs 46K expected, the UK Unemployment rate came at 4.7% vs a 4.6% consensus, highest since 2021 with easing salarial pressures – Some banks (Citi, GS, BofA) are seeing what they need to push back some rate cuts from September to November.
The Pound had seen a major correction (10 consecutive selling candles) since its 1.3780 top and between some mess-ups from the UK Government requiring intervention from the PM Starmer and some extra mediation from Bank of England's Bailey during the week. However yesterday, GBPUSD marked an intermediate bottom, today we'll try to see if it has more potential for a longer-run bottom.
Most of the fundamentals sometimes cannot explain whatever really happens in the demand for a currency, particularly on the longer-run. Some higher trend shifts are happening (like right now) and participants are simply looking at other things than data.
This is one of the reason that sometimes, Technicals front Fundamentals. This is one of the many reasons why we're going to take a look at these GBPUSD charts today!
GBPUSD Technical Analysis
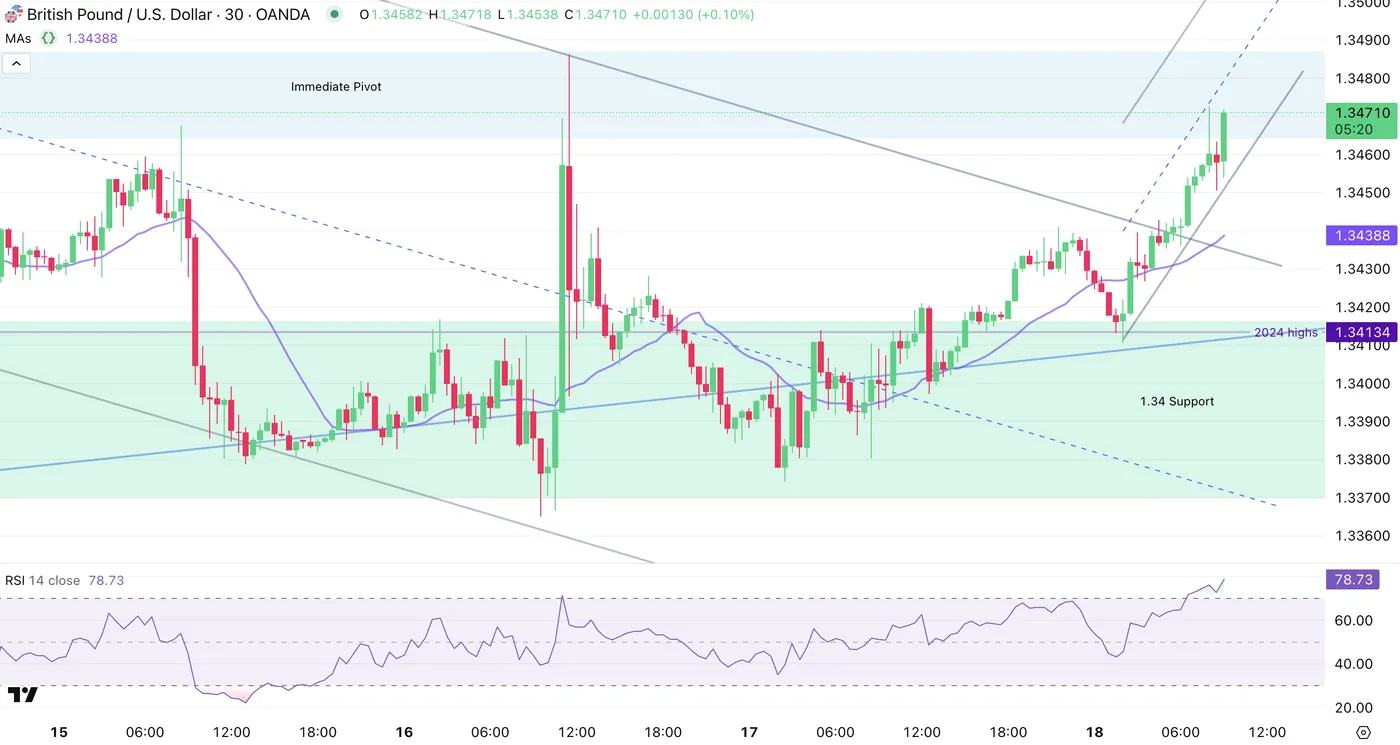
GBPUSD Daily Chart
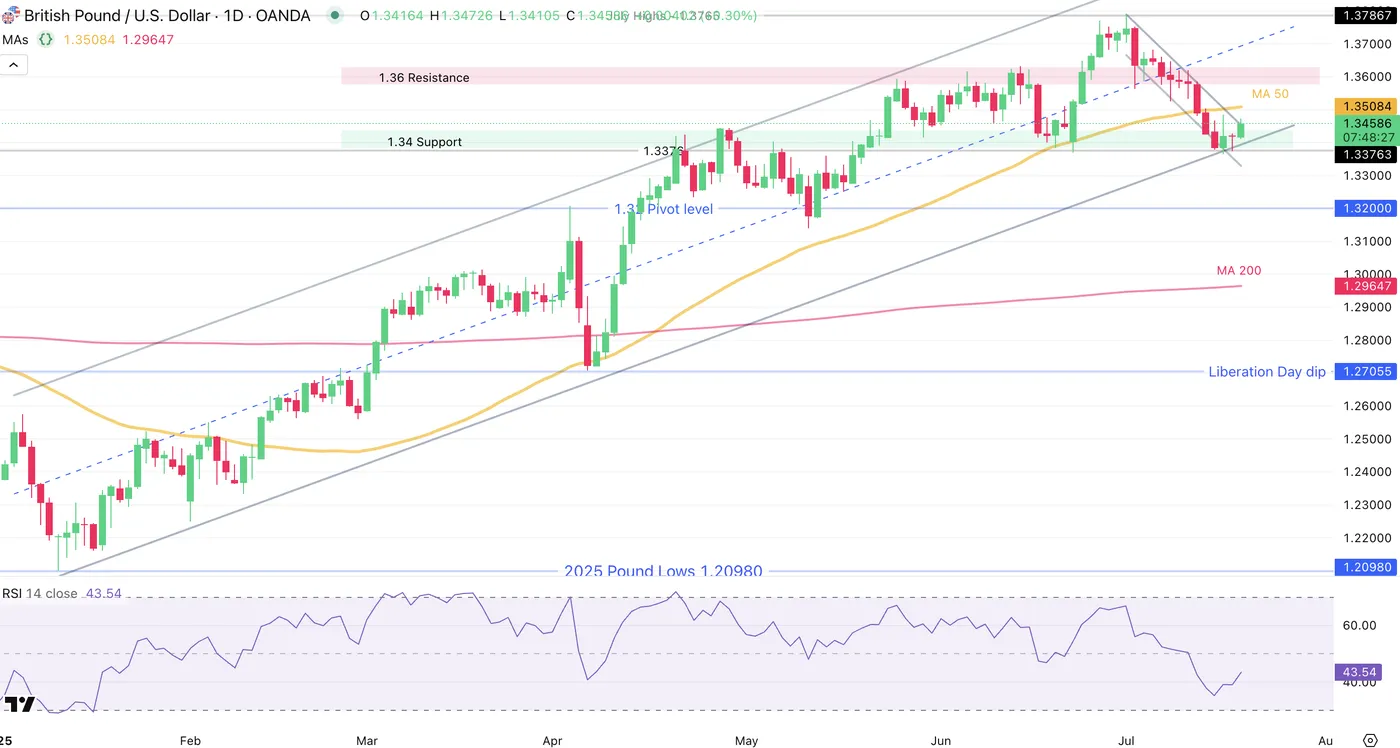
GBPUSD Daily Chart, July 18, 2025 – Source: TradingView
The Pound has had a strong run in the last part of June, as the post-war euphory took the pair to November 2021 highs.
However, the swift momentum higher got met bet a N-shape reversal (N for nope) which brought markets right where they were before the run-up, marking a 4-handle round-turn.
Our US CPI Preview analysis had mentioned the upcoming 1.34 Key support that just came into play, with Quid buyers stepping in lifting the pair, particularly as prices touched the bottom of the 2025 Channel.
Buyers will still have to breach the Key 50-Day Moving Average at 1.35, with a failure to do so bringing the newfound selling back to the table.
Too, RSI momentum has been holdingbelow the middle line for the first time since 2025, indicating more balance in the previous uptrend.
GBPUSD 4H Chart
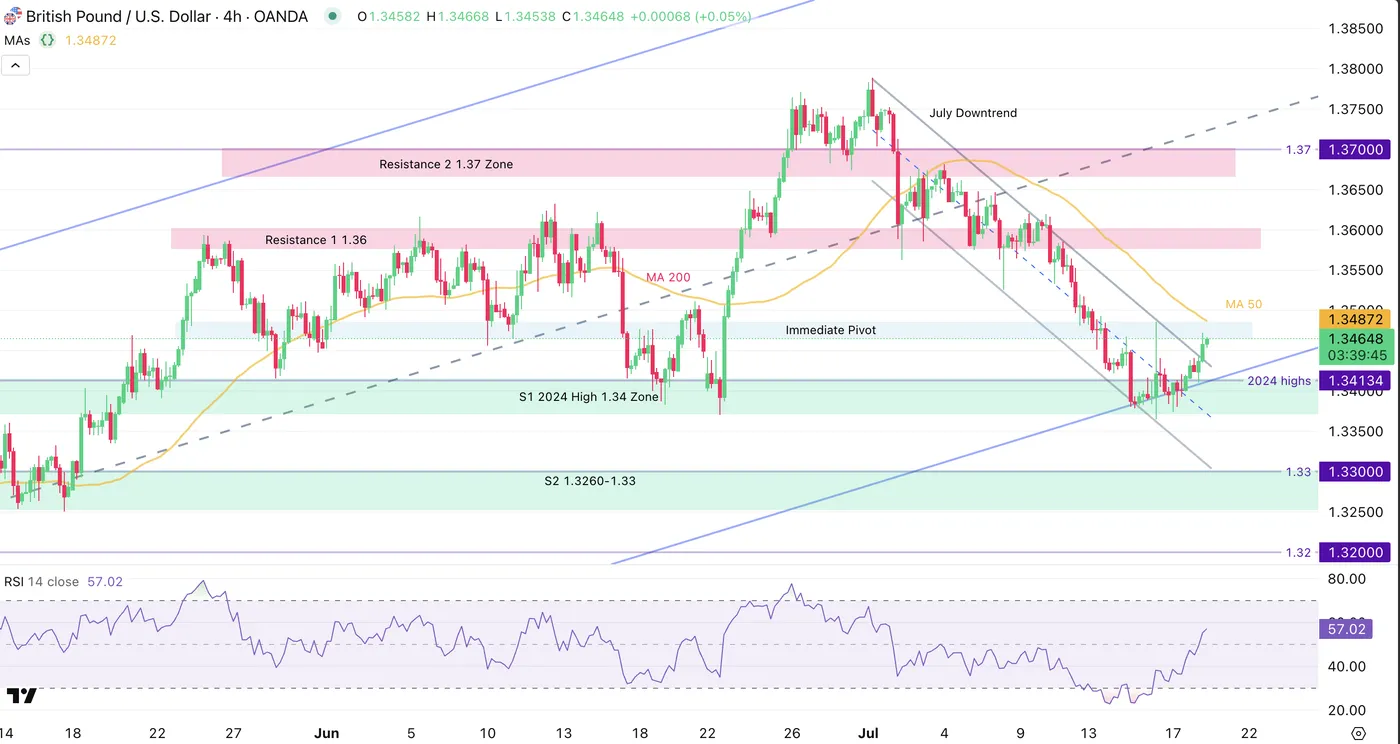
GBPUSD 4H Chart, July 18, 2025 – Source: TradingView
Looking closer, the strong selloff since July 1st has found some reverting to it, with RSI Momentum actually starting to look more bullish than bearish again.
Buyers will have to make sure to not breach the 2025 weekly upwards channel to maintain the ongoing run – Sellers might also have a reason to step in: Prices are approaching the immediate Pivot between 1.3465 to 1.3480 (just above current levels).
Reverting back downwards from here gives them the hand, while continuing higher (breaching 1.35 particularly) would give relative strength to the Buyers.
Support Levels:
- 1.3430 high of July Downtrend
- 1.34 Support Zone
- 1.32 to 1.3250 Major higher timeframe support
Resistance Levels:
- 1.3480 (4H MA 50)
- 1.3550 Zone
- 1.37 to 1.3750 Main Resistance
GBPUSD 30m Chart
GBPUSD 30m Chart, July 18, 2025 – Source: TradingView
The ongoing buying momentum is very strong, with prices evolving in a tight bull channel – This might have to do with the flash sale happening in the US Dollar this morning.
There has been some extra developments with FED's Waller giving very dovish words right before the 2-week pre-meeting blackout period (no words will bve heard from FED Speakers.)
Safe Trades!
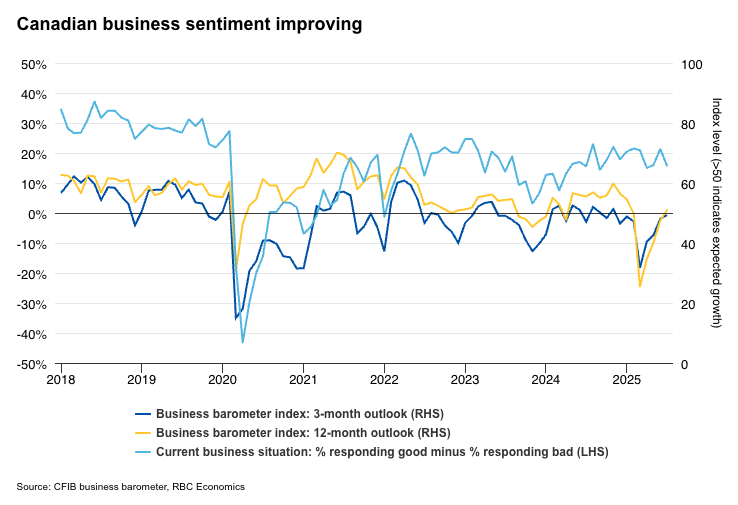
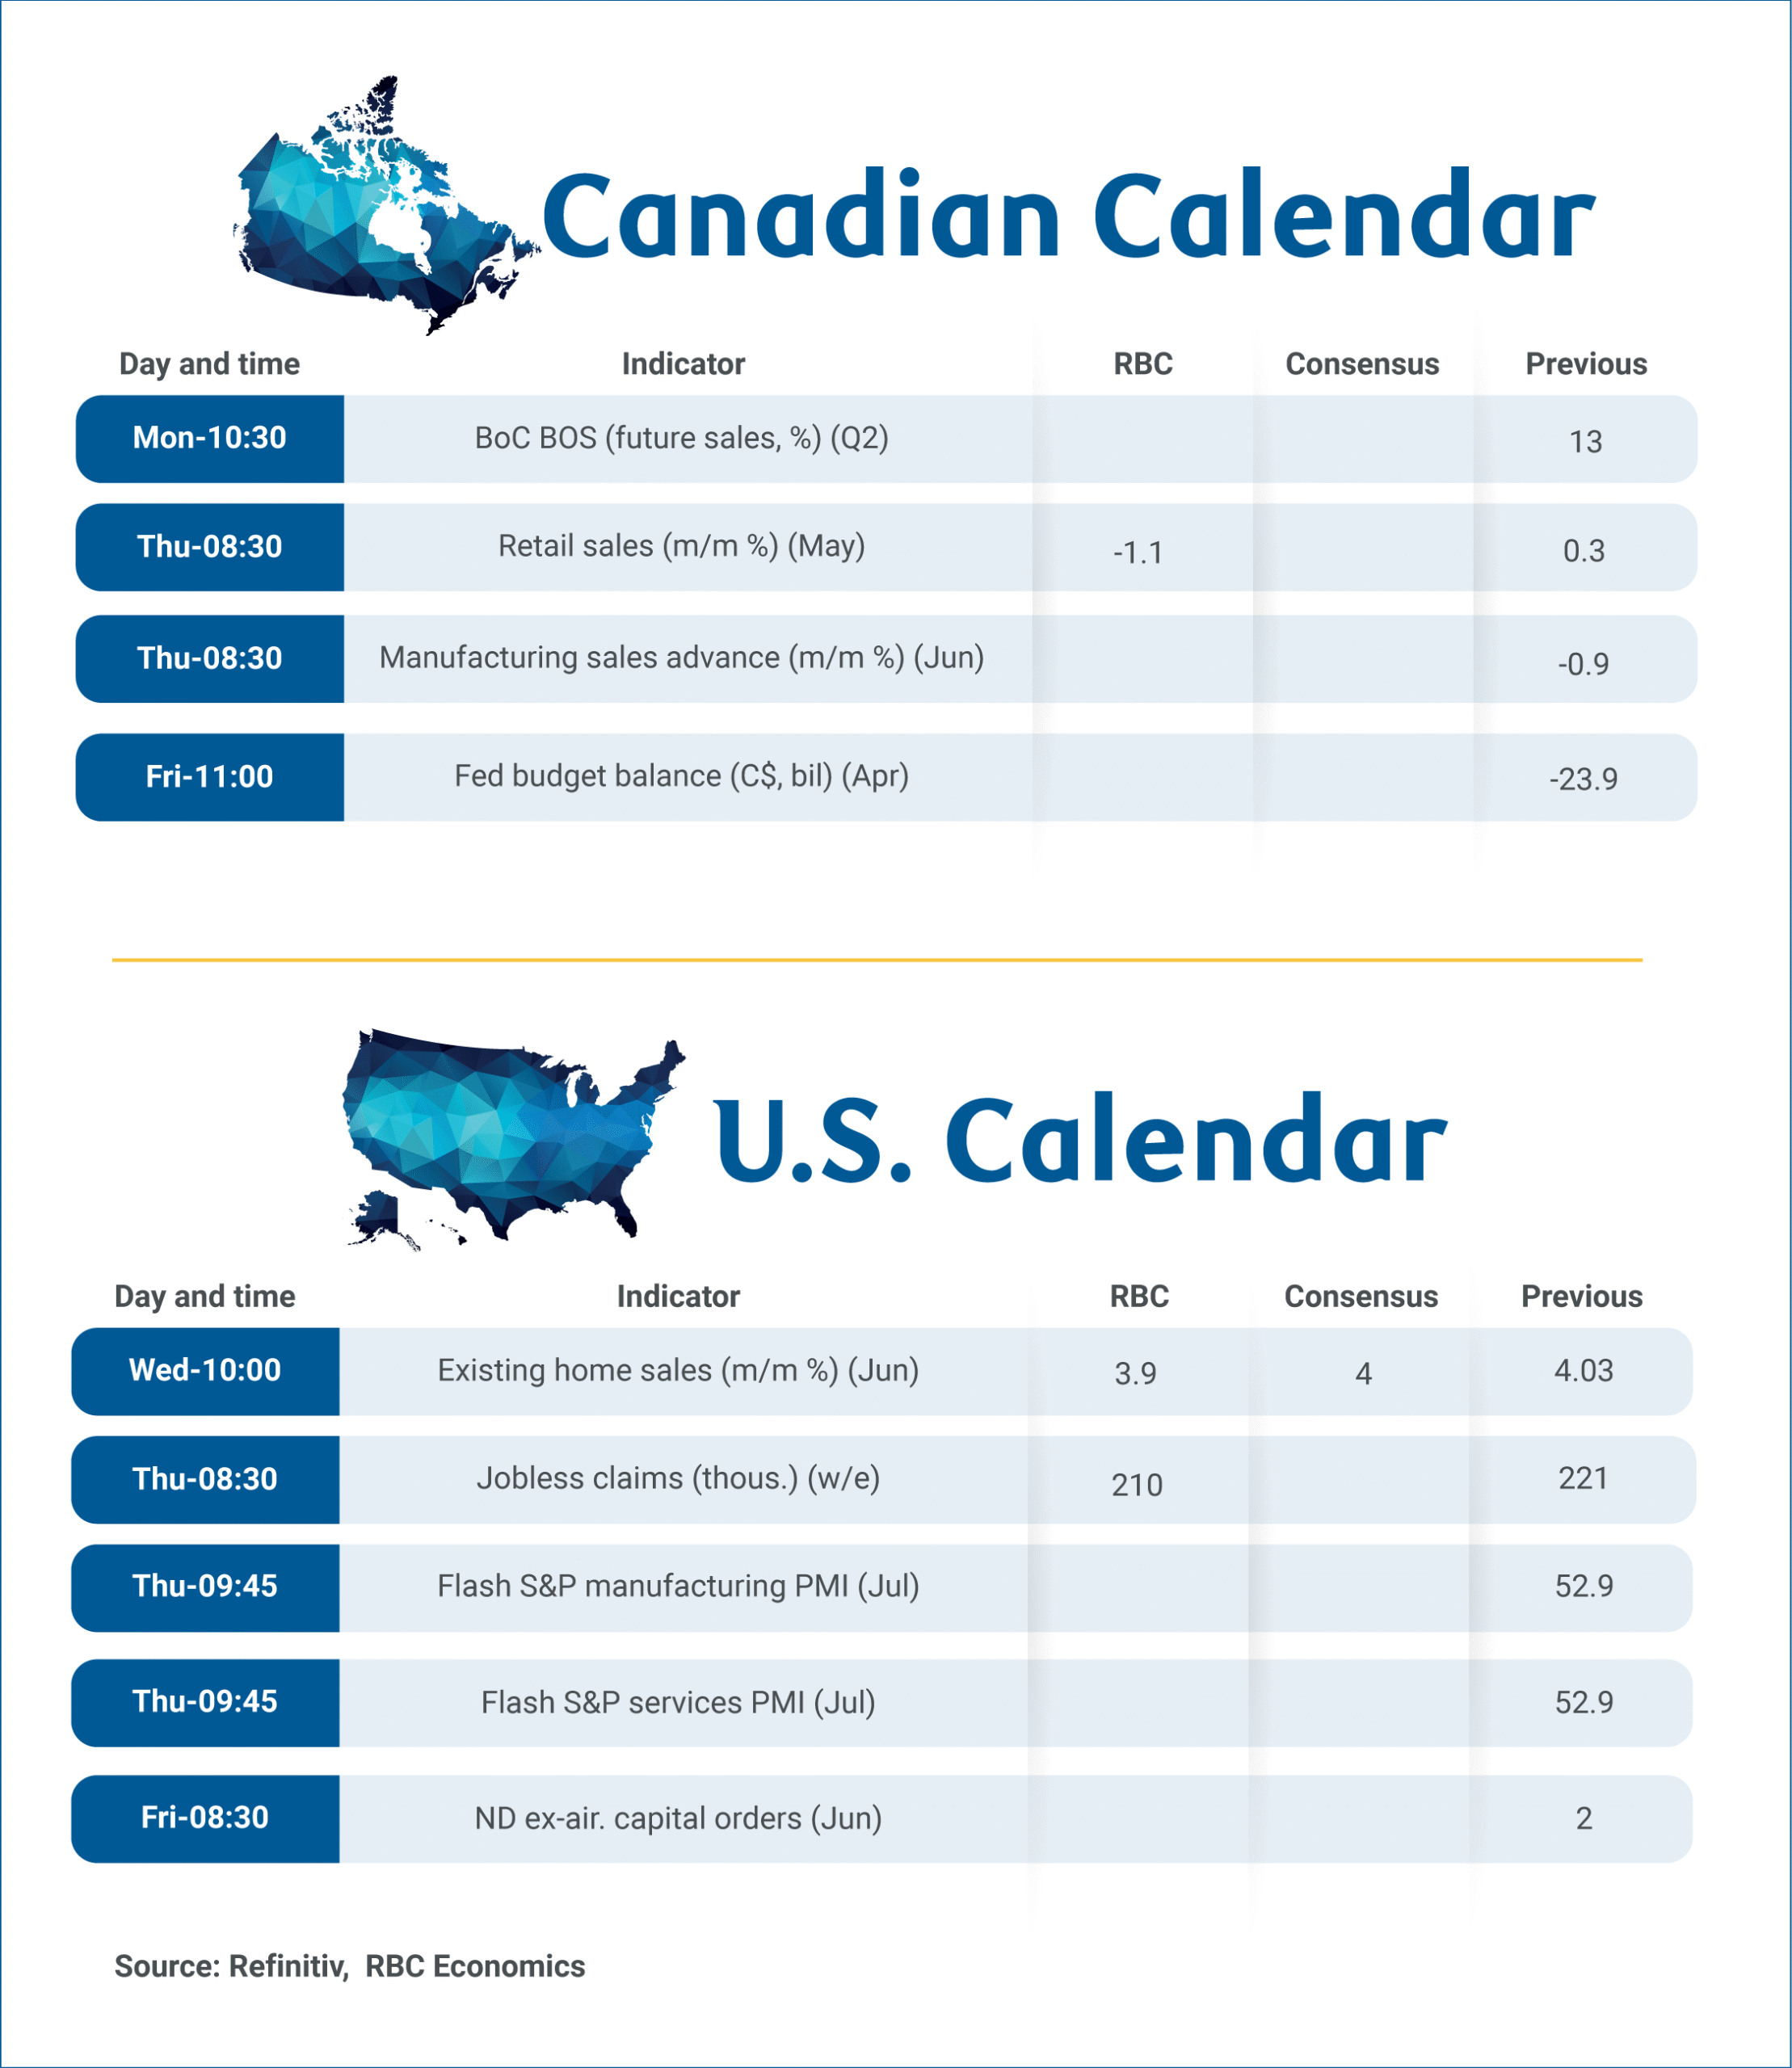
Canadian Business Sentiment Likely Stabilized in Q2 After Earlier Deterioration
The Bank of Canada’s Business Outlook Survey on Monday is expected to show early signs of stabilization in businesses’ expectations for future sales, input prices and hiring in Q2.
The likely improvement follows marked deterioration in Q1, and was during a survey period (Q2 typically spans from early to late May) when threats specifically targeting Canada had receded.
Indeed, as much as Canada was a main focus of trade grievances earlier in Q1, it was excluded from the list of U.S. trade partners facing reciprocal tariffs in April. A duty-free exemption for trade compliant with the USMCA imposed in March also remains in effect.
Indicators have broadly pointed to a stabilizing economic backdrop in Q2. Job openings from Indeed.com steadied into the summer following earlier declines. Business confidence in Canadian Federation of Independent Business surveys continued to improve in July after plunging in March.
We expect next week’s BOS will largely mirror these trends. More significantly, the survey could highlight a divergence between sectors directly exposed to trade headwinds (such as manufacturing and transportation), which will likely maintain a softer outlook, while other sectors, particularly consumer-facing businesses, that are more positive.
The BoC will be watching inflation expectations closely, after a string of mostly hotter consumer price index reports raised concerns that resilience in consumer spending is also leading to resilience in inflation.
Inflation expectations already drifted broadly higher for businesses and consumers in Q1. The early estimate of retail sales was a 1.1% decline in May from April, but to levels that are still resilient relative to low consumer confidence. Our tracking of card transactions pointed to further resilience in June.
Broadly, that kind of a backdrop—better than feared growth and higher than wanted inflation topped with in the prospect of significant fiscal stimulus spending in the year ahead —leaves an high bar for the BoC to make additional interest rate cuts this year. We do not expect further interest rate reductions from the BoC.
Week ahead data watch:
According to the StatsCan’s advance retail indicator, sales declined by 1.1% in May. By our count, much of this slowdown was driven by a decrease in auto sales during the month. Gas prices edged slightly lower on a seasonally adjusted basis, and we anticipate that sales at gas stations remained little changed during that month.
US UoM consumer sentiment rises to 61.8, inflation expectation eases
US consumer sentiment improved in July, with the University of Michigan index rising from 60.7 to 61.8 — the highest reading since February. The gains were broad-based, as both Current Conditions Index and Expectations Index ticked up to 66.8 and 58.6 respectively.
Inflation expectations, however, showed a more meaningful shift. Year-ahead inflation expectations dropped sharply from 5.0% to 4.4%. Long-run expectations declined for a third straight month to from 4.0% to 3.6%. Although these are the lowest readings since February, both remain well above the levels seen at the end of 2024, reflecting continued concern about future price pressures.
Sunset Market Commentary
Markets
The US dollar is bearing the brunt of Fed Waller blatantly soliciting for a job as Fed chair. The influential Fed governor called for a rate cut as soon as this month during a speech overnight, referring to the risk of the labour market tipping over. In another speech this afternoon he refused to repeat his call, but his wording made it obvious he’s favouring lower rates. “The private sector is not doing as well as people think” and “it wouldn’t take much to tip the labour market”. His comments are probably welcomed by the Trump administration, with the president himself consistently calling for lower rates (as low as 1%). And in case you wondered, Waller said “yes” to the question what he’d answer should president Trump ask him to lead the Fed. There’s little chance the Fed will heed Waller’s call given the majority still backs Powell’s wait-and-see but the greenback is nevertheless under pressure against all G10 peers. The trade-weighted index is printing losses, be it only for the second day so far this month. DXY eases from 98.73 at yesterday’s close to 98.28 currently. EUR/USD tested and bounced off support at 1.1573 (April high) on Thursday and builds on the rebound with gains today to 1.165. Sterling eyes vulnerable. EUR/GBP’s test of 0.87 earlier this week failed, triggering some return action lower initially. That’s being reversed already today with the pair moving towards the 0.866 area. JPY is sharing the laggard’s scoreboard with the USD. The Japanese Upper House is headed for important elections this Sunday. If prime minister Ishiba’s LDP-lead ruling coalition is to lose its majority (as was the case in the more powerful Lower House elections last October), we (and markets) could see party-pressure rising for (costly) measures to address the cost of living crisis deemed responsible for the loss. Watch out for the long end of the Japanese (and others) yield curve in that case. For today and going into the weekend, though, the core bond mood is constructive, particularly in the US. Front end underperformance results from Waller’s comments, pushing yields between 3.5-3.9 bps down in the 2-5 yr bucket. Longer maturities ease about 1.8-2.8 bps. It’s interesting to see how 10-yr inflation expectations are, partially at least, compensating for the loss in real yields. It’s suggestive of lingering concerns for political interference with the independent Fed after the feud between Trump and Powell this week hit the headlines again. More politicians, including Speaker of the House Johnson today, are now weighing in on Fed policy. German bunds underperform vs Treasuries (and swaps), adding 1.3-2.8 bps in a bear steepening - but technically irrelevant - move. European stock markets trade little changed while Wall Street opens with slight gains.
News & Views
According to rating agency Fitch, the outcome of the presidential elections in May in Poland can exacerbate political uncertainty in the country. It might continue to challenge the government’s capacity to implement fiscal consolidation and economic reforms. Fitch expects that the new president, Karol Nawrocki, is likely to continue challenging the government. In recent years, public finances have deteriorated significantly, with the general government deficit rising from 1.7% in 2021 to 6.6% of GDP. Fitch assess the government’s consolidation plans to be predominantly backloaded. Additional measures are needed to reduce the deficit below 3%. Fitch now forecasts this year’s budget deficit at 6.6%. It might decline to 4% in 2028. Fitch sees the debt to GDP ratio at 64% by 2027 from 55% end 2024, widening its gap above the ‘A’ median and reducing headroom at the current rating level. Fitch currently has a A- rating for Poland with a stable outlook. The next rating review of Fitch is scheduled for September 5.
The Hungarian Government Debt Management debt agency today announced that it mandated Bank of China and three other financial institutions to organize the issuance of Hungarian Panda bonds intended primarily for Chinese institutional investors. After a USD $4 bln bond issuance in June, AKK this month amended the issuance plan to allow for this Panda bond issuance. Both the USD and the Panda bond issuances serve two purposes: enhancing the flexibility and security of financing.