

Sample Category Title
EUR/USD Mid-Day Outlook
Daily Pivots: (S1) 1.1555; (P) 1.1600; (R1) 1.1642; More...
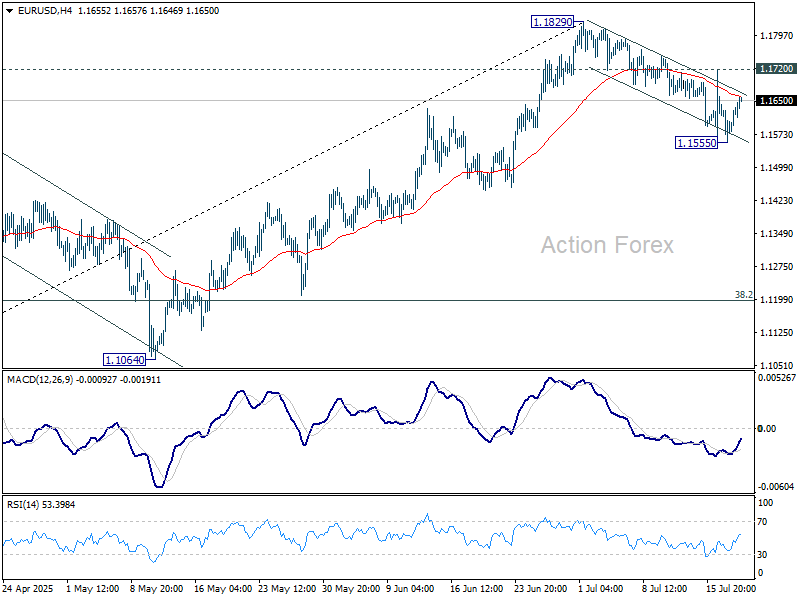
Intraday bias in EUR/USD remains neutral for the moment. Below 1.1555 will extend the corrective fall from 1.1829 to 55 D EMA (now at 1.1493). Sustained break there will target 38.2% retracement of 1.0176 to 1.1829 at 1.1198. On the upside, though, break of 1.1720 will bring retest of 1.1829 high.
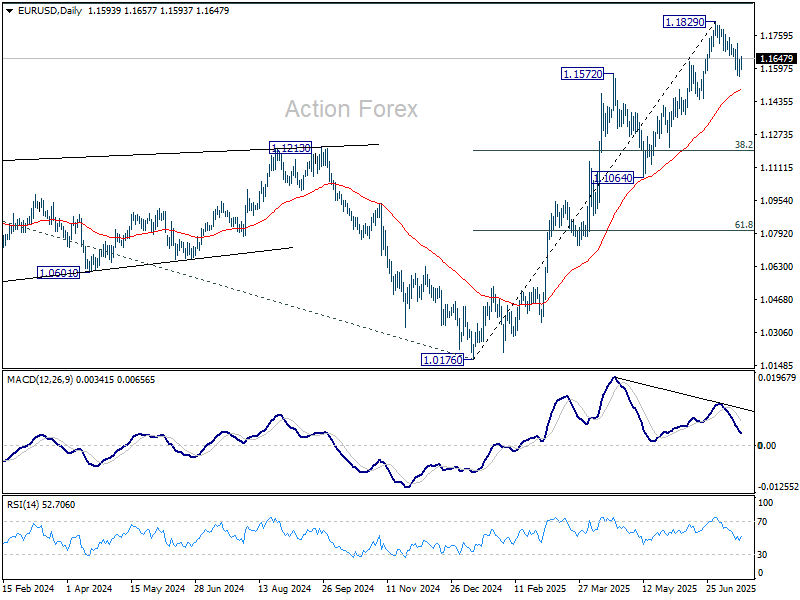
In the bigger picture, rise from 0.9534 long term bottom could be correcting the multi-decade downtrend or the start of a long term up trend. In either case, further rise should be seen to 100% projection of 0.9534 to 1.1274 from 1.0176 at 1.1916. This will remain the favored case as long as 1.1604 support holds.
GBP/USD Mid-Day Outlook
Daily Pivots: (S1) 1.3379; (P) 1.3411; (R1) 1.3447; More...
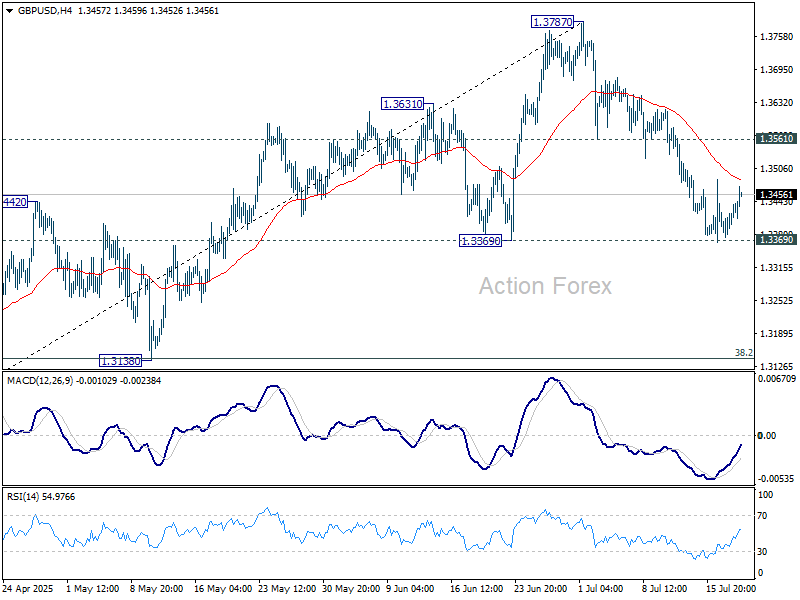
Intraday bias in GBP/USD stays neutral at this point. Focus stays on on 1.3369 support. Decisive break there will suggests that fall from 1.3787 is already correcting the rise from 1.2099. Deeper fall should then be seen to 1.3138 cluster support (38.2% retracement of 1.2099 to 1.3787 at 1.3142). Nevertheless, strong rebound from current level will retain near term bullishness. Break of 1.3561 support turned resistance will bring retest of 1.3787 high first.
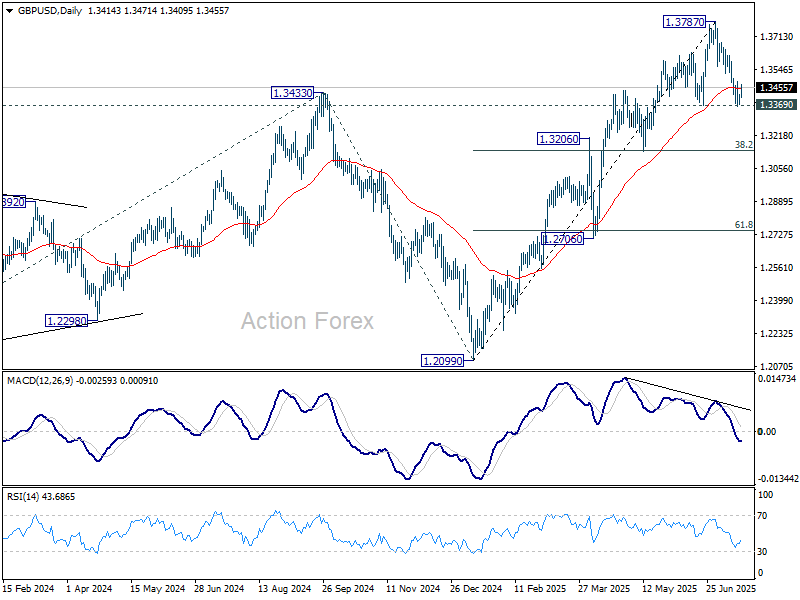
In the bigger picture, up trend from 1.3051 (2022 low) is in progress. Next medium term target is 61.8% projection of 1.0351 to 1.3433 from 1.2099 at 1.4004. Outlook will now stay bullish as long as 55 W EMA (now at 1.3019) holds, even in case of deep pullback.
USD/JPY Mid-Day Outlook
Daily Pivots: (S1) 147.86; (P) 148.48; (R1) 149.22; More...
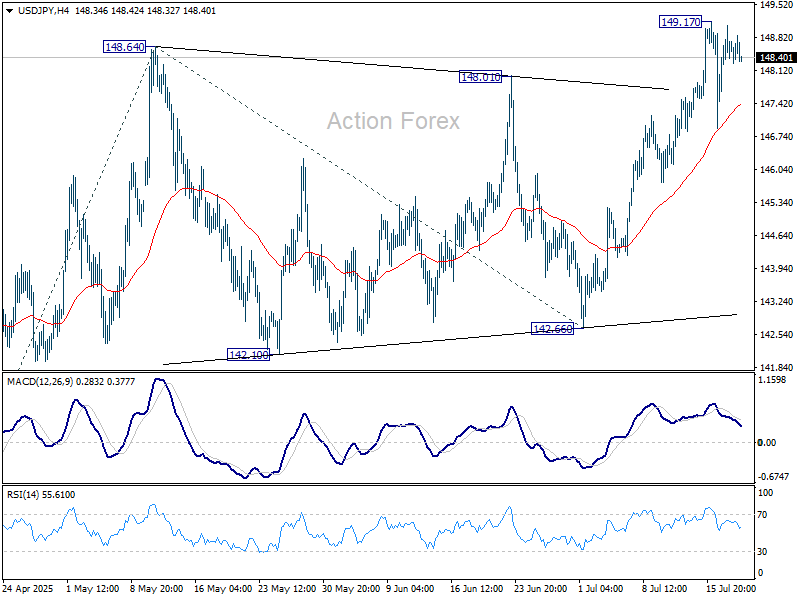
USD/JPY is staying in consolidations below 149.17 and intraday bias stays neutral. Downside should be contained by 55 D EMA (now at 145.77). Break of 149.17 will resume the whole rise from 139.87 to 100% projection of 139.87 to 148.64 from 142.66 at 151.43. That is close to 61.8% retracement of 158.86 to 139.87 at 151.22.
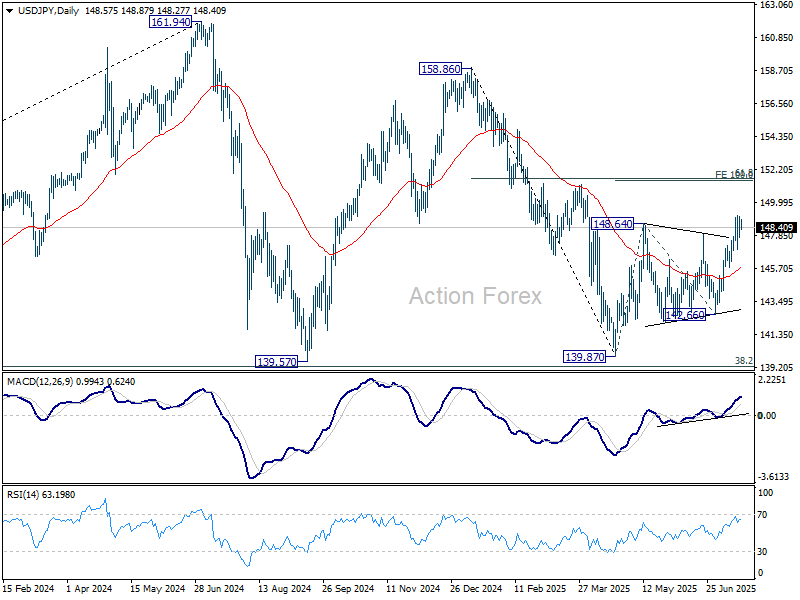
In the bigger picture, price actions from 161.94 (2024 high) are seen as a corrective pattern to rise from 102.58 (2021 low). There is no clear sign that the pattern has completed yet. But still, strong support is expected from 38.2% retracement of 102.58 to 161.94 at 139.26 to bring rebound.
USD/CHF Mid-Day Outlook
Daily Pivots: (S1) 0.8011; (P) 0.8037; (R1) 0.8071; More….
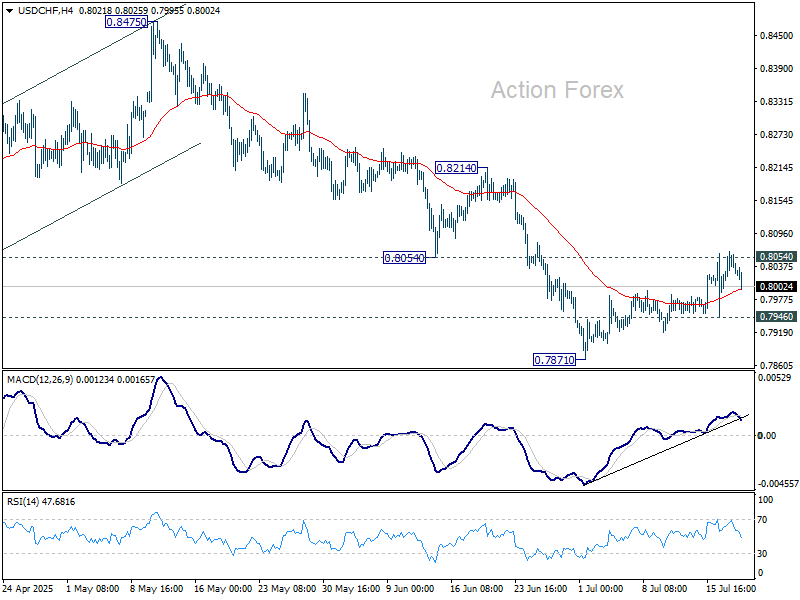
Intraday bias in USD/CHF remains neutral for the moment. On the downside, break of 0.7946 minor support will indicate rejection by 0.8054 support turned resistance and retain near term bearishness. Retest of 0.7871 should be seen next and break will confirm larger down trend resumption. Nevertheless, sustained break of 0.8054 will suggest that rise from 0.7871 at least correcting the fall from 0.8475. Further rise should then be seen to 55 D EMA (now at 0.8146).
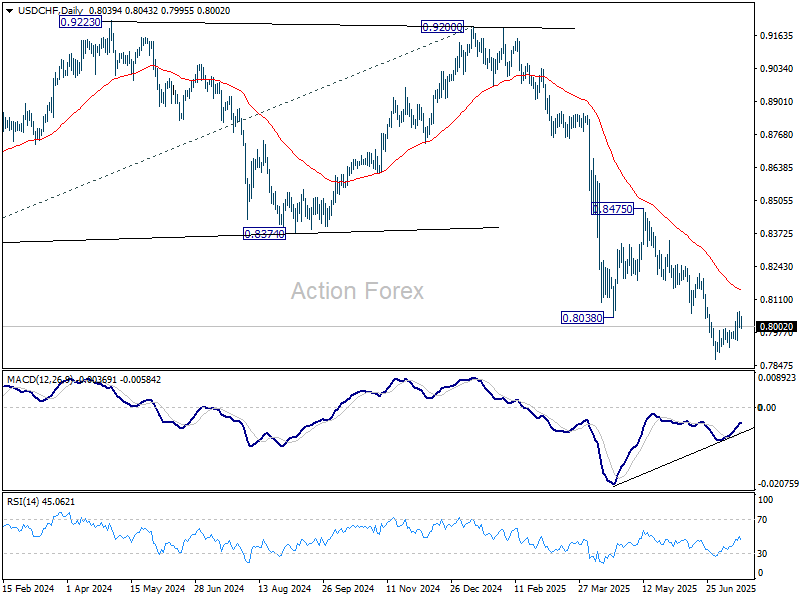
In the bigger picture, long term down trend from 1.0342 (2017 high) is still in progress. Next target is 100% projection of 1.0146 (2022 high) to 0.8332 from 0.9200 at 0.7382. In any case, outlook will stay bearish as long as 0.8475 resistance holds.
Muted Dollar Pullback Leaves Weekly Gains Intact
Dollar is seeing a modest pullback in today's trading, yet it remains the strongest performer for the week. Market activity has been relatively subdued in the absence of major data or headlines. Traders now turn their attention to the University of Michigan's consumer sentiment and inflation expectations data due later today. These numbers could shed light on how recent tariff re-escalations are filtering into household confidence and inflation perceptions.
Elsewhere in FX, Loonie is holding second place for the week, while the British Pound follows in third. At the bottom end, Aussie continues to struggle at the bottom, while Yen and New Kiwi also underperform. Euro and Swiss Franc are trading in middle ground.
On the trade front, Japanese Prime Minister Shigeru Ishiba said today that US Treasury Secretary Scott Bessent assured him that ongoing tariff negotiations will yield a “good” outcome ahead of the August 1 deadline. Ishiba confirmed he is prepared to speak directly with President Trump if needed to protect Japan’s interests, though no date has been set for such talks.
Bessent reinforced the message on social media, saying a good deal is preferable to a rushed one and remains “within the realm of possibility.” The comments suggest some progress behind the scenes, but markets remain cautious given the lack of detail and the short runway before tariffs kick in.
Meanwhile, German Chancellor Friedrich Merz flagged that any tariff deal between the US and EU will likely be “asymmetrical,” citing American reluctance to include services in the negotiations. Merz stressed the importance of keeping tariffs low on both sides, but acknowledged that perfect balance is unlikely.
In Europe, at the time of writing, FTSE is up 0.16%. DAX is down -0.29%. CAC is up 0.04%. UK 10-year yield is up 0.004 at 4.663. Germany 10-year yield is up 0.016 at 2.695. Earlier in Asia, Nikkei fell -0.21%. Hong Kong HSI rose 1.33%. China Shanghai SSE rose 0.50%. Singapore Strait Times rose 0.67%. Japan 10-year JGB yield fell -0.026 to 1.533.
Japan CPI core cools to 3.3% on energy, but food and services prices still climb
Japan’s core consumer inflation slowed in June for the first time in four months, driven by easing energy prices. Core CPI, which excludes fresh food, decelerated from 3.7% yoy to 3.3% yoy, in line with expectations. While still above the BoJ’s 2% target — where it's been since April 2022 — the moderation suggests waning energy cost pressures. Headline CPI also dipped to 3.3% from 3.5% in May.
However, underlying price pressures remain sticky. The core-core CPI, which excludes both fresh food and energy, rose from 3.3% yoy to 3.4% yoy, highlighting persistent inflation in services and food. Services inflation ticked up from 1.4% yoy to 1.5% yoy. Food prices excluding fresh items surged 8.2% yoy, up from 7.7% yoy. Rice inflation eased marginally but remains historically elevated at 101.7% yoy.
USD/CHF Mid-Day Outlook
Daily Pivots: (S1) 0.8011; (P) 0.8037; (R1) 0.8071; More….
Intraday bias in USD/CHF remains neutral for the moment. On the downside, break of 0.7946 minor support will indicate rejection by 0.8054 support turned resistance and retain near term bearishness. Retest of 0.7871 should be seen next and break will confirm larger down trend resumption. Nevertheless, sustained break of 0.8054 will suggest that rise from 0.7871 at least correcting the fall from 0.8475. Further rise should then be seen to 55 D EMA (now at 0.8146).
In the bigger picture, long term down trend from 1.0342 (2017 high) is still in progress. Next target is 100% projection of 1.0146 (2022 high) to 0.8332 from 0.9200 at 0.7382. In any case, outlook will stay bearish as long as 0.8475 resistance holds.
Dollar Index Remains Constructive, Weekly Close Eyed for Fresh Signal
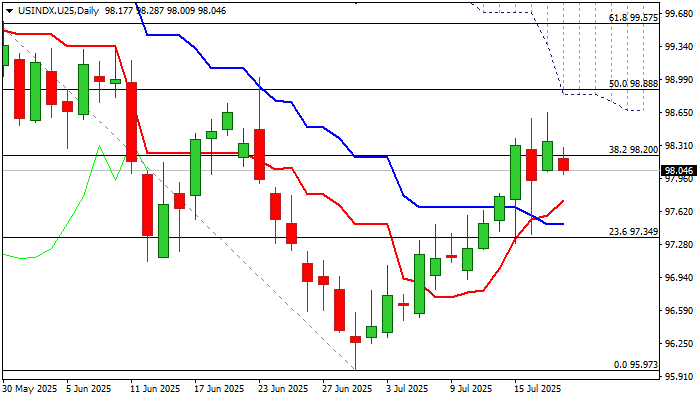
The dollar index keeps overall firm tone and heading for the second straight weekly gain, with some important technical barriers being cracked this week.
However, situation on daily chart indicates that bulls might be running out of steam, after pivotal Fibo barrier at 98.20 (38.2% of 101.80/95.97) has been broken, but fresh upside attempts were repeatedly capped by falling 55DMA (98.56).
Daily technical studies are mixed as positive momentum is strong and daily Tenkan / Kijun-sen formed a bull cross, but the action is weighed by falling daily cloud.
Our focus will be on today’s closing, with weekly close above 98.20 Fibo level to confirm positive signal and keep bulls in play for renewed attempt through 55DMA and attack at next key obstacles at 98.84/88 (50% retracement / daily Ichimoku cloud bases).
Conversely, closing below 98.20 would generate initial bearish signal (bull-trap) and keep the downside vulnerable.
Res: 98.28; 98.56; 98.88; 99.35.
Sup: 98.03; 97.66; 97.28; 96.81.
Japan’s Core CPI Cools as Expected
The Japanese yen is showing little movement on Friday. In the North American session, USD/JPY is trading at 148.69, up 0.06% on the day. On the data calendar, Japan's inflation rate eased in June. It's a light day in the US, highlighted by UoM consumer sentiment and inflation expectations.
Japan's core CPI eases to 3.3%
Inflation in Japan fell in June as expected and the yen is showing little movement today. Headline CPI dropped to 3.3% y/y from 3.5% in May, matching the consensus. This was the lowest level since Nov. 2024, as prices for electricity and gasoline rose more slowly in June. Food prices were up 7.2%, the most since March, as rice prices soared 100%. Monthly, CPI eased to 0.1%, down from 0.3% in May. Core inflation, which excludes fresh food but includes energy, fell to 3.3% from 3.7%, in line with the consensus and the lowest pace since March.
The inflation numbers come just before an election for Japan's Upper House of Parliament on Sunday. The ruling coalition is in danger of losing its majority, and if that happens, it will likely impact yields and the yen next week.
The Bank of Japan meets next on July 31 and is expected to continue its wait-and-see approach and hold interest rates. The BoJ hiked rates in January but hopes for a series of rate increases were dashed after US President Trump promised and delivered tariffs on many US trading partners, including Japan.
Trade talks between the US and Japan have bogged down and Trump has threatened to hit Japan with 25% tariffs if an agreement isn't reached by Aug. 1. In this uncertain environment, the BoJ isn't likely to raise interest rates.
USD/JPY Technical
- USD/JPY is testing resistance at 148.66. Above, there is resistance at 1.4882
- 148.44 and 148.28 are the next support levels

USDJPY 4-Hour Chart, July 18, 2025
Gold Ends the Week in Decline
Gold remained below $3,340 per ounce this week, on track to close in negative territory for the first time in three weeks. The downward pressure followed stronger-than-expected US economic data, which reduced expectations of an imminent interest rate cut by the Federal Reserve.
June’s retail sales significantly outperformed forecasts, while initial jobless claims dropped to a three-month low – further evidence of the US economy’s resilience despite ongoing trade tensions.
In response, Adriana Kugler, a member of the Federal Reserve’s Board of Governors, suggested that maintaining the current interest rate in the near term would be prudent. Meanwhile, Mary Daly, President of the Federal Reserve Bank of San Francisco, still anticipates two rate cuts before year-end.
Gold continues to benefit from demand for defensive assets amid escalating trade and geopolitical risks. Former US President Donald Trump has announced plans to notify more than 150 trading partners of impending tariffs, heightening uncertainty in global trade.
Additionally, rising geopolitical tensions worldwide reinforce gold’s appeal as a hedge against instability, thereby ensuring its role as a key tool for wealth preservation.
Technical Analysis: XAU/USD
H4 Chart:
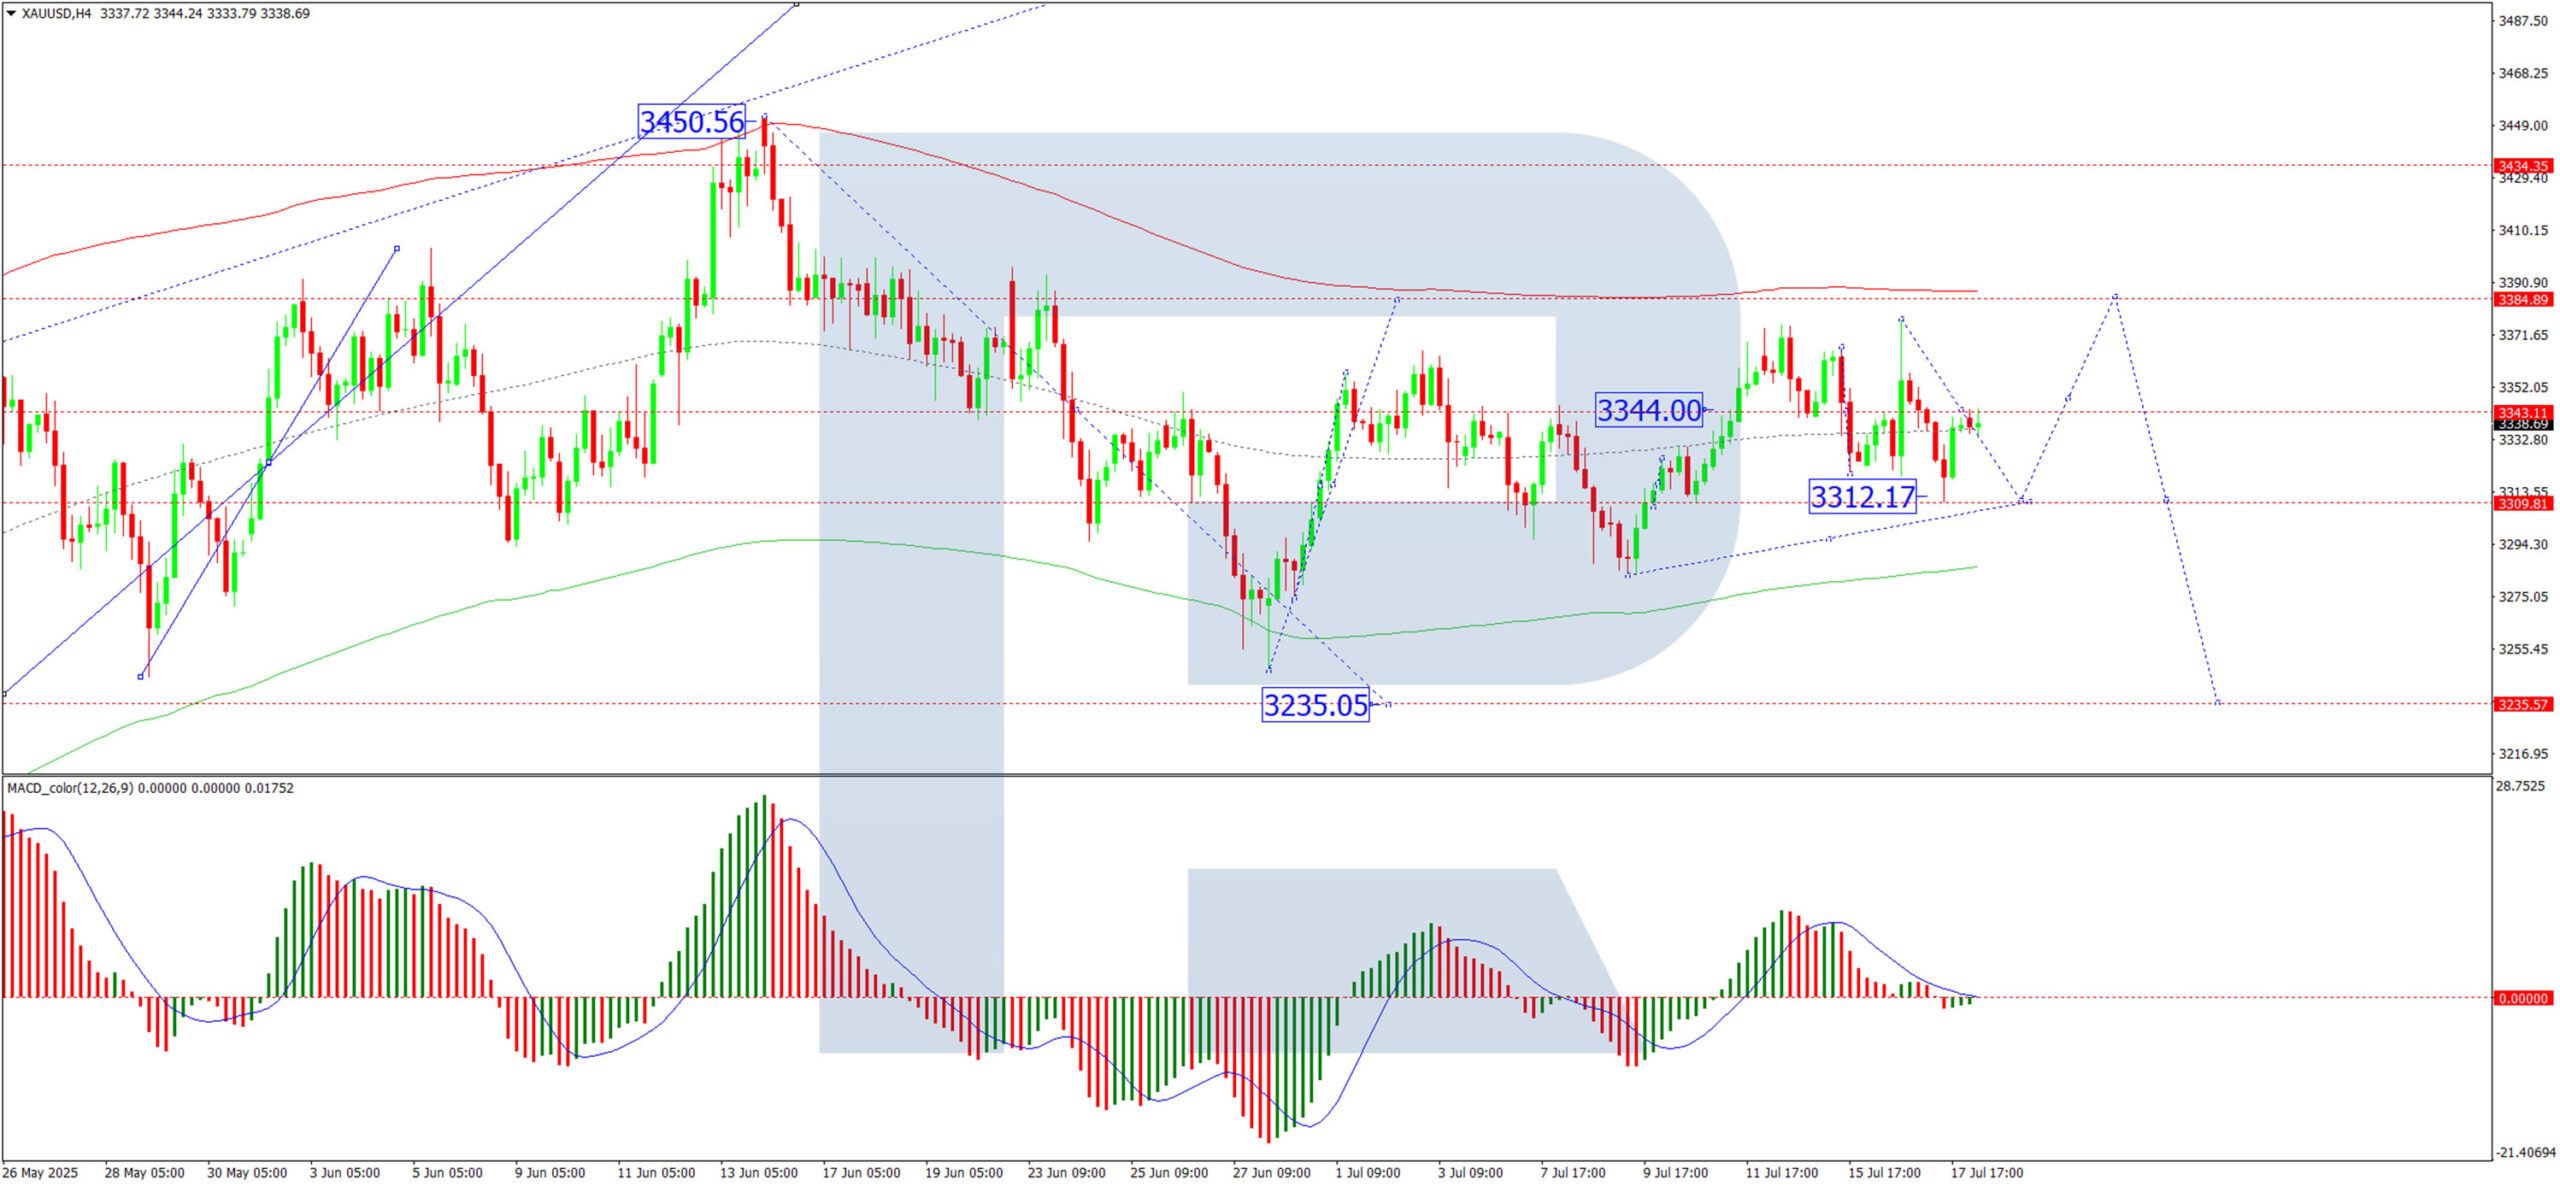
The XAU/USD pair is consolidating around $3,344 on the H4 chart, with the current range extending downward to $3,312. Today, prices have retested $3,344, and we anticipate further consolidation near this level.
- Bullish scenario: a breakout above $3,344 could trigger an upward wave towards $3,384
- Bearish scenario: a downward breakout may lead to a decline towards $3,235
The MACD indicator supports this outlook, with its signal line above zero and pointing firmly upward.
H1 Chart:
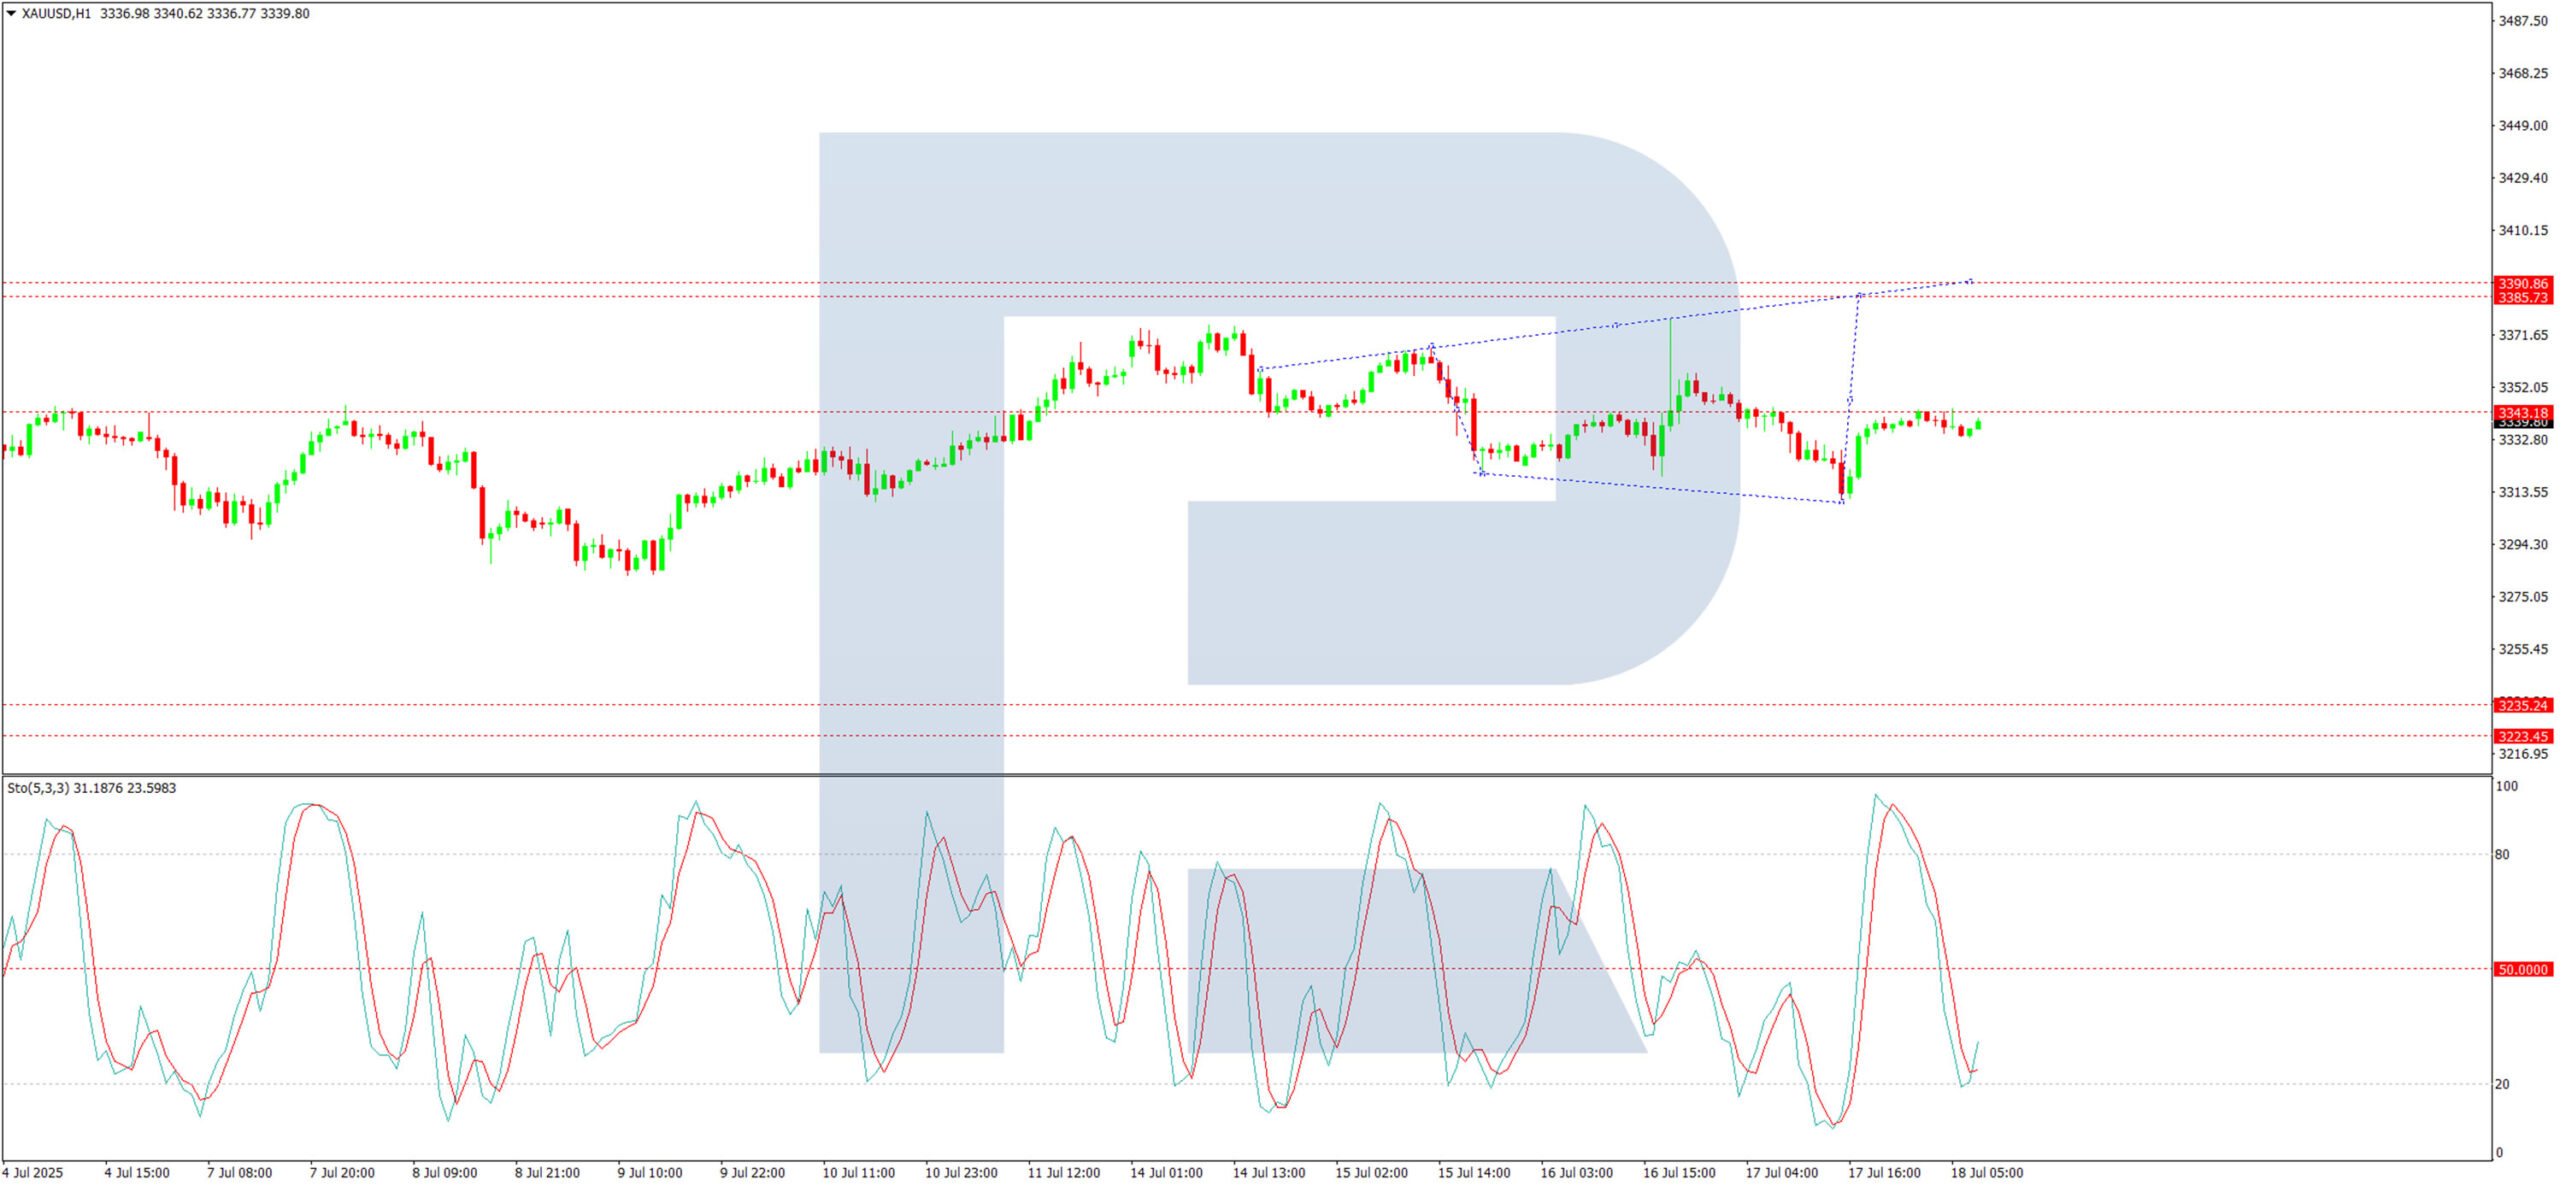
On the H1 chart, the market completed a decline wave to $3,310 before rebounding to $3,344, effectively returning to the consolidation range’s midpoint. Currently, trading lacks a clear directional bias, with equal potential for further gains or losses.
- Upside potential: a breakout above $3,344 may extend gains towards $3,384
- Downside risk: a drop below the range could see a downward wave towards $3,235
The Stochastic oscillator aligns with this view, as its signal line has risen from 20 and is now trending upward towards 80.
Conclusion
Gold faces short-term bearish pressure from robust US economic data, but long-term support persists due to trade uncertainties and geopolitical risks. Traders should monitor key technical levels for breakout opportunities in either direction.
US Dollar Index (DXY) Chart Analysis
The addition of the US Dollar Index (DXY) to FXOpen’s suite of instruments offers traders potential opportunities. This financial instrument:
→ serves as a measure of the overall strength of the US dollar;
→ is not tied to a single currency pair but reflects the value of the USD against a basket of six major global currencies, including the EUR, JPY, and GBP;
→ allows traders to capitalise on price fluctuations in the currency market;
→ is used in more advanced strategies for hedging risks in portfolios sensitive to sharp movements in the US dollar.
In today’s environment of heightened volatility, this instrument becomes particularly valuable. The active stance of US President Donald Trump — through the implementation of trade tariffs, sanctions, and unpredictable geopolitical rhetoric — gives traders even more reason to closely monitor the DXY chart.
Technical Analysis of the DXY Chart
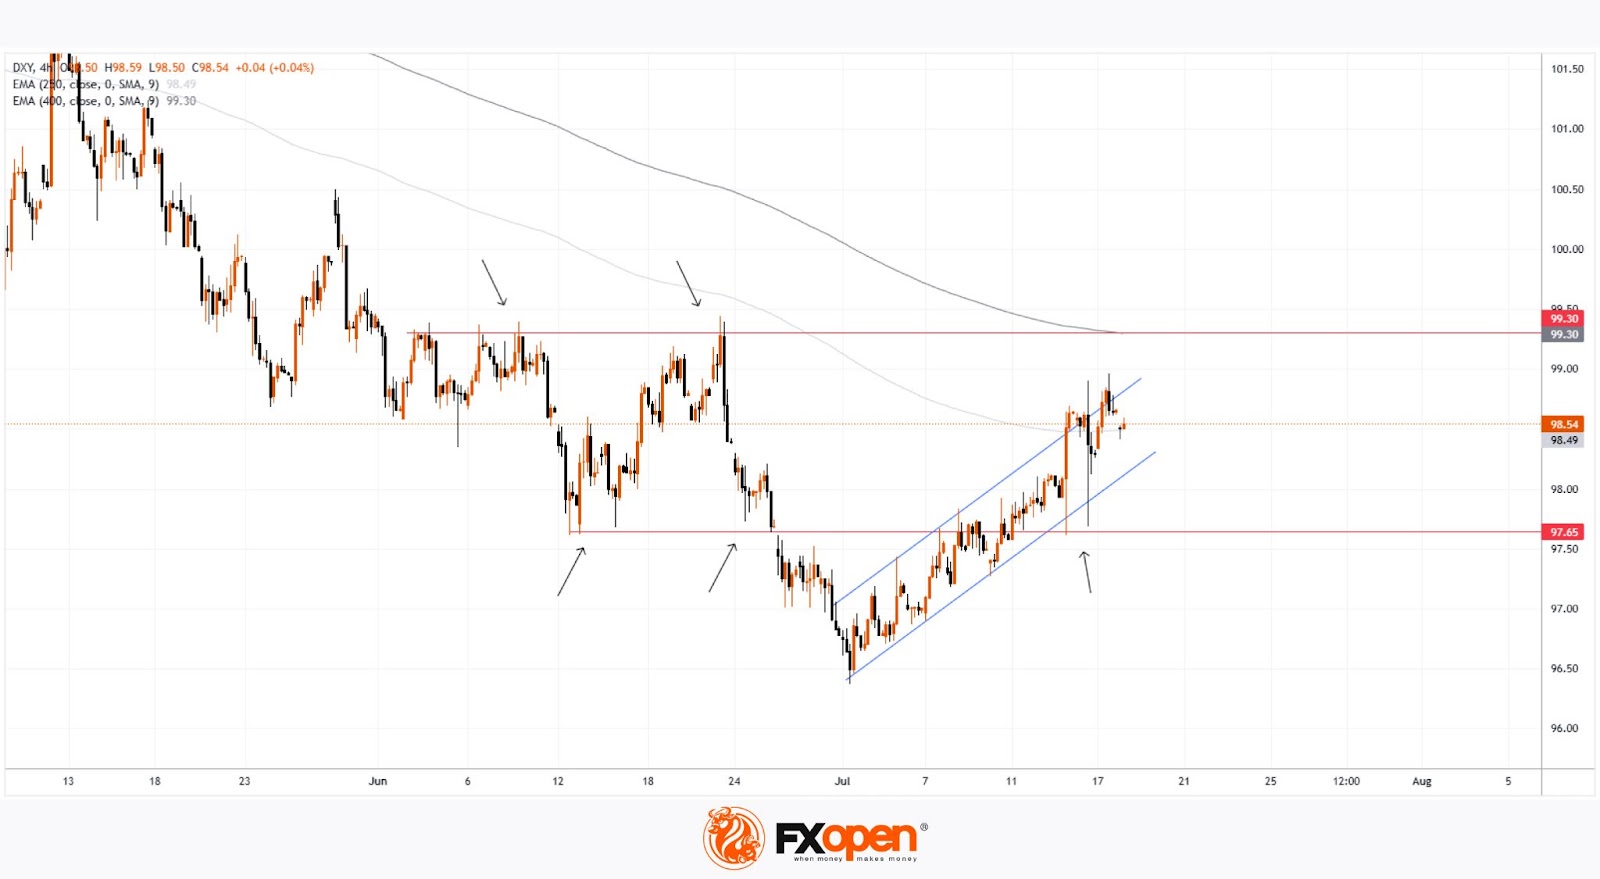
Moving averages show that the US Dollar Index displayed a predominantly bearish trend during the first half of 2025.
However, the picture shifted in July: the index began rising steadily (already up approximately +1.9% since the beginning of the month), highlighted by the blue ascending trend channel.
This suggests that the DXY may have found support following a prolonged decline, and a shift in market sentiment could be underway: after a bearish phase, a period of consolidation may follow. If this scenario plays out, we could see DXY oscillating between the 97.65 and 99.30 levels – both of which show signs of acting as support and resistance (as indicated by the arrows).
Trade global index CFDs with zero commission and tight spreads. Open your FXOpen account now or learn more about trading index CFDs with FXOpen.
This article represents the opinion of the Companies operating under the FXOpen brand only. It is not to be construed as an offer, solicitation, or recommendation with respect to products and services provided by the Companies operating under the FXOpen brand, nor is it to be considered financial advice.
Nikkei 225 Forecast: Start of New Medium-Term Bullish Trend Amid Rising JGB Yields
Key takeaways
- Nikkei 225 rallies 34% from April lows to June highs, driven partly by post-tariff optimism despite Japan being targeted by US trade measures.
- Nikkei 225 outperforms globally, gaining 28% since 7 April, trailing only South Korea’s KOSPI and ahead of the Hang Seng and S&P 500.
- Rising 30-year JGB yields (+45 bps) spark a -4.2% Nikkei 225 pullback due to fiscal concerns ahead of Japan’s 20 July election.
- Strong economic & earnings data: Citigroup Surprise Index and Earnings Revisions Index support bullish fundamentals for Japanese stocks.
- Bullish technical breakout from flag pattern signals potential for Nikkei 225 to challenge resistance at 40,620 and 42,500/890.
This is a follow-up analysis of our prior report, “Nikkei 225 Outlook: Negative sentiment overshadows positive fundamentals” published on 4 March 2025.
Since our last publication, the price actions of the Japan 225 CFD Index (a proxy for the Nikkei 225 futures) have staged the expected corrective decline and retested the 5 August 2024 ‘s major swing low of 30,390 on 7 April 2025.
Thereafter, the Japan 225 CFD Index has staged a magnificent rally of 34% from the 7 April 2025 low to the 30 June 2025 high ex-post US “Liberation Day” in early April, where US President Trump announced a slew of higher reciprocal tariffs on the respective US trading partners, which include Japan, that has been hit with a 24% levy (now at 25% with an extended deadline of 1 August for negotiation)
Japan’s Nikkei 225, one of the best-performing stock indices
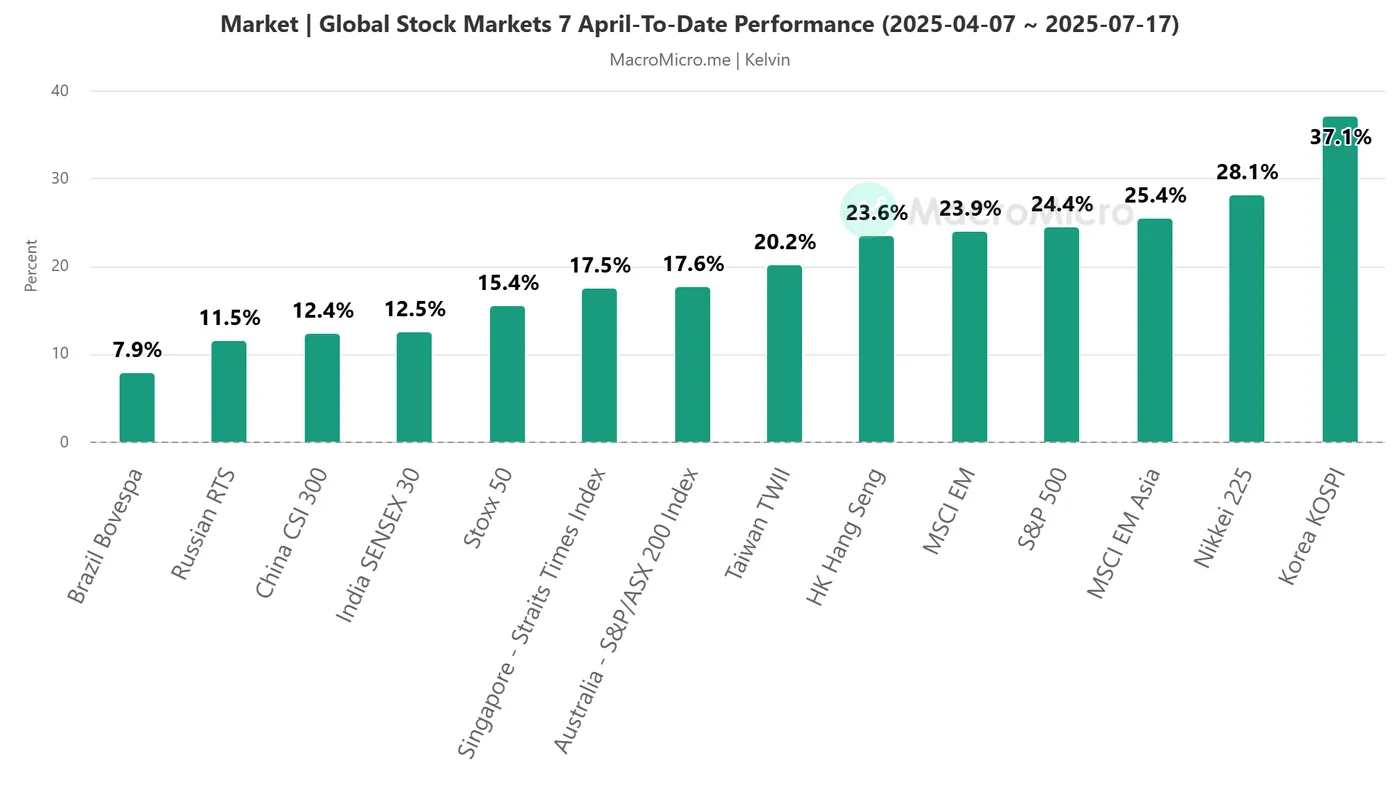
Fig 1: Major stock indices performances since 7 Apr 2025 till 17 Jul 2025 (Source: MacroMicro, click to enlarge chart)
On a closing level basis since 7 April, the Nikkei 225 is one of the top-performing Asia Pacific stock markets as of 17 July with a gain of 28%, just trailing behind the top performer, South Korea’s KOSPI’s return of 37%, and outperformed the Hong Kong’Hang Seng Index (24%), and US S&P 500 (24%). So far, the Nikkei 225 has yet to break above its current all-time high level printed in July 2024 (see Fig 1).
A recent spike in the 30-year JGB bond yield has created headwinds
The recent price actions of the Japan 225 CFD Index have staged a corrective decline of -4.2% from 30 June to 16 July, in line with the recent uptick seen on the long-term 30-year Japanese Government Bond (JGB) yield, where it rose by 45 basis points (bps) from the 4 July low of 2.75% to retest its recent all-time high of 3.2% (printed in May) on 15 June.
Japan’s surge in 30-year JGB yield reflects market anxiety over the upcoming upper-house election on Sunday, 20 July, and the spectre of expansive fiscal policies. With state debt near 250% of GDP and institutional demand skewed away from longer-term JGBs, the surge underscores a fragile balance between Japan’s fiscal commitments and monetary stance. If election outcomes favour populist spending, Japan risks rising borrowing costs and possible credit rating downgrades, forcing fiscal restraint or central bank intervention.
Other supportive fundamental factors can create a tailwind buffer
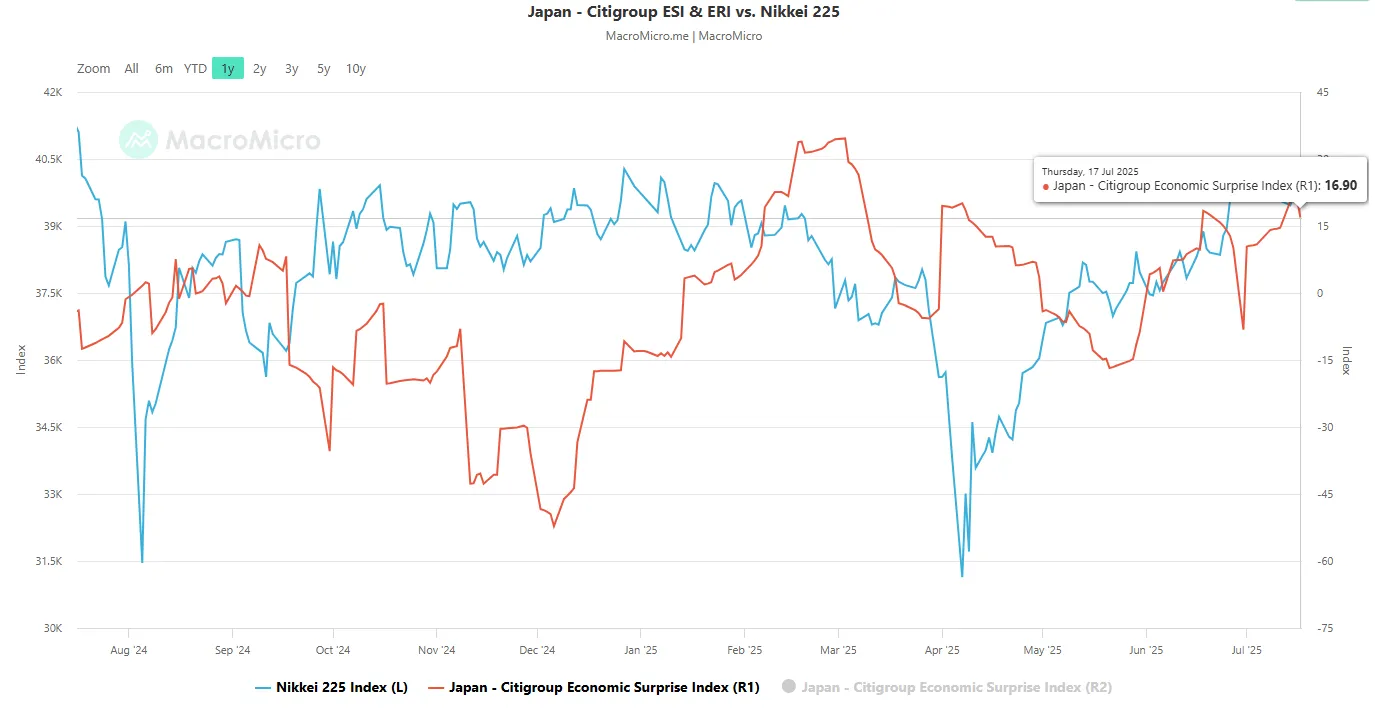 Fig 2: Japan’s Citigroup Economic Surprise Index as of 17 Jul 2025 (Source: MacroMicro, click to enlarge chart)
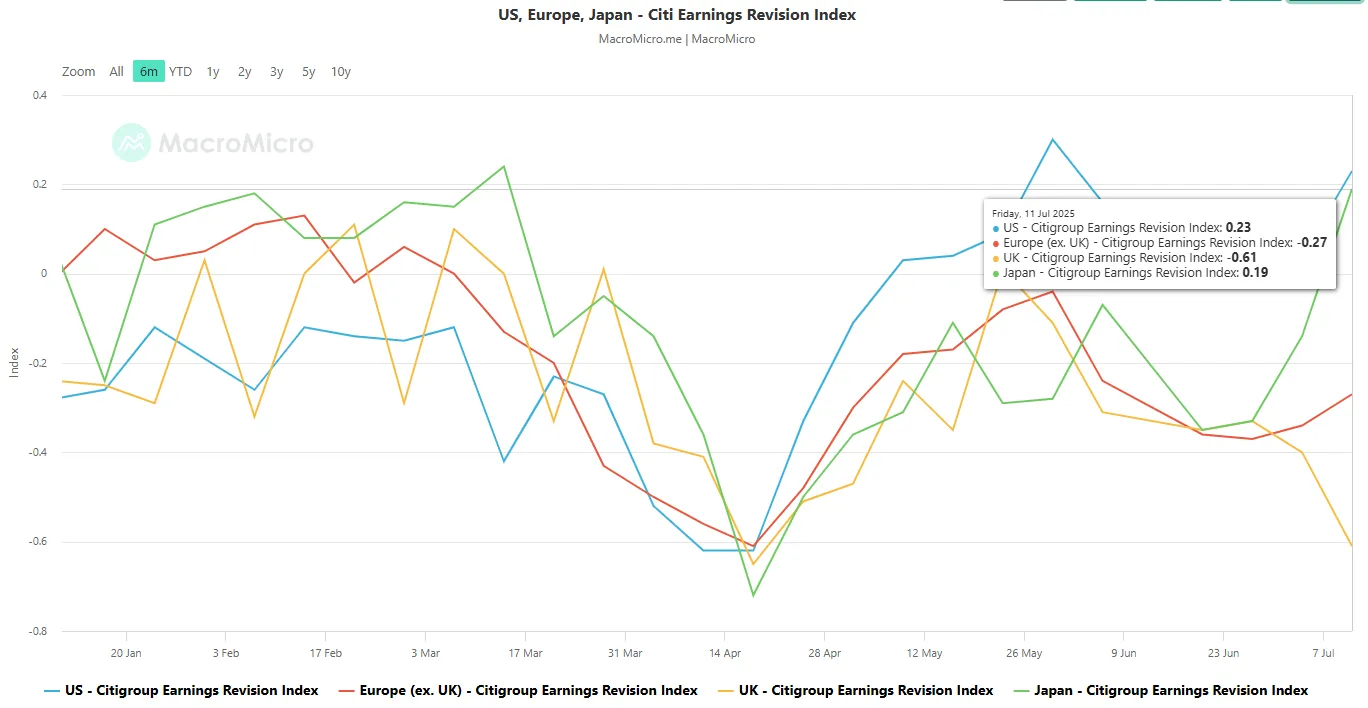 Fig 3: Japan’s Citigroup Earnings Revision Index vs US, UK & Europe as of 11 Jul 2025 (Source: MacroMicro, click to enlarge chart)
There are still supportive fundamental elements that can support further potential upside in the Nikkei 225 despite the ongoing rise in the longer-term JGB yields.
The Citigroup Economic Surprise Index for Japan has been on a steady increase since the 30 June 2025 reading of -8.20 to hit a recent level of 16.90 on Thursday, 17 July. The index is the sum of the difference between the actual value of various economic data and their consensus forecast. If the index is greater than zero and rising, it means that the overall economic performance in Japan is generally better than expected, which in turn, supports a potential strengthening in the Nikkei 225 (see Fig 2).
Secondly, the Japanese stock market has seen the steepest analysts’ earnings upgrades on average since 27 June, versus other regions (US, UK, Europe). Japan’s Citigroup Earnings Revision Index has risen significantly from 27 June’s print of -0.33 to the current level of 0.19 as of 11 July, another potential tailwind to support a bullish Nikkei 225 (see Fig 3).
Technical factors are suggesting a potential multi-month bullish trend for the Nikkei 225
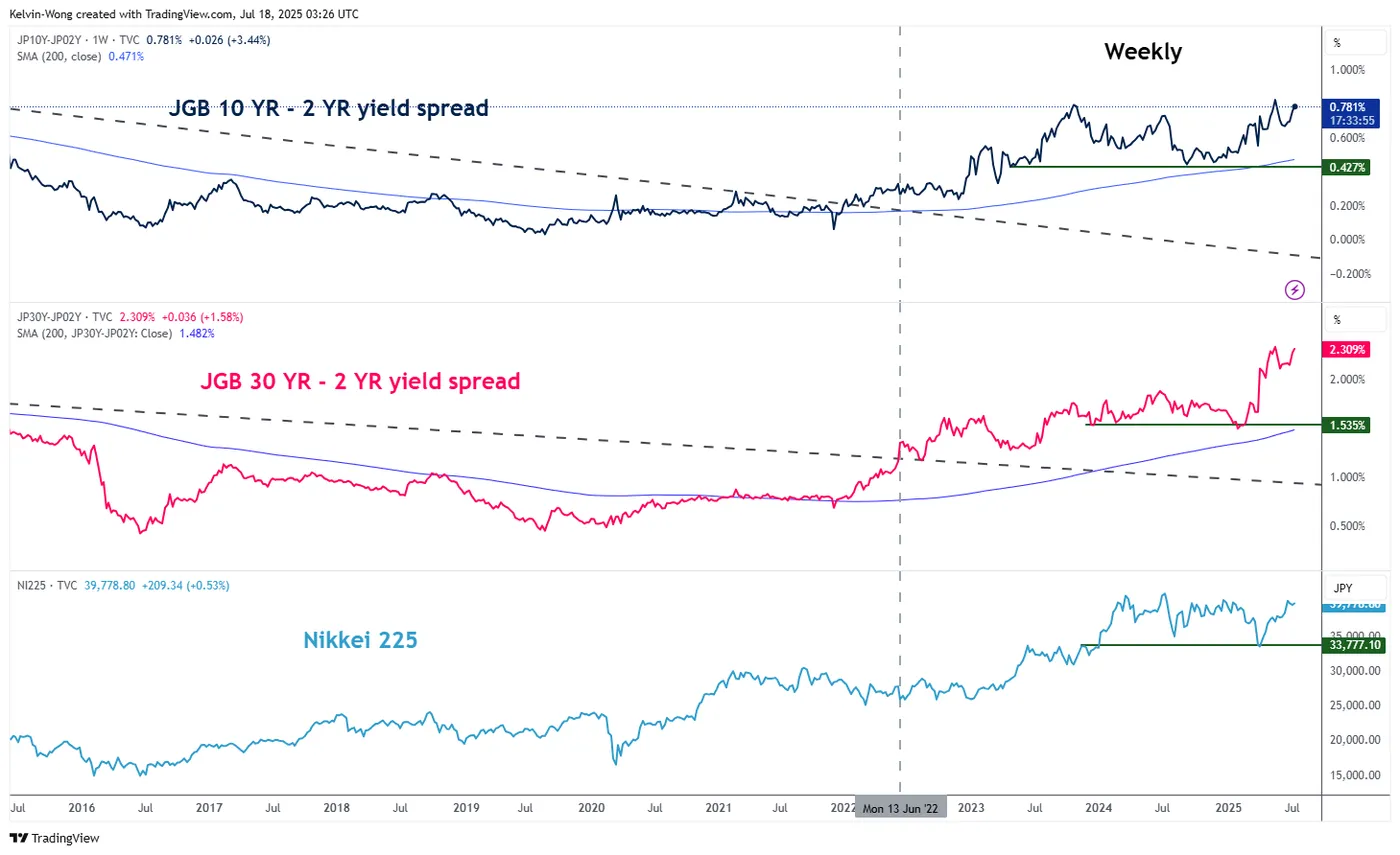
Fig 4: JGB yield curves (30-YR/2-YR & 10-YR/2-YR) major trends as of 18 Jul 2025 (Source: TradingView, click to enlarge chart)
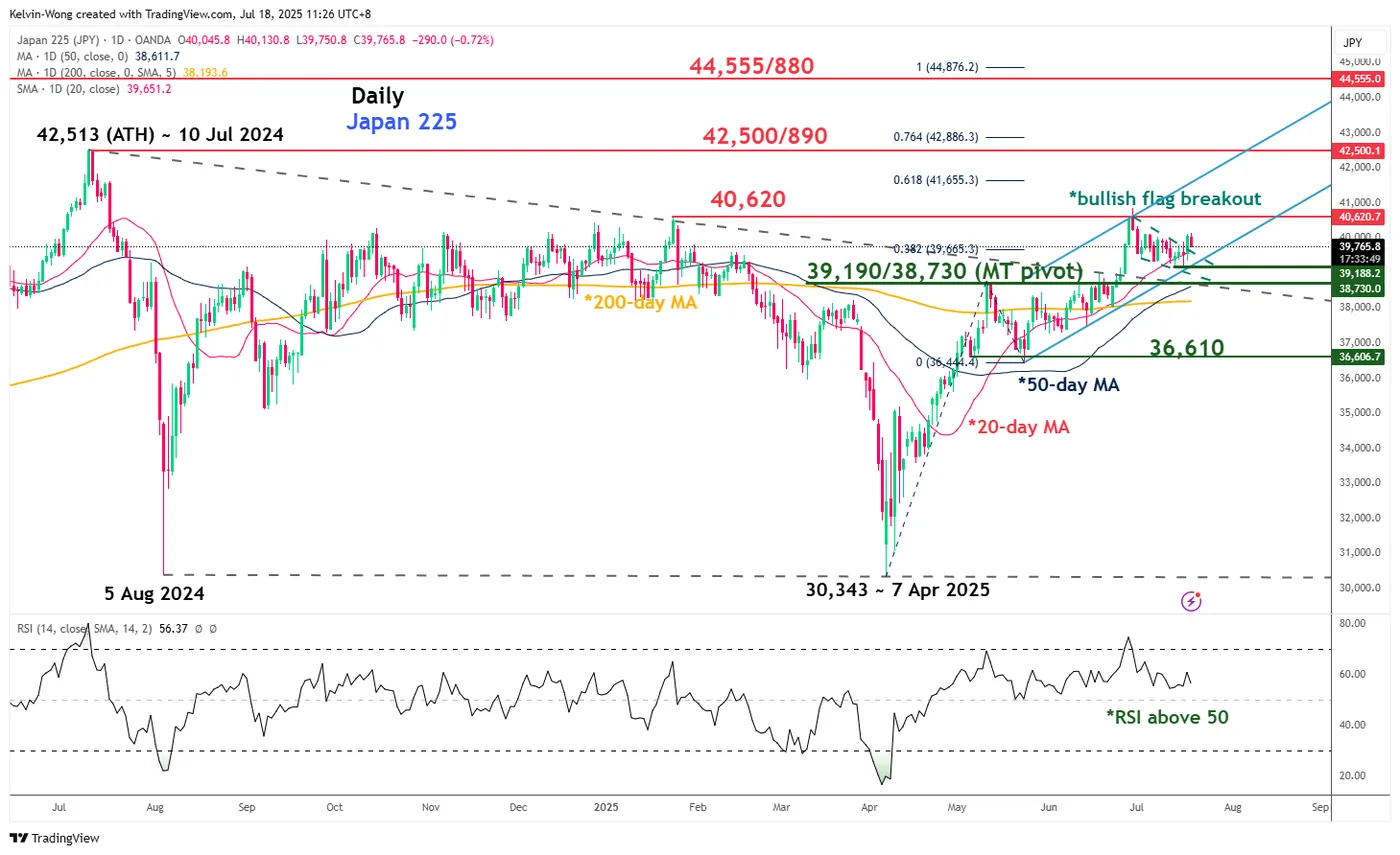
Fig 5: Japan 225 CFD Index medium-term & major trends as of 18 Jul 2025 (Source: TradingView, click to enlarge chart)
A steepening of the JGB yield curves (30-year minus 2-year and 10-year minus 2-year) coupled with supportive fundamentals, as highlighted earlier, is likely to create another tailwind for the Nikkei 225.
The major bullish breakout (steepening conditions) of the JGB yield curves since June 2022 has a direct correlation with the movements of the Nikkei 225, and the major uptrend phases of the JGB yield curves remain intact so far, in turn, may trigger a positive feedback loop into the Nikkei 225 (see Fig 4)
In addition, the daily time frame technical chart of the Japan 225 CFD Index has staged a bullish breakout from a bullish continuation flag configuration on Thursday, 17 July, after a retest on its rising 20-day moving average on Monday, 14 July (see Fig 5).
These observations suggest that a medium-term uptrend phase is evolving in the Japan 225 CFD Index. Watch the 39,190/38,730 key medium-term pivotal support zone for the start of a potential fresh impulsive up move sequence for the next medium-term resistances to come in at 40,620 and 42,500/890 (current all-time high and Fibonacci extension).
However, failure to hold at 38,739 invalidates the bullish scenario to kickstart a medium-term corrective decline sequence to expose the next medium-term support at 36,610.