Sample Category Title
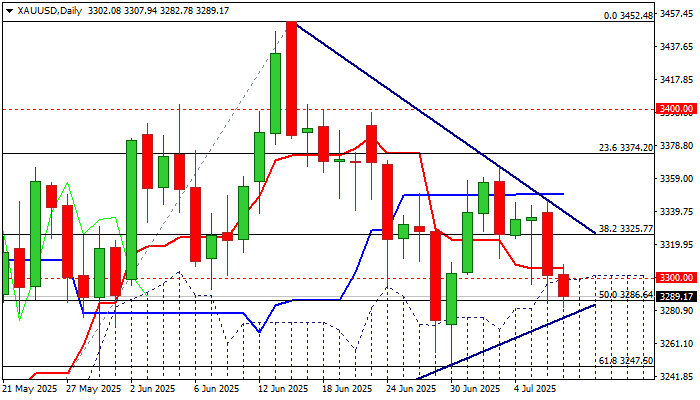
GOLD – Bears Tighten Grip and Probe Again into Daily Cloud
Gold remains in red for the second consecutive day, pressured by stronger dollar on risk aversion as uncertainty over US tariffs rises.
Bears probe again through pivotal support at $3300 (psychological / rising daily cloud top) in attempts to sustain break lower, after cloud contained several attacks recently.
Today’s action so far hold in the cloud, as bears cracked 50% retracement of $3120/$3452 ($3286) and eye next significant support at $3277 (triangle support line).
Daily studies are weak (Tenkan/Kijun-sen in bearish setup / negative momentum is strengthening) and supportive for further easing, with loss of $3277 trendline support to risk attack at key supports at $3247 (Jun 30 higher low/ Fibo 61.8%) and $3228 (daily cloud base).
Conversely, another failure to register daily close within the cloud, would ease immediate downside threats, but regain of $3225/36 (broken Fibo 38.2% / upper triangle boundary) will be required to sideline near-term bears and shift focus higher.
Fed minutes (due later today) are in focus for more details about Fed’s short-term rate outlook.
Res: 3300; 3308; 3325; 3338
Sup: 3277; 3247; 3228; 3205
China’s PPI Slides, Australian Dollar Steady
The Australian dollar is almost unchanged on Wednesday. In the European session, AUD/USD is trading at 0.6532, up 0.03% on the day.
China's PPI declines 3.6%
China's producer price index surprised on the downside in June, with a steep 3.6% y/y decline. This was below the May decline of 3.3% and the consensus of -3.2%. China has posted producer deflation for 33 successive months and the June figure marked the steepest slide since July 2023. Monthly, PPI declined by 0.4%, unchanged over the past three months.
The soft PPI report was driven by weak domestic demand and the continuing uncertainty over US tariffs. The lack of consumer demand was reflected in the weak CPI reading of 0.1% y /y, the first gain in four months. Monthly, CPI declined by 0.1%, following a 0.2% drop in May. There was a silver lining as core CPI rose 0.7% y/y, the fastest pace in 14 months.
The uncertainty over US President Trump's tariff policy continues to perplex the financial markets. Trump had promised a new round of tariffs against a host of countries on July 9 but he has delayed that deadline until August 1.
China, the world's second-largest economy after the US, has taken a hit from US tariffs, as China's exports to the US are down 9.7% this year, However, China has mitigated much of the damage as China's exports to the rest of the world are up 6%. There is a trade truce in effect between the two countries but the bruising trade war will continue to dampen US-China trade.
FOMC minutes - what will be Powell's tone?
With no tier-1 events out of the US today, the FOMC minutes of the June meeting will be on center stage. The Fed held rates at that meeting and Fed Chair Powell, who has taken a lot of heat from Donald Trump to cut rates, defended his wait-and-see-attitude, citing the uncertainty that Trump's tariffs are having on US growth and inflation forecasts.
AUDUSD Technical
- AUD/USD tested resistance at 0.6532 earlier. Above, there is resistance at 0.6543
- 0.6519 and 0.6508 are the next support levels
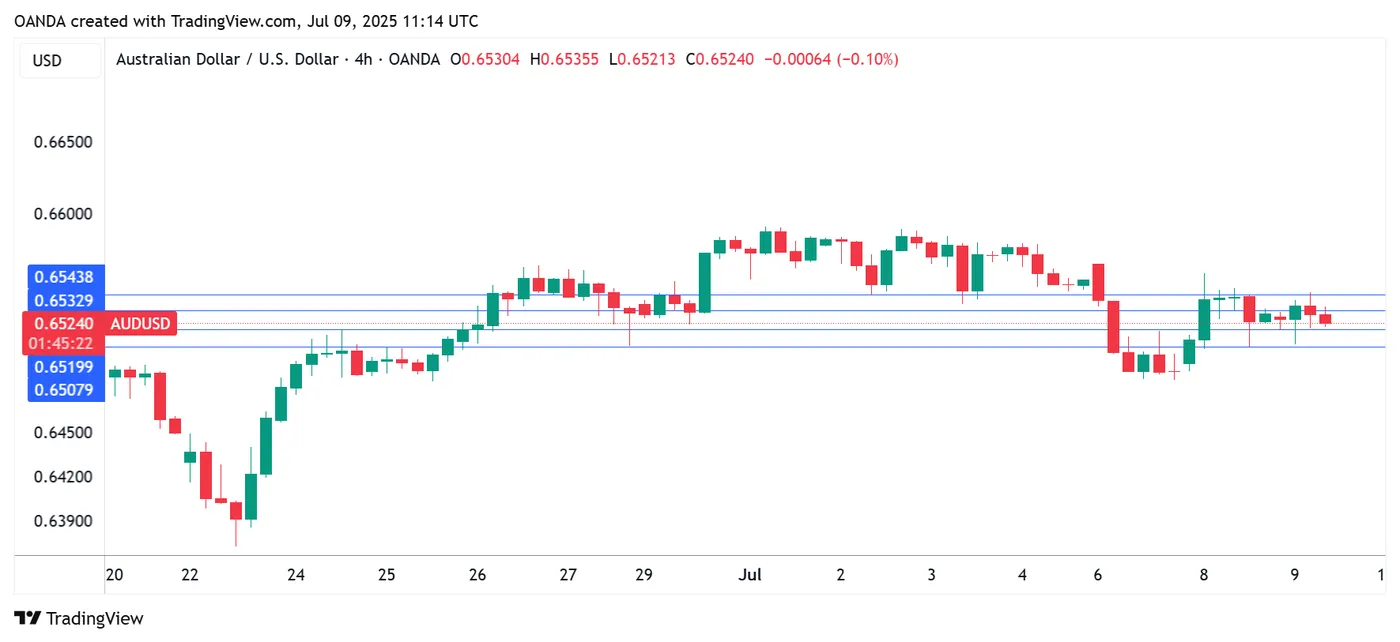
AUDUD 4-Hour Chart, July 9, 2025
RBNZ Rate Hold, Copper Volatility, DAX Makes a Move Toward Fresh Highs
Chinese stocks are set to hit their highest level in three years as investors hope for new steps to fight deflation and boost the economy. Meanwhile, copper prices dropped in London after President Donald Trump issued a new tariff warning.
Asian Market Wrap
The Shanghai Stock Exchange Composite Index rose 0.4%, reaching its highest level this year and the best close since January 2022. The CSI 300 index, a key measure of Chinese stocks, is also set for its highest close since December. Data showed that China’s factory prices continued to fall for the 33rd month, but consumer prices surprisingly increased in June.
In other news, Asian stocks dipped slightly by 0.1% as investors avoided risky moves after Trump escalated trade tensions.
China’s weak inflation is putting pressure on policymakers to introduce more stimulus to break the cycle of falling prices, profits, and wages. Investors are now looking to Beijing’s July Politburo meeting for stronger economic support after recent efforts to cut factory overcapacity.
RBNZ Pauses Rate Cuts, NZD Slips Toward Two-Week Lows
The New Zealand dollar dropped to 0.598, near a two-week low, after the Reserve Bank of New Zealand paused its rate cuts but hinted at more reductions if inflation slows.
The central bank kept its cash rate at 3.25%, following six cuts since August 2024. It’s being cautious due to 2.5% domestic inflation and global trade tensions that could raise prices.
However, the bank expects to lower rates further if inflation eases, and markets predict at least one more cut this year due to economic weakness.
European Open
European stocks edged up on Wednesday, boosted by defense shares, as investors watched for progress on a US-EU trade deal.
The STOXX 600 index rose 0.2% to 546.94 points. Defense stocks gained 1.1%, banks climbed nearly 1%, and energy shares were up 0.8%.
President Trump hinted at announcing EU export tariffs soon, while reports suggest EU negotiators are close to a deal with higher tariffs than the UK.
EssilorLuxottica shares jumped 5.1% after Meta reportedly acquired a 3% stake in the company.
On the FX front, The dollar rose 0.1% to 146.75 yen, hitting 147.19 earlier, marking a 1.5% weekly gain, the biggest since December. Japan, heavily reliant on exports, remains far from a trade deal, with its currency under pressure as talks stall and focus shifts to an upcoming election.
The euro stayed flat at 1.171 as the EU hopes to avoid U.S. tariffs and secure exemptions from the 10% baseline rate. The dollar index held steady at 97.60, while the British pound edged up to 1.36. The New Zealand dollar also rose slightly to 0.60.
Currency Power Balance
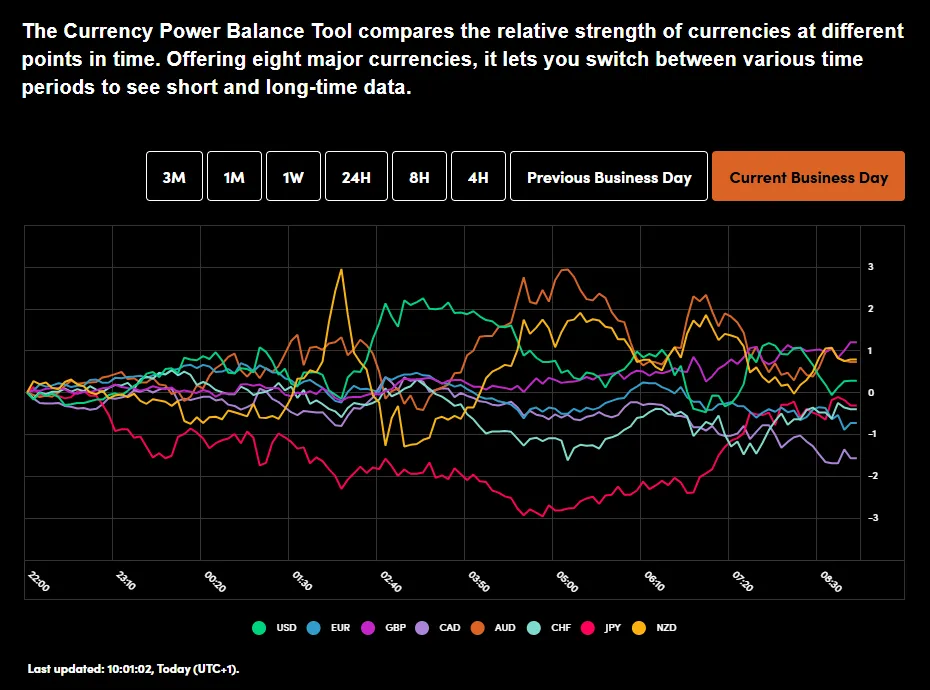
Source: OANDA Labs
Looking at commodities and Oil prices have recovered following a gap down over the weekend.
Gold struggled overnight and has failed to hold above the $3300/oz handle as optimism grows around trade deals. Interesting data from the World Gold Council yesterday which showed that Global Central Bank buying remains strong.
Global central banks' net gold purchases reached 20 tonnes in May, the highest in 3 months. This marks the 24th consecutive net monthly purchase.
Over the last year, central banks have bought an average of 27 tonnes of gold per month.
Economic Data Releases and Final Thoughts
Looking at the economic calendar, it remains a quiet one. The biggest events of the day will come from comments by Central Bank policymakers, with ECB and BoE policymakers on deck.
Later in the day we have the FOMC minutes as the Trump Administration continues to put pressure on the Fed publicly to cut rates.
Given the limited data releases I am expecting tariff and trade deal chatter to dominate matters today and for the majority of the week ahead.
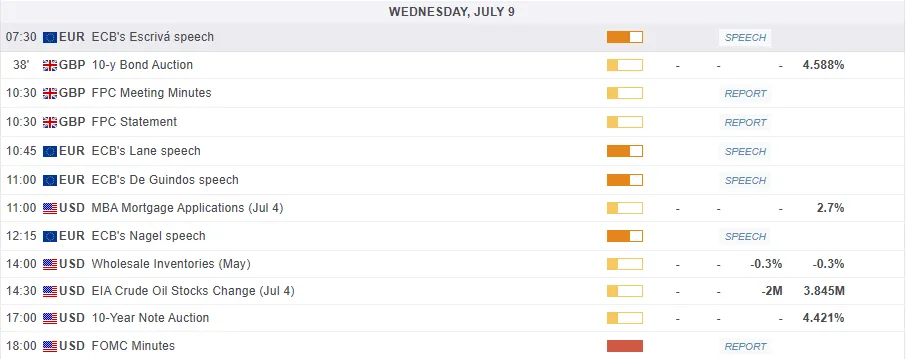
For all market-moving economic releases and events, see the MarketPulse Economic Calendar. (click to enlarge)
Chart of the Day - DAX Index
From a technical standpoint, the DAX has been moving higher this morning on optimism that the EU will strike a deal with the Trump administration.
The DAX is currently trading above the previous range high at 24330. A daily candle close above this level may lead to further upside.
Bulls do appear in control for now with trade talks ongoing.
A pullback to 24330 may provide would be bulls with potential long opportunities on an intraday basis. However, I would caution that without a daily candle close above the range (highlighted red/pink zone) a pullback toward the 24000 handle could materialize.
DAX Daily Chart, July 8. 2025
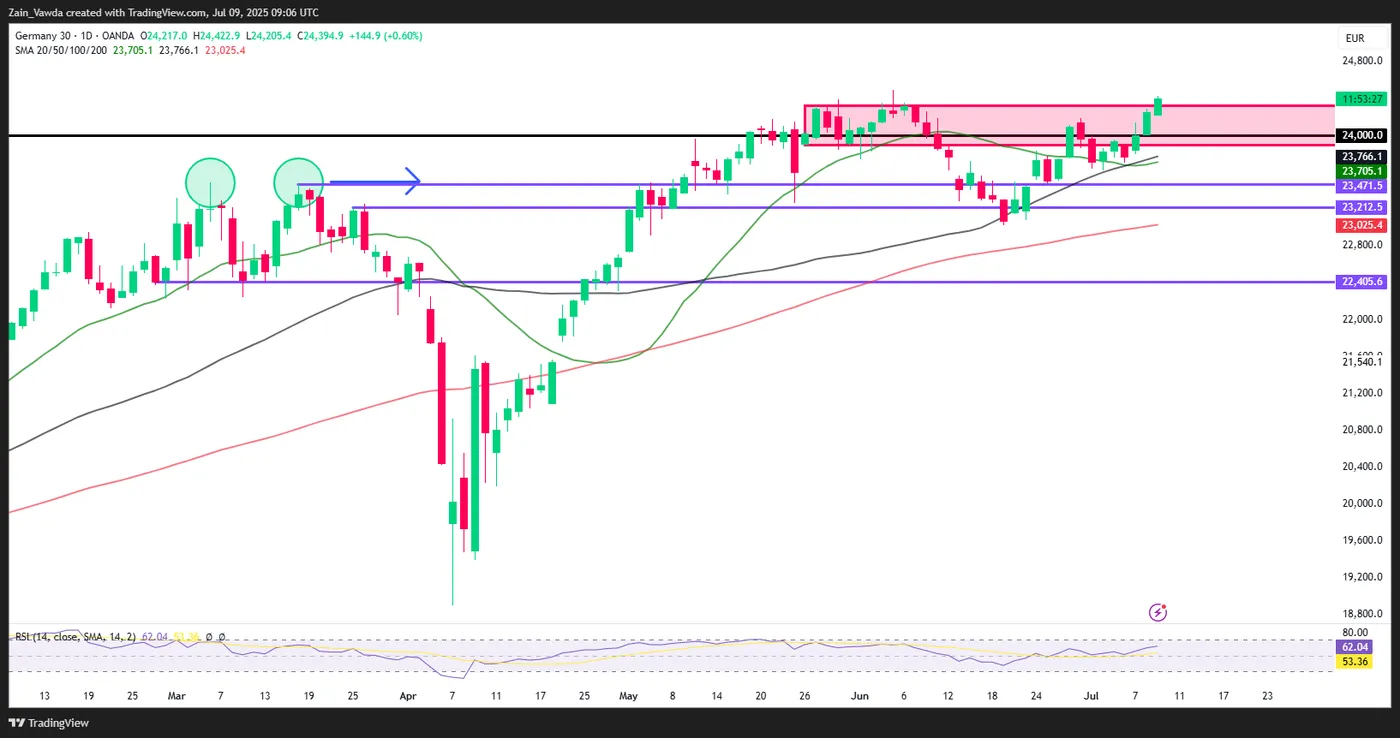
Source: TradingView.com (click to enlarge)
Support
- 24000
- 23727
- 23471
Resistance
- 24479
- 24500
- 24750
EUR/JPY Hits 12-Month High
As the chart indicates, the EUR/JPY pair has risen above ¥172 per euro — a level last seen in July 2024.
Since early June, the exchange rate has increased by approximately 5.6%. This upward movement is driven by a combination of factors, including:
→ Divergence in central bank policy: The European Central Bank’s key interest rate remains significantly higher than that of the Bank of Japan, making the euro more attractive in terms of yield compared to the yen.
→ US trade tariffs on Japan: The potential imposition of 25% tariffs by the United States on Japanese goods poses a threat to Japan’s export-driven economy, placing downward pressure on the national currency.
→ Eurozone expansion and consolidation: News of Bulgaria’s potential accession to the euro area is strengthening investor confidence in the single currency.
→ Weakness in the US dollar: As the US Dollar Index fell to its lowest level since early 2022 this July, demand for the euro has grown, positioning it as a key alternative reserve currency.
Can the rally continue?
Technical Analysis of EUR/JPY
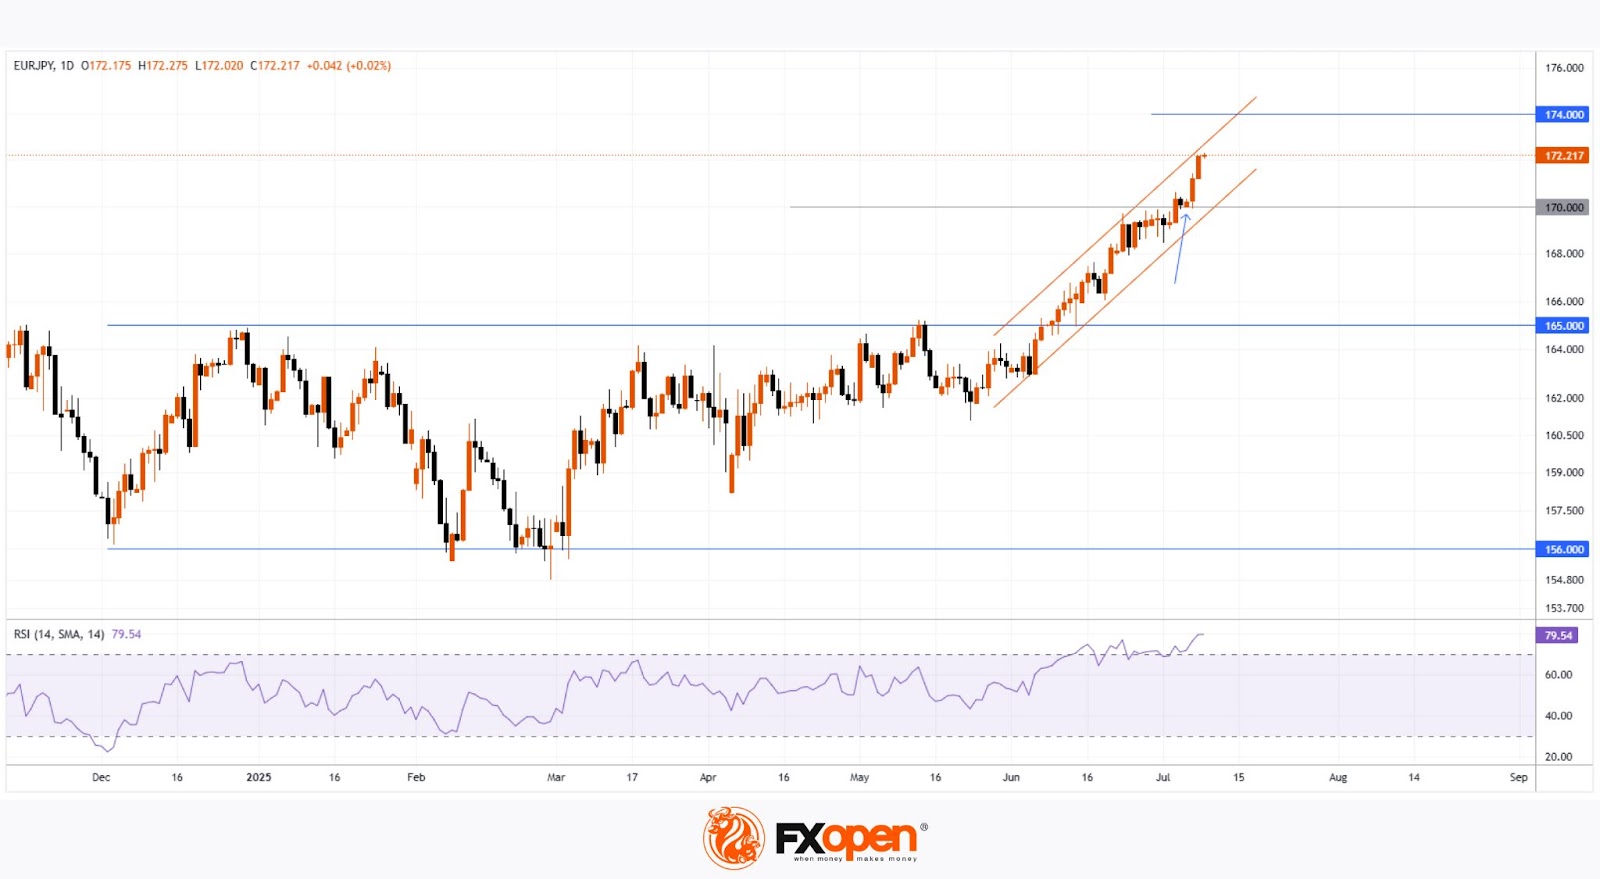
For several months, the pair traded within a range of approximately ¥156–165 per euro, but has recently broken above the upper boundary of this channel. Based on technical analysis, the width of the previous range implies a potential price target in the region of ¥174 per euro.
It is noteworthy that the rally gained momentum (as indicated by the arrow) following the breakout above the psychological threshold of 170, a sign of bullish market dominance. At the same time, the RSI has surged to a multi-month high, signalling moderate overbought conditions.
Under these circumstances, the market may be vulnerable to a short-term correction, potentially:
→ Towards the lower boundary of the ascending channel (shown in orange);
→ To retest the psychological support around ¥170.
That said, a reversal of the prevailing trend would likely require a significant shift in the fundamental backdrop — for example, progress towards a trade agreement between Japan and the United States.
Trade over 50 forex markets 24 hours a day with FXOpen. Take advantage of low commissions, deep liquidity, and spreads from 0.0 pips. Open your FXOpen account now or learn more about trading forex with FXOpen.
This article represents the opinion of the Companies operating under the FXOpen brand only. It is not to be construed as an offer, solicitation, or recommendation with respect to products and services provided by the Companies operating under the FXOpen brand, nor is it to be considered financial advice.
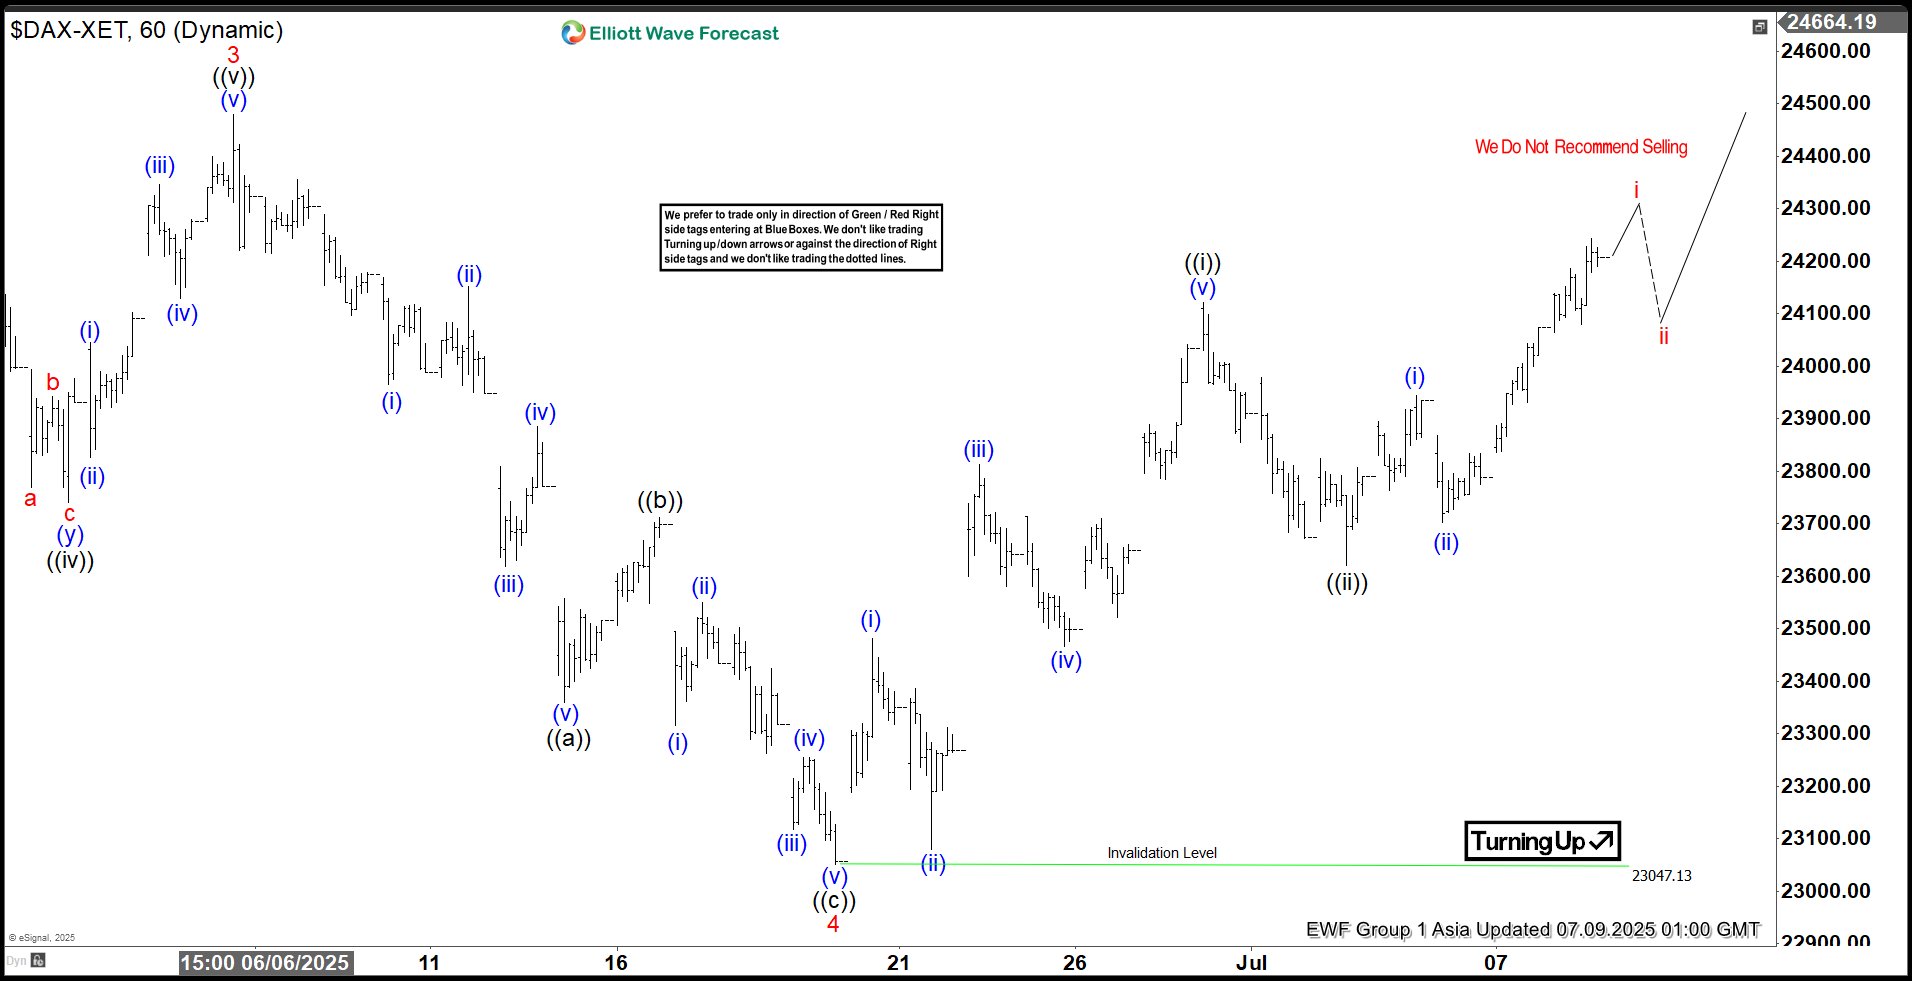
Elliott Wave Outlook: DAX Set to Rally Higher in Wave 5
Since April 7, 2025, the DAX Index has been advancing in a clear impulsive cycle, originating from a low that has set the stage for a structured upward movement. The initial advance, wave 1, concluded at 20468.43. It was followed by a corrective pullback in wave 2, which found support at 19384.39. The subsequent rally in wave 3 was robust, peaking at 24479.42, as depicted on the 1-hour chart. Wave 4 unfolded as a zigzag Elliott Wave pattern, characterized by a decline in wave ((a)) to 23360.16. A recovery in wave ((b)) took place to 23711.73, and a final dip in wave ((c)) to 23047.13, completing the corrective wave 4.
The Index then resumed its upward trajectory in wave 5, structured as an impulse in a lesser degree. From the wave 4 low, wave (i) reached 23481.97. A minor pullback in wave (ii) followed which ended at 23080.29. The rally then continued with wave (iii) peaking at 23812.79, a slight correction in wave (iv) to 23466.73, and the final leg, wave (v), concluding at 241200.82, marking the completion of wave ((i)).
A corrective wave ((ii)) found support at 23620.42, and the Index has since turned higher in wave ((iii)). As long as the pivot low at 23407.13 holds, the DAX is expected to extend its gains, with pullbacks likely finding support in a 3, 7, or 11 swing structure. This analysis suggests continued bullish momentum in the near term, with key support levels providing opportunities for further upside.
DAX 60-Minute Elliott Wave Technical Chart
DAX Elliott Wave Technical Video
https://www.youtube.com/watch?v=BBtvMboAusU
Gold Drops Below $3,300 as Fed Rate Forecasts Shift
Gold prices fell below 3,300 USD per troy ounce on Wednesday, extending losses after a 1% decline the previous day. The downward pressure stemmed from the Federal Reserve’s cautious stance, which partially offset concerns over escalating trade tensions.
US President Donald Trump dismissed any further delays to tariff hikes set for 1 August, announcing additional aggressive measures. These include a 50% duty on copper imports, potential 200% tariffs on pharmaceuticals, and a 10% levy on goods from BRICS nations.
Another key factor weighing on gold was the neutral Fed outlook regarding a rate cut in July. Last week’s strong US jobs report alleviated fears of an economic slowdown, reducing expectations of imminent monetary easing.
The new tariffs could exacerbate inflationary pressures in the US, potentially limiting the Fed’s room for future rate reductions.
Investors are now awaiting the June FOMC meeting minutes, due later today, for further clues on the central bank’s policy direction.
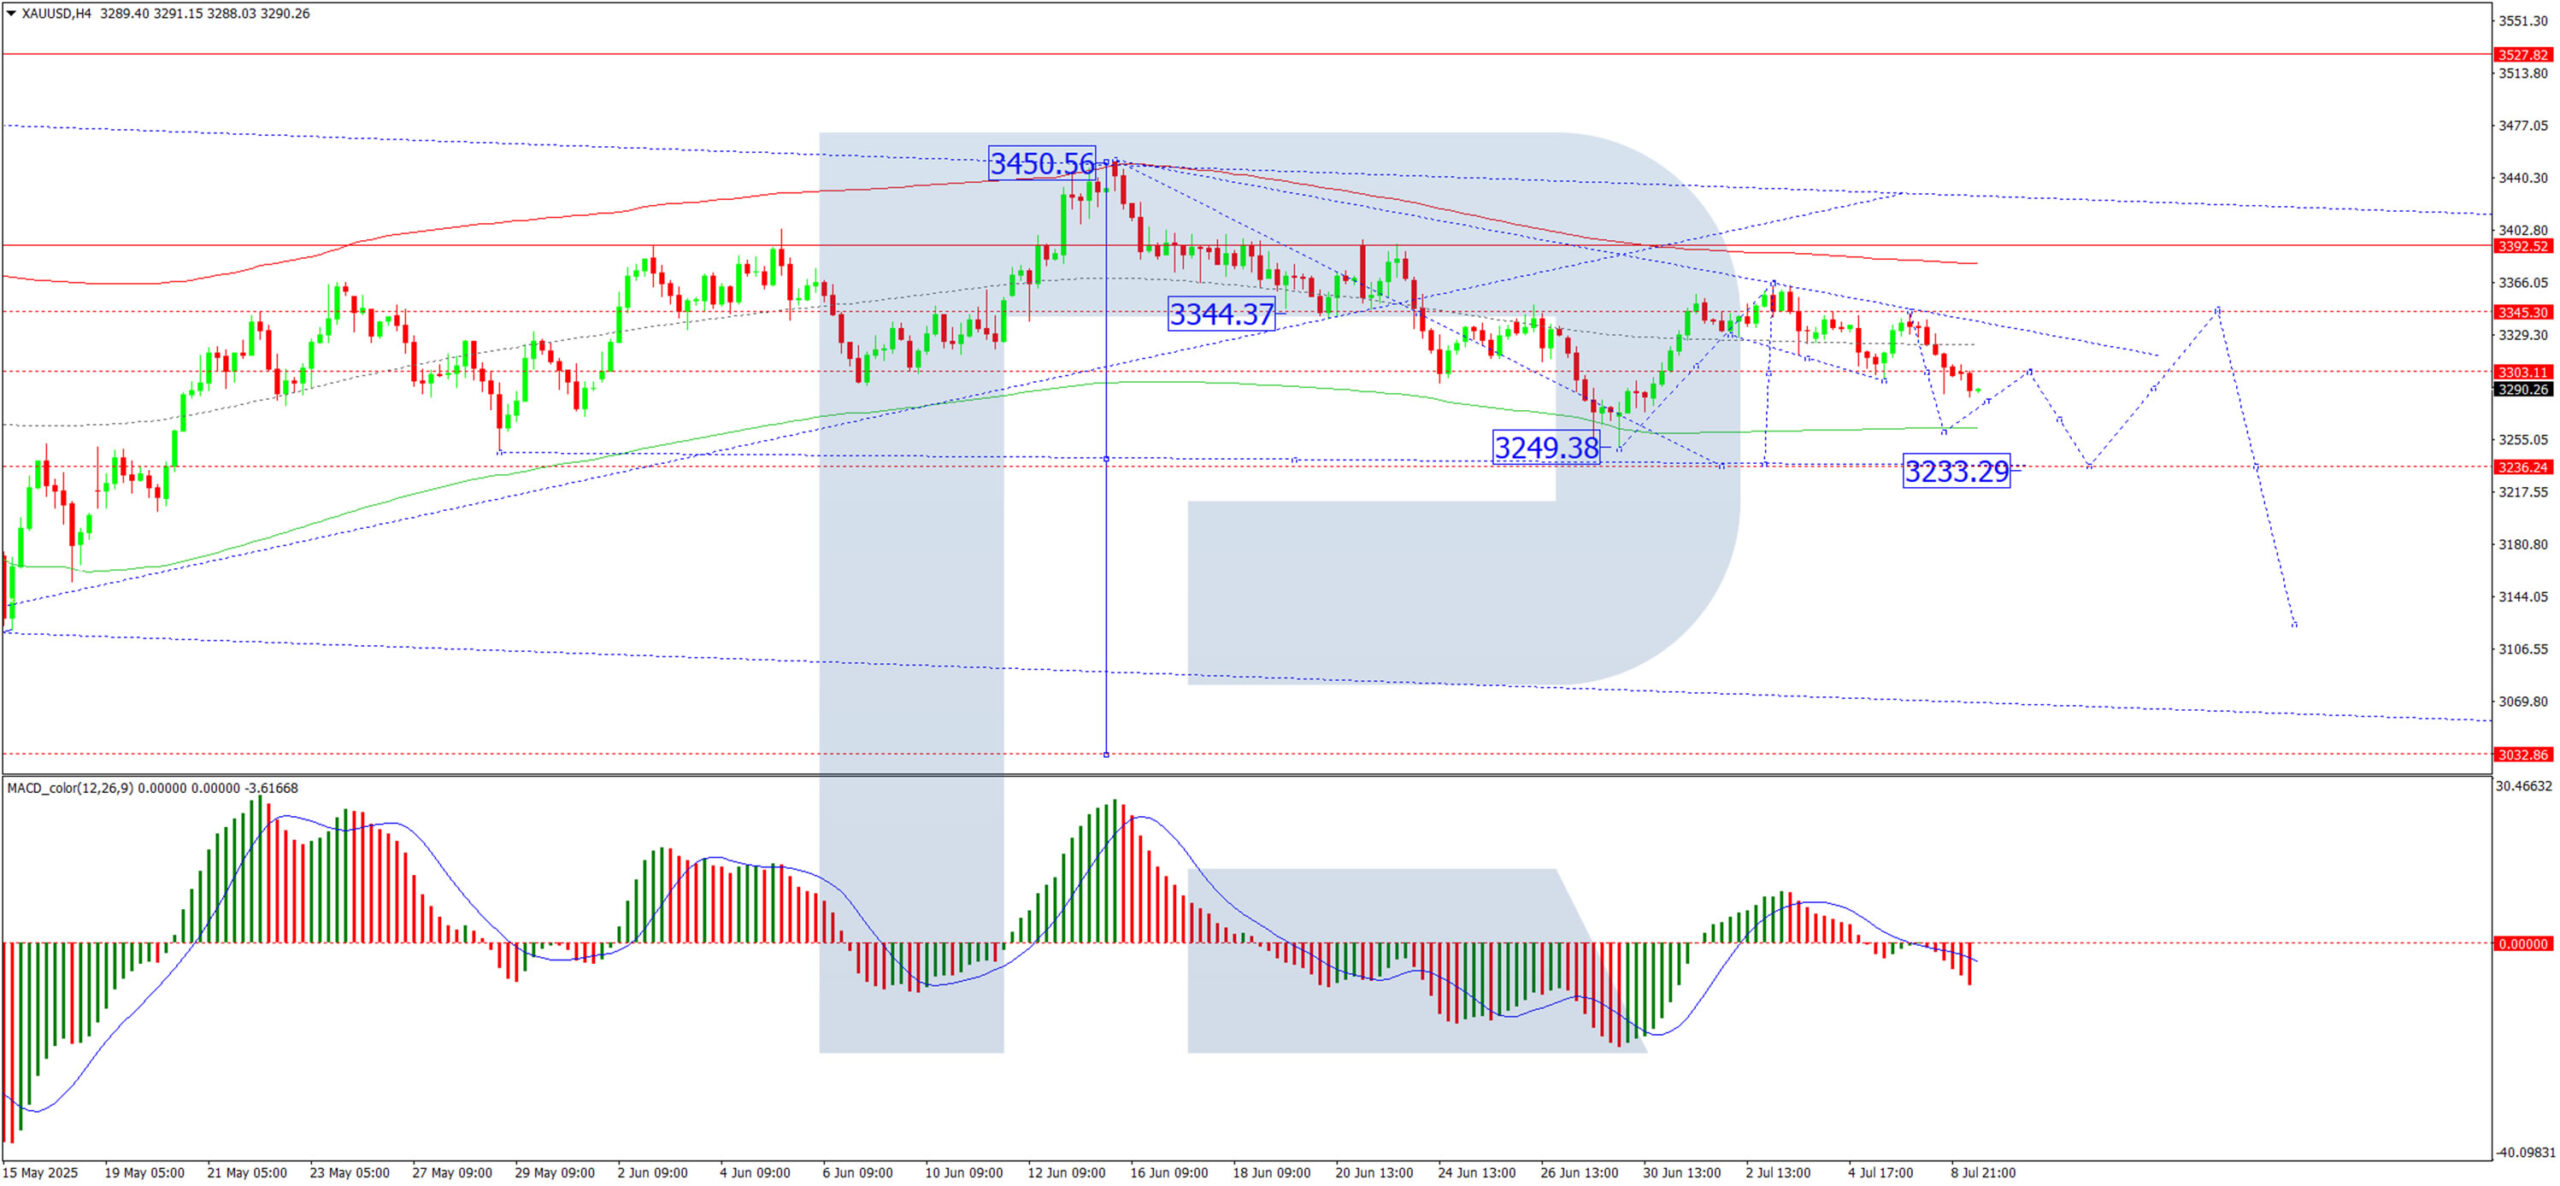
Technical Analysis: XAU/USD
H4 Chart:
The XAU/USD pair is forming the fifth wave of a downward structure, targeting 3,233. Upon completion, a corrective wave towards 3,344 may follow before a potential resumption of declines to 3,121. This outlook is supported by the MACD indicator, whose signal line is below zero and trending sharply downward.
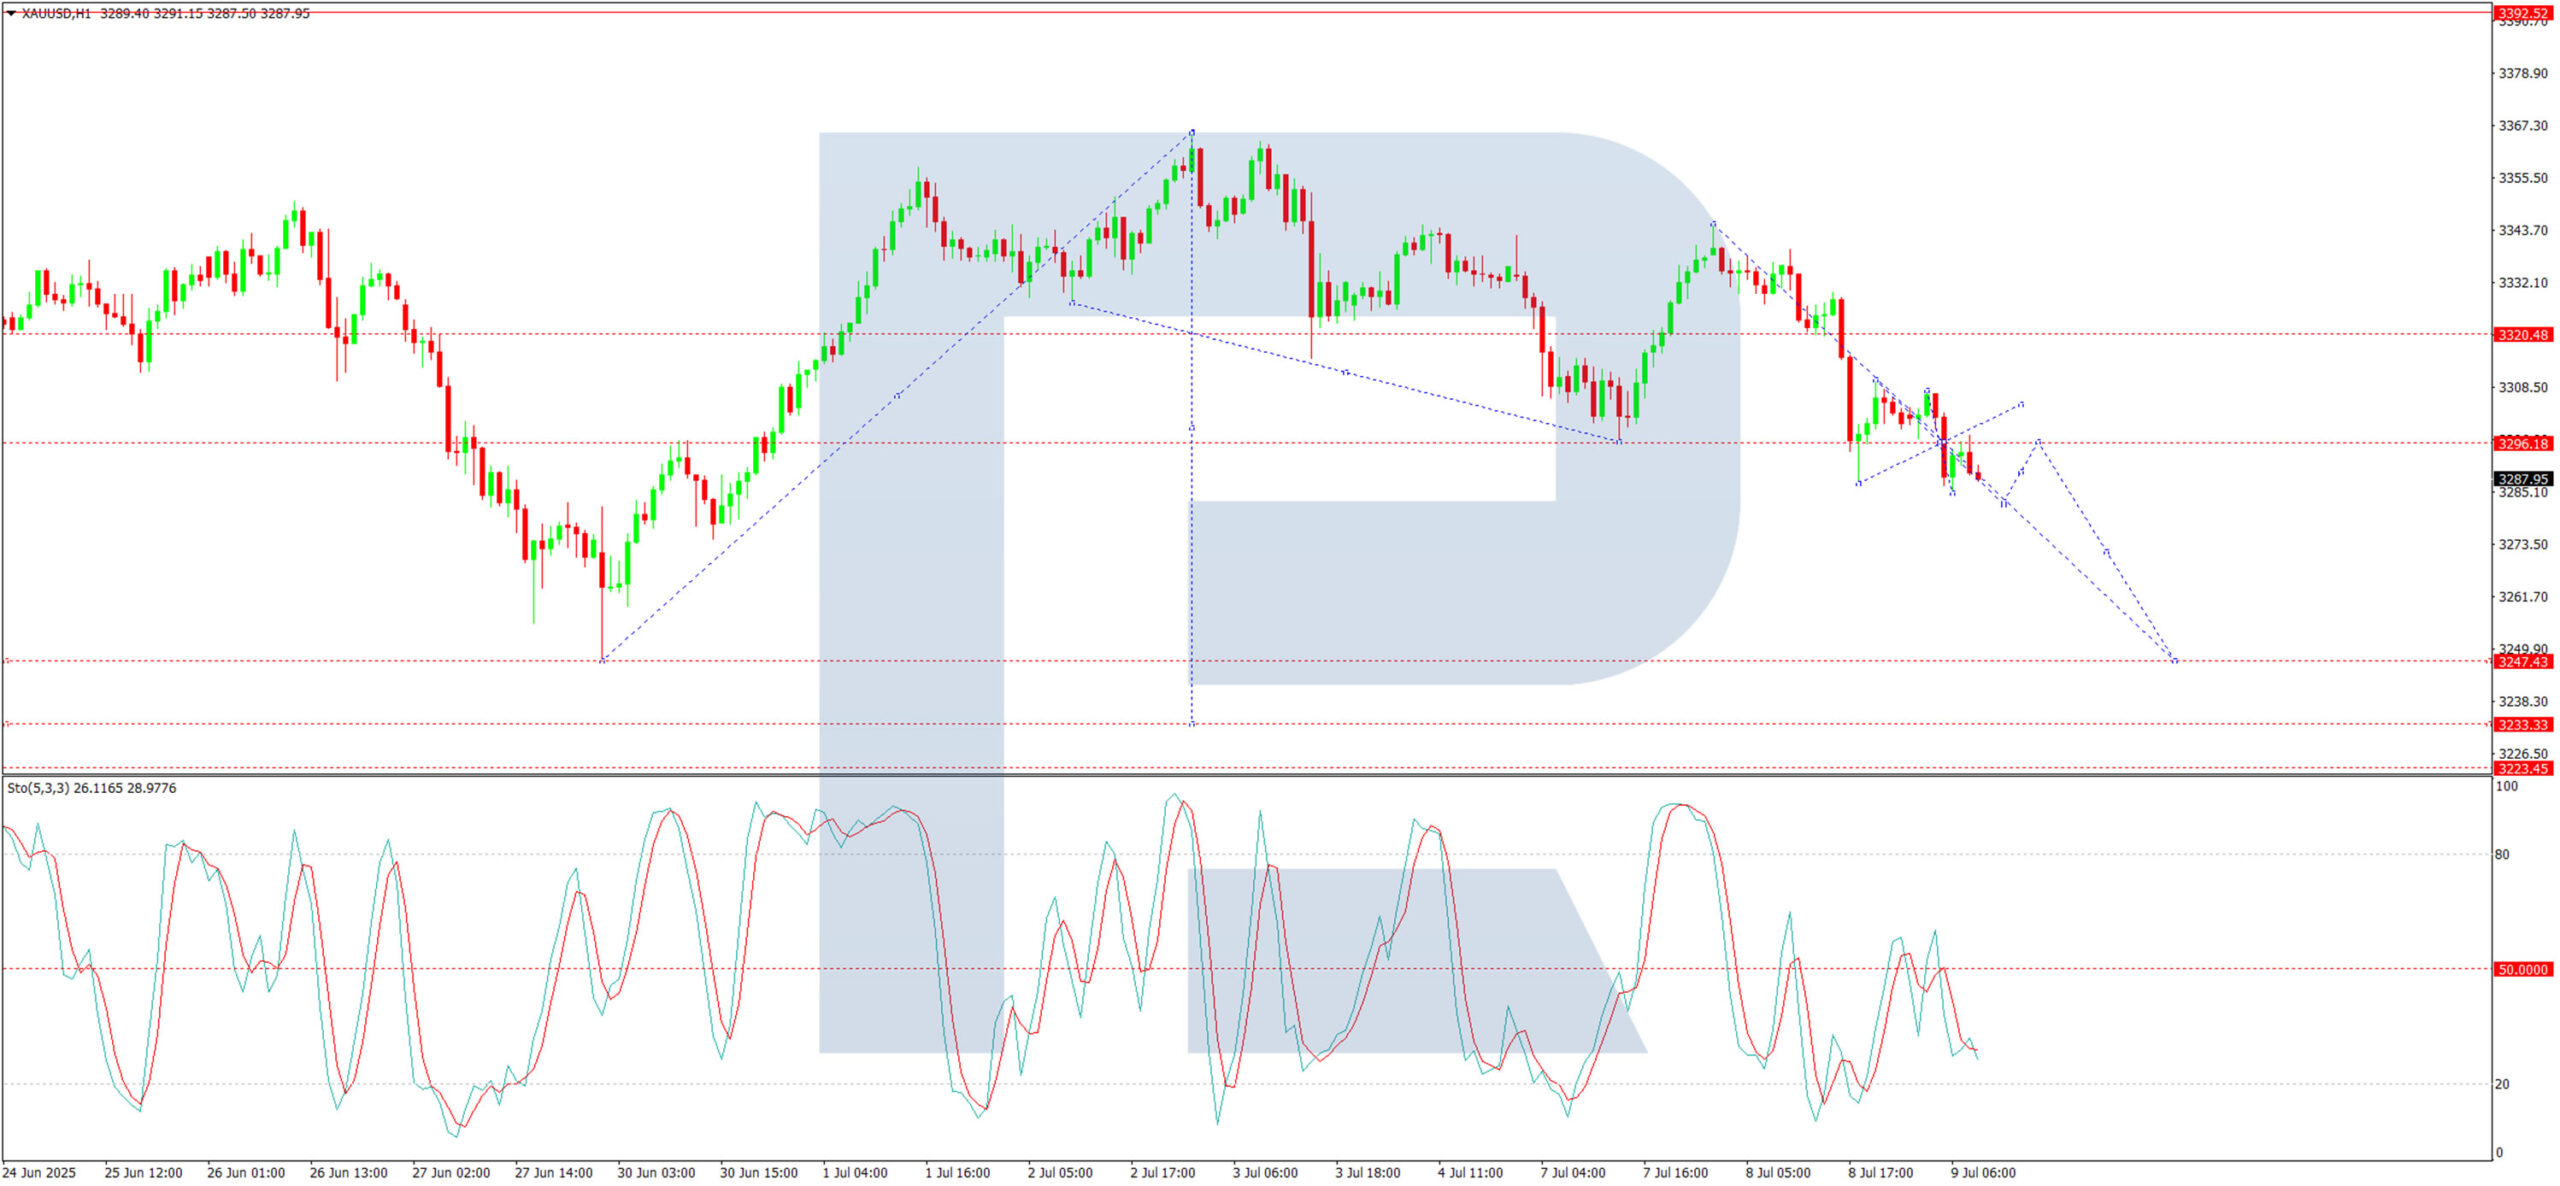
H1 Chart:
The pair has established a downward wave to 3,286, followed by a tight consolidation range near 3,296. Today, we anticipate a drop to 3,282, followed by a retest of 3,296 (from below). A breakout below this range could extend losses towards 3,247 – a near-term target. The Stochastic oscillator aligns with this view, with its signal line sitting below 50 and trending downward towards 20.
Conclusion
Gold remains under pressure amid shifting Fed expectations and trade uncertainties. A bearish technical structure suggests further downside potential unless key support levels hold.
AUD/USD Attempts Fresh Climb as NZD/USD Slips
AUD/USD is attempting a fresh increase from the 0.6485 support. NZD/USD is struggling and might decline below the 0.5980 level.
Important Takeaways for AUD/USD and NZD/USD Analysis Today
- The Aussie Dollar found support at 0.6485 and recovered against the US Dollar.
- There is a key bearish trend line forming with resistance at 0.6535 on the hourly chart of AUD/USD at FXOpen.
- NZD/USD is consolidating above the 0.5980 support.
- There is a connecting bearish trend line forming with resistance at 0.6010 on the hourly chart of NZD/USD at FXOpen.
AUD/USD Technical Analysis
On the hourly chart of AUD/USD at FXOpen, the pair started a fresh increase above 0.6550. The Aussie Dollar tested the 0.6585 zone before the bears appeared and pushed it lower against the US Dollar.
The pair declined below the 0.6560 and 0.6550 support levels. The recent low was formed at 0.6485 and the pair is rising again. The bulls pushed it above the 50% Fib retracement level of the downward move from the 0.6588 swing high to the 0.6485 low.
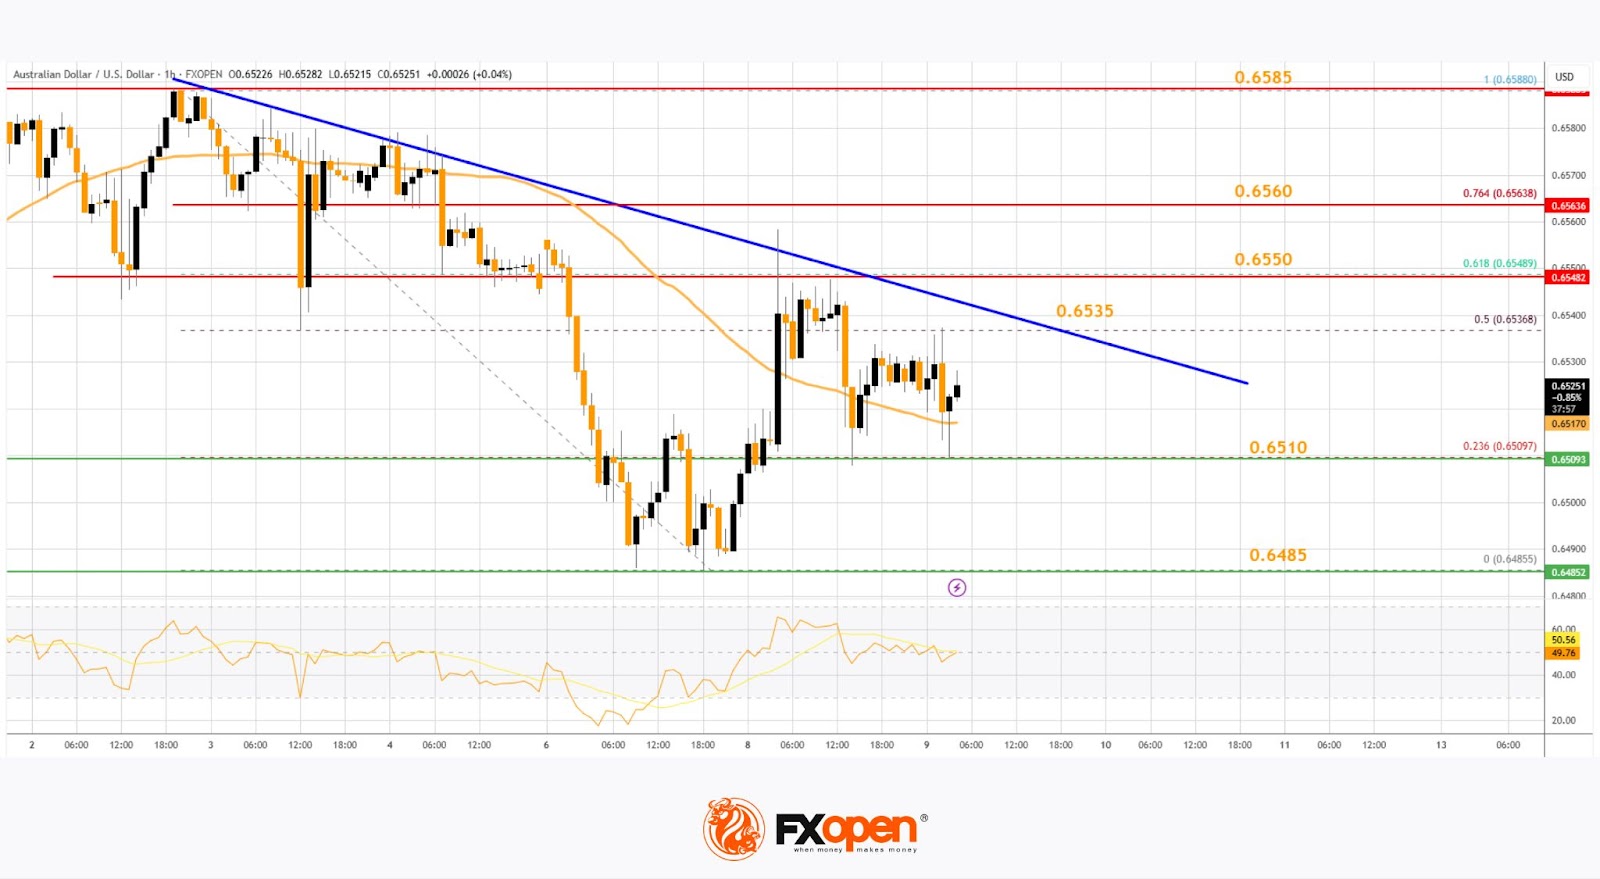
The pair is now consolidating above the 50-hour simple moving average. On the upside, the AUD/USD chart indicates that the resistance is near the 0.6535 zone. There is also a key bearish trend line forming at 0.6535.
The first major resistance might be 0.6550 and the 61.8% Fib retracement level. An upside break above it might send the pair further higher. The next major resistance is near the 0.6560 level. Any more gains could clear the path for a move toward the 0.6585 resistance zone.
If not, the pair might correct lower. Immediate support sits near the 0.6510 level. The next support could be 0.6485. If there is a downside break below 0.6485, the pair could extend its decline toward the 0.6440 zone. Any more losses might signal a move toward 0.6420.
NZD/USD Technical Analysis
On the hourly chart of NZD/USD at FXOpen, the pair also followed AUD/USD. The New Zealand Dollar struggled above 0.6100 and started a fresh decline against the US Dollar.
There was a move below the 0.6050 and 0.6020 support levels. A low was formed at 0.5978 and the pair is now consolidating losses below the 50-hour simple moving average. The NZD/USD chart suggests that the RSI is back below 50 signalling a bearish bias.
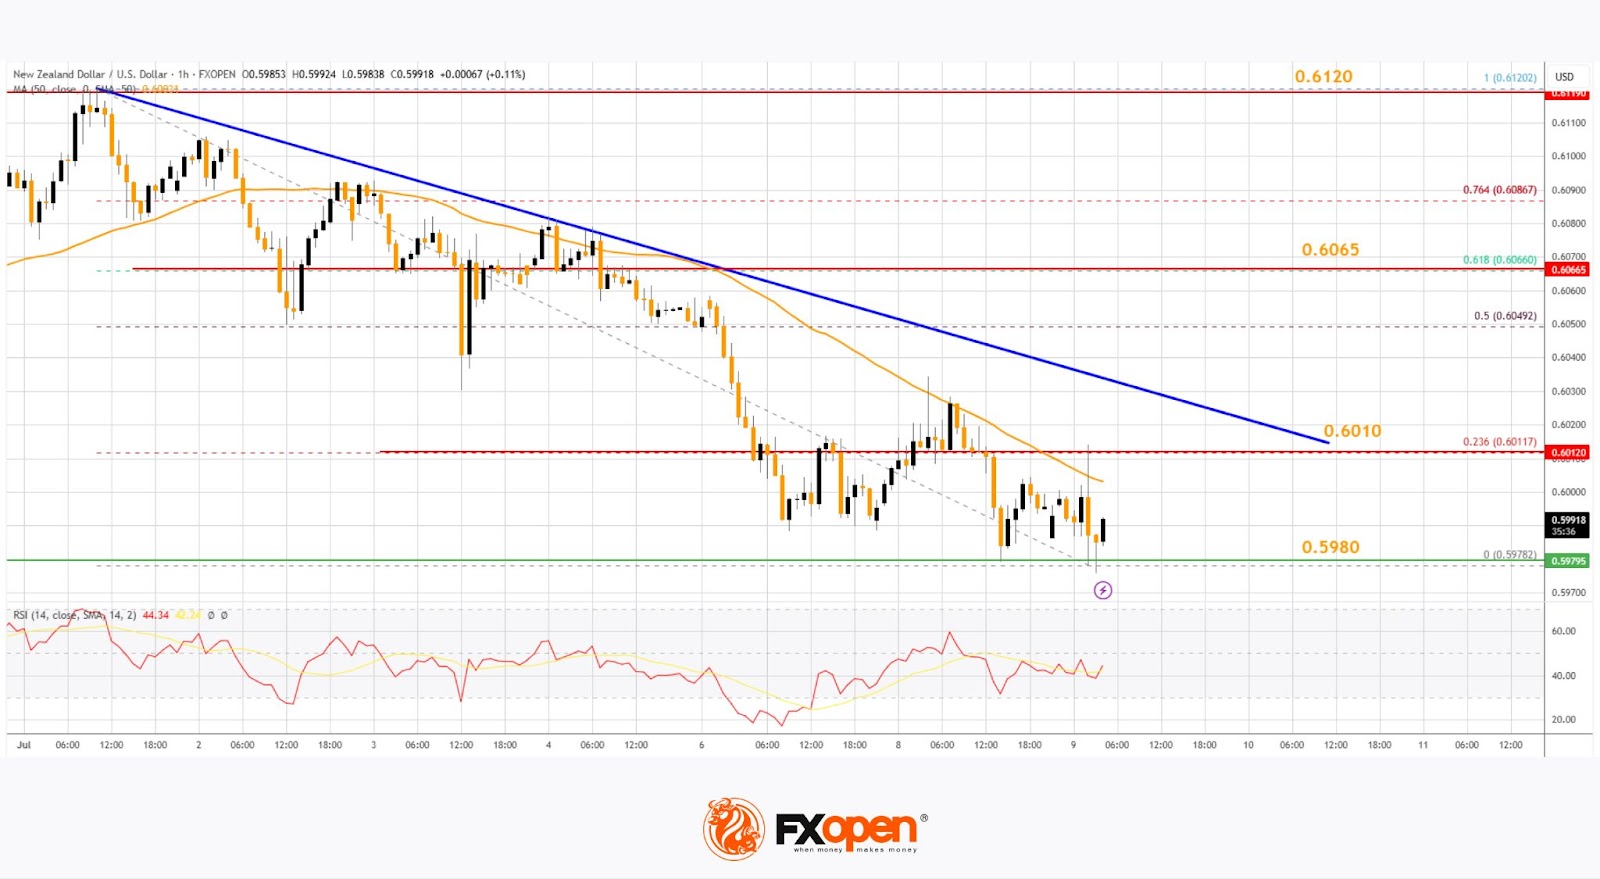
On the upside, the pair is facing resistance near the 23.6% Fib retracement level of the downward move from the 0.6120 swing high to the 0.5978 low. There is also a connecting bearish trend line forming with resistance at 0.6010.
The next major resistance is near the 0.6065 level or the 61.8% Fib retracement level. A clear move above the 0.6065 level might even push the pair toward the 0.6120 level. Any more gains might clear the path for a move toward the 0.6150 resistance zone in the coming days.
On the downside, there is a support forming near the 0.5980 zone. If there is a downside break below 0.5980, the pair might slide toward 0.5940. Any more losses could lead NZD/USD in a bearish zone to 0.5910.
Trade over 50 forex markets 24 hours a day with FXOpen. Take advantage of low commissions, deep liquidity, and spreads from 0.0 pips. Open your FXOpen account now or learn more about trading forex with FXOpen.
This article represents the opinion of the Companies operating under the FXOpen brand only. It is not to be construed as an offer, solicitation, or recommendation with respect to products and services provided by the Companies operating under the FXOpen brand, nor is it to be considered financial advice.
Multiple, Often Diffuse, Trade Headlines Leave Little Visibility to Set Up Directional Trades
Markets
Markets headlines yesterday still were dominated by the ongoing flurry of trade-war communication as launched by US president Trump. Even so, in particular on interest rate markets, global public debt sustainability was at least as important as a market driver. The trigger again came from two ‘market outsiders’: the UK and Japan, with the impact spilling over globally. In the UK, the publication by OBR of its yearly public risk and sustainability report served as another illustration that the country has no fiscal headroom to address new shocks or take any policy initiatives. In Japan, political uncertainty in the run-up to the July 20 Upper House elections continues to nourish concerns on fiscal sustainability. In a steepening move, Japanese (+9 bp) and UK (+ 6.3 bps) 30-y bonds again underperformed. The German yield curve followed this broader trend (steepening, 2-y +3.5 bps, 30-y +5.4 bps). Interestingly, the US even after OBBB was less affected (yields changing less than 2 bps across the curve). As indicated, the new avalanche of US trade (war) communication at first sight only has far less impact. US president Trump indicated that he won’t extend the tariff pause beyond August 1, threatened a 50% levy on copper imports and other sector tariffs, including a potential 200% levy on pharma imports. BRICS countries still risk an additional 10% levy. One might assume that, at some point, such measures should put upward pressure on US inflation and complicate planning by all economic agents. However, as was the case on Monday after announcing reciprocal tariffs, the impact on markets at the end of the day was modest. US equities finished little changed (S&P 500-0.07%). USD again gained modestly (DXY close 97.52, EUR/USD little changed at 1.1725). Sterling (slightly) underperformed (EUR/GBP 0.863). The yen remained under pressure both against the dollar (USD/JPY close 146.6) and the euro (EUR/JPY 171.9).
Asian equity markets this morning are again ‘meandering ‘, mostly holding in positive territory. The multiple, often diffuse, trade headlines still leave little visibility to set up directional trades and this pattern might continue today. A US-EU trade deal is expected to be announced ‘in the near future’. The FT this morning reports this framework might leave the EU with higher tariffs than those granted to the UK. The eco calendar is again extremely thin with the Minutes of the June Fed policy meeting the exception to the rule. With debt sustainability in focus, we also keep a close eye at a $39 bln US treasury action, the first sale of LT US debt post OBBB and a precursor for tomorrow’s 30-y sale. On FX markets, the dollar continues recent gradual rebound. However, in the likes of DXY or EUR/USD the technical picture hasn’t changed in any profound way.
News & Views
The central bank of New Zealand (Reserve Bank of New Zealand, RBNZ) kept the policy rate unchanged at 3.25% in a move expected by both markets and analysts. The case for another rate cut was considered, mainly over near-term growth momentum and the risk of prolonged weakness in economic activity leading to downward pressure on medium-term inflation. In the end, though, the benefits of waiting until August in light of near-term inflation risks outweighed. Inflation is expected to rise further from the 2.5% in Q1 towards the top of the 1-3% target band before returning to around 2% by early 2026 on spare productive capacity. It also allows the RBNZ to observe developments (ie tariffs) in the global economy and whether domestic economic weakness persists. New Zealand money markets are discounting a two-in-three chance for the RBNZ to cut rates next month. The kiwi dollar holds steady around USD/NZD 0.60.
Chinese consumer prices unexpectedly rose 0.1% year-over-year in June. Consensus was expecting CPI to match May’s -0.1%. Monthly prices fell for a second month straight, though, suggesting deflationary pressures are all but over. June printed -0.1% m/m following May’s -0.2%. Core inflation was flat on a monthly basis and edged up from 0.6% to 0.7% y/y. Government subsidies for home appliance purchases helped CPI to return to positive territory but that’s unlikely to be a lasting and in any case large driver. Services prices held at 0.5% y/y. Adding to evidence of still-strongly low (even negative) price pressures are the June PPIs, which dropped into deeper negative area at -3.6% y/y, a near 2-year low. The Chinese yuan trades a tad weaker around USD/CNY 7.18.
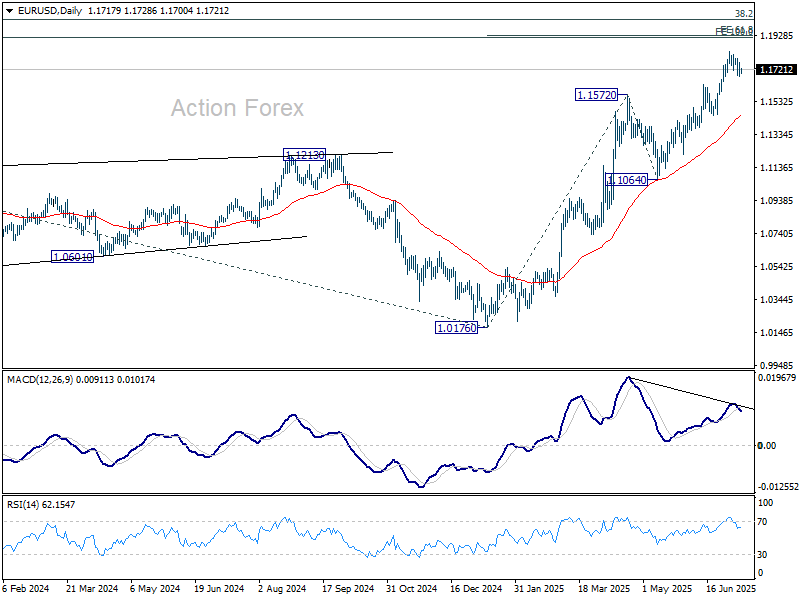
EUR/USD Daily Outlook
Daily Pivots: (S1) 1.1684; (P) 1.1724; (R1) 1.1766; More...
Intraday bias in EUR/USD remains neutral as consolidations continues below 1.1829. Downside should be contained by 1.1630 resistance turned support to bring rebound. Firm break of 1.1829 will resume the rise from 1.0176 and target 61.8% projection of 1.0176 to 1.1572 from 1.1064 at 1.1927.
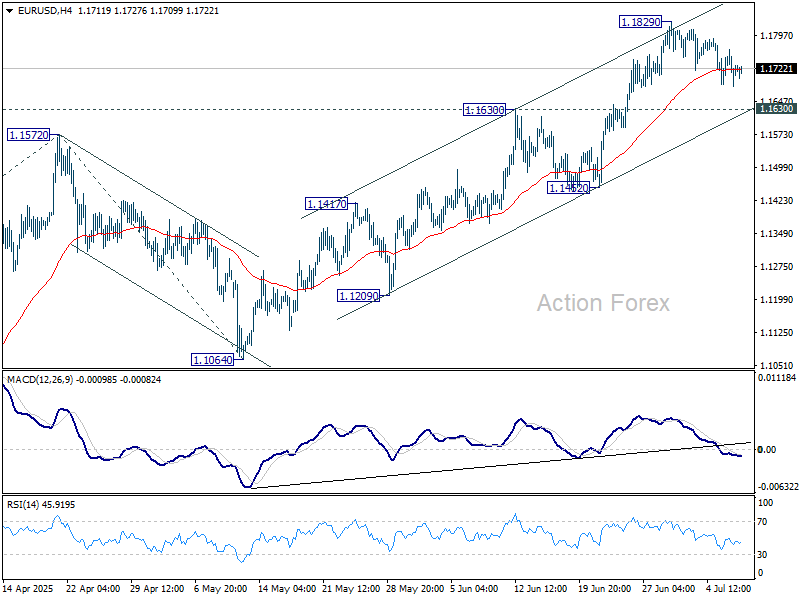
In the bigger picture, rise from 0.9534 long term bottom could be correcting the multi-decade downtrend or the start of a long term up trend. In either case, further rise should be seen to 100% projection of 0.9534 to 1.1274 from 1.0176 at 1.1916. This will now remain the favored case as long as 1.1604 support holds.
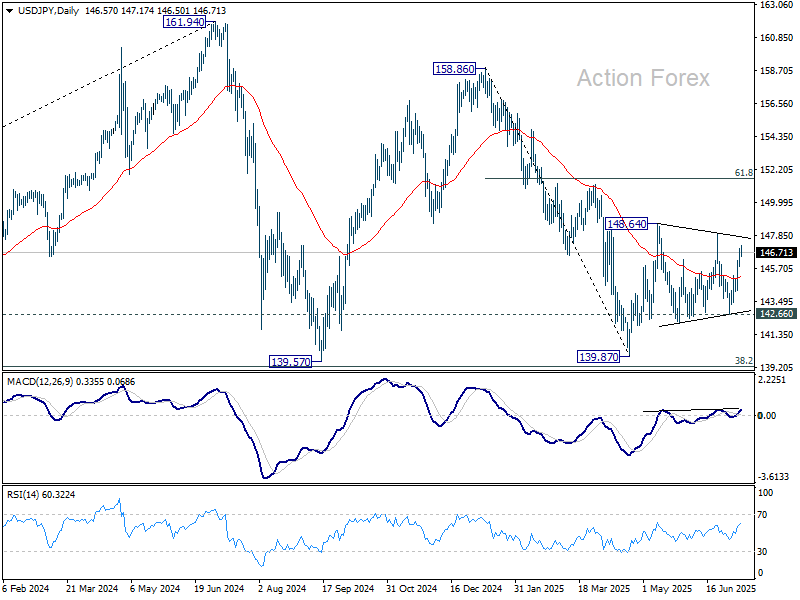
USD/JPY Daily Outlook
Daily Pivots: (S1) 145.94; (P) 146.46; (R1) 147.09; More...
USD/JPY is still bounded in range of 142.66/148.01 and intraday bias remains neutral. On the upside, firm break of 148.01 resistance will resume the rise from 139.87 to 61.8% retracement of 158.86 to 139.87 at 151.22. However, break of 142.66 will bring deeper fall back to retest 139.87 low.
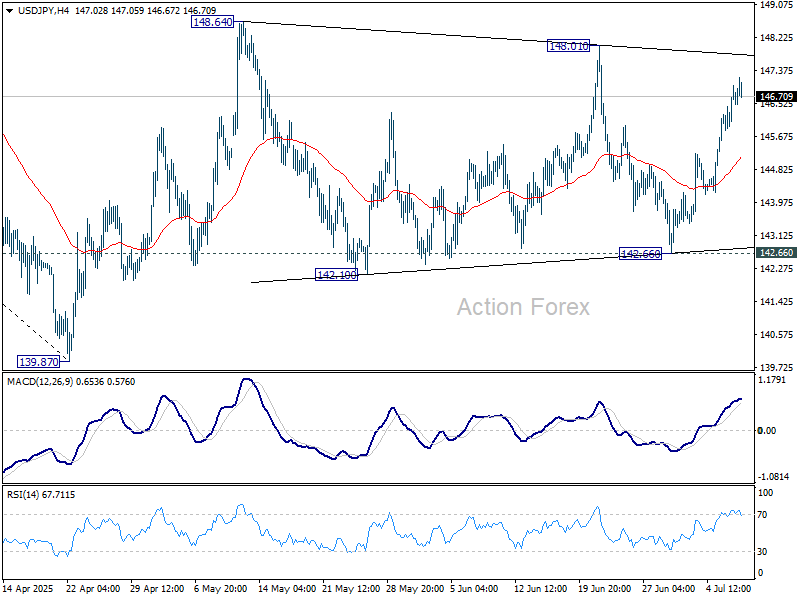
In the bigger picture, price actions from 161.94 (2024 high) are seen as a corrective pattern to rise from 102.58 (2021 low). There is no clear sign that the pattern has completed yet. But still, strong support is expected from 38.2% retracement of 102.58 to 161.94 at 139.26 to bring rebound.