
Sample Category Title
Gold Under Pressure Again as Risk Appetite Improves
The price of gold declined to 3,307 USD per troy ounce on Tuesday as investor appetite for risk increased amid growing optimism over a potential de-escalation in US-China trade tensions.
Trade optimism weakens demand for safe-haven assets
The improvement in market sentiment stems from the high-level trade talks between the US and China, which began in London on Monday and continue today. Both sides are working to stabilise a fragile truce, with discussions now extending beyond tariffs to include strategic materials such as rare earth elements.
US Treasury Secretary Scott Bessent described Monday’s session as “a good meeting”, while Commerce Secretary Howard Lutnick called the talks “fruitful”. These positive signals are fuelling hopes for a normalisation of relations between the world’s two largest economies, thereby reducing the appeal of defensive assets like gold.
Investors are also closely watching upcoming US inflation reports, which will include both consumer and producer price indices. These data points could provide crucial insight into the Federal Reserve’s future monetary policy stance.
Meanwhile, a survey by the Federal Reserve Bank of New York, released on Monday, showed that Americans’ inflation expectations declined in May while confidence in personal finances improved, adding to the overall risk-on sentiment.
Technical analysis of XAU/USD
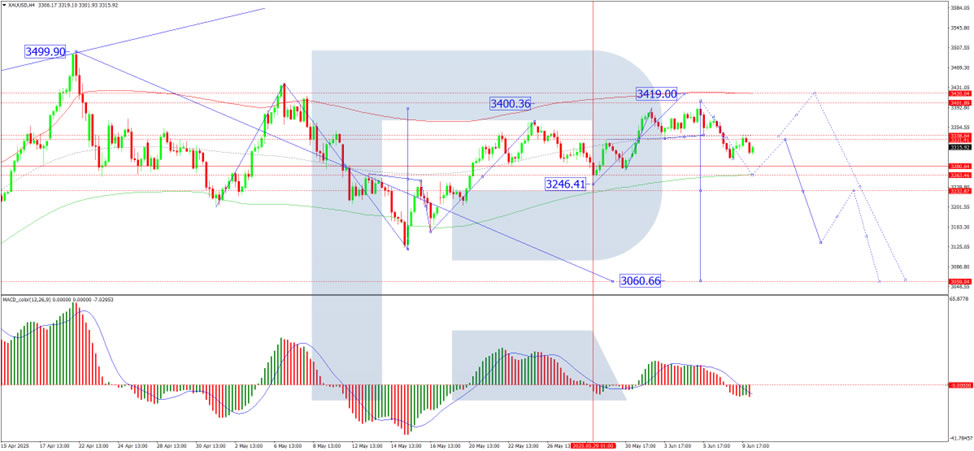
On the H4 chart, XAU/USD is developing a corrective structure targeting 3,263 USD. Once this correction is complete, a new upward wave towards 3,419 USD is expected. The MACD indicator supports this view, with its signal line positioned below zero and pointing sharply downwards, indicating a short-term bearish phase within a broader bullish setup.
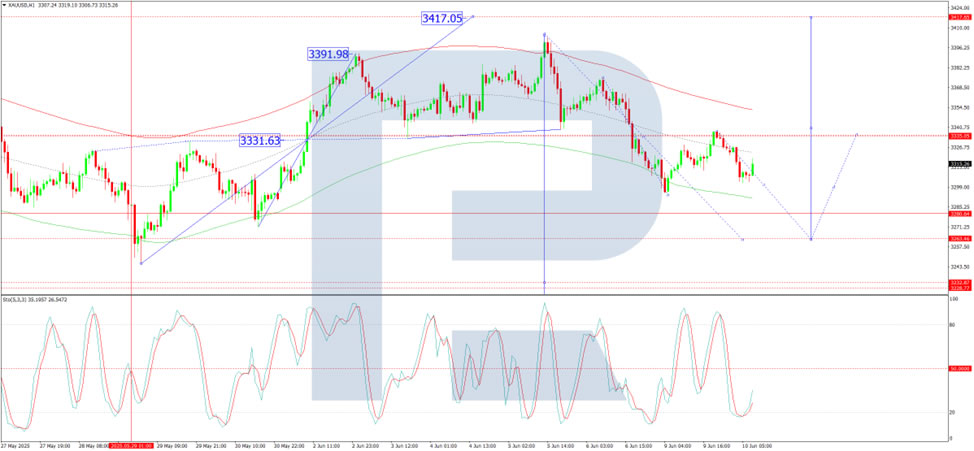
On the H1 chart, the market formed a consolidation range around 3,331 USD, then broke downwards, reaching the local target at 3,294 USD. A subsequent correction to 3,333 USD has now been fulfilled. Today, the development of a fifth-wave structure is anticipated to reach 3,263 USD. Following this move, gold is expected to resume its growth towards 3,419 USD. The Stochastic oscillator confirms the current outlook, with its signal line below 50 and heading sharply towards 20, signalling continued downward momentum in the short term.
Conclusion
Gold remains under pressure as improving geopolitical sentiment and a better economic outlook dampen demand for safe-haven assets. Near-term technicals indicate further downside towards 3,263 USD, followed by a potential bullish reversal targeting 3,419 USD. Key drivers in the coming sessions will include US inflation data and progress in the US-China trade negotiations.
Eurozone Sentix surges back into positive territory, recession fears recede
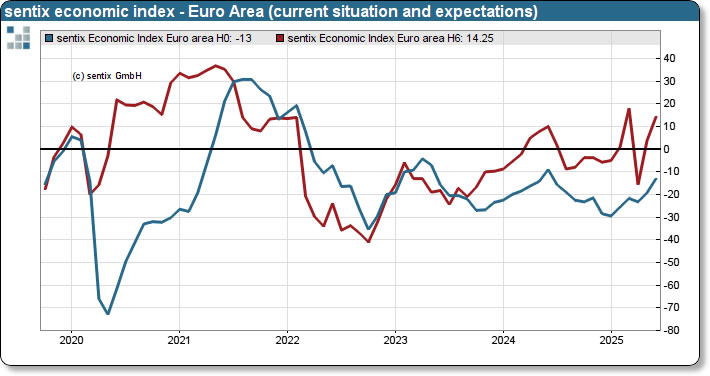
Investor sentiment in the Eurozone turned notably upbeat in June, as Sentix Investor Confidence index climbed from -8.1 to +0.2—its first positive reading since June 2024 and well above expectations of -6. Current Situation Index also improved markedly from -19.3 to -13.0, while Expectations Index jumped from 3.8 to 14.3.
Germany led the improvement, with its overall Sentix index rising to -5.9, the highest since March 2022. Expectations climbed by 12 points to 17.5, while current conditions advanced for the fourth consecutive month to -26.8.
According to Sentix, fears of a recession triggered by the US tariff shock in April have largely dissipated, and the economic outlook for the Eurozone is now tilted toward a cyclical upswing.
With economic momentum building and the Sentix inflation barometer showing signs of easing price pressures, ECB may view its policy as being in a “comfort zone.” While another rate cut isn’t off the table, any such move could be delayed if the upswing continues to solidify over the summer.
FTSE 100 Surges Towards Record High
Today saw the release of new data on the UK labour market.
According to official statistics, the number of payrolled employees in the UK fell by 55,000 (0.2%) between March and April 2025. Over the broader period from February to April 2025, the number declined by 78,000 (0.3%).
In response to the drop in employment, the UK’s FTSE 100 index (UK 100 on FXOpen) jumped sharply, rising close to the 8,900 mark — near its all-time high reached in early March this year.
Market participants likely interpreted the weakening labour market as an additional argument in favour of interest rate cuts by the Bank of England. Such a move would be seen as supportive of the economy and a bullish factor for equities.
Technical Analysis of the FTSE 100 (UK 100 on FXOpen)
From a technical perspective:
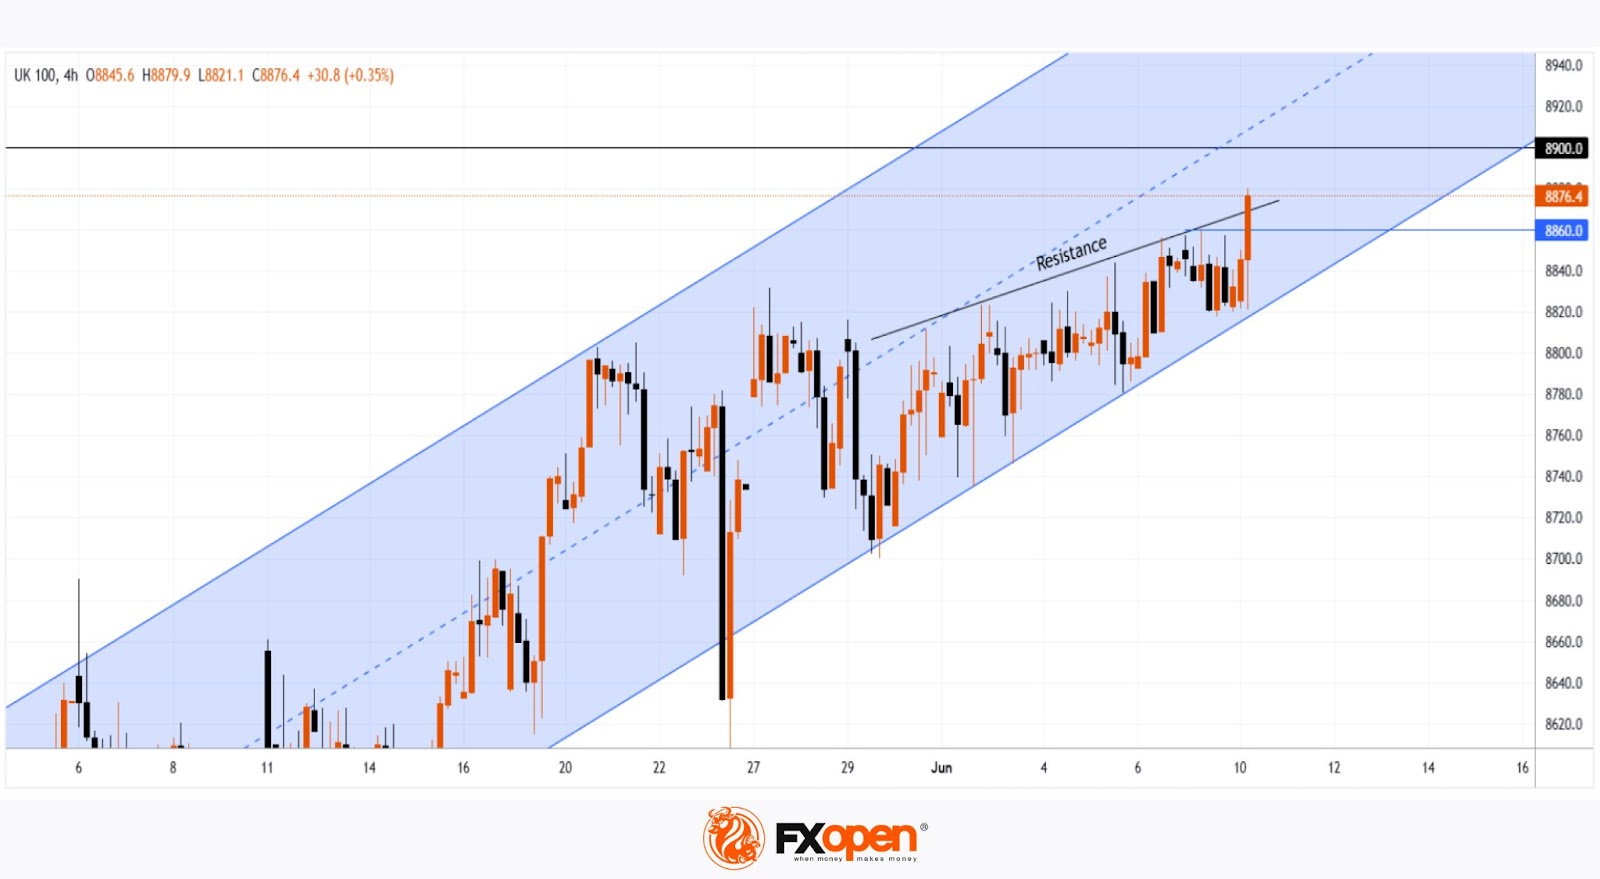
→ The FTSE 100 continues to trade within an ascending channel (shown in blue);
→ Today’s bullish momentum broke through the resistance line from below — a level that had previously capped the upward movement within the channel.
If the bulls can maintain the price above the 8,860 level, the likelihood increases for a continued uptrend and a potential new all-time high for the FTSE 100 index.
Trade global index CFDs with zero commission and tight spreads. Open your FXOpen account now or learn more about trading index CFDs with FXOpen.
This article represents the opinion of the Companies operating under the FXOpen brand only. It is not to be construed as an offer, solicitation, or recommendation with respect to products and services provided by the Companies operating under the FXOpen brand, nor is it to be considered financial advice.
XBR/USD Chart Analysis: Brent Crude Reaches 1.5-Month High
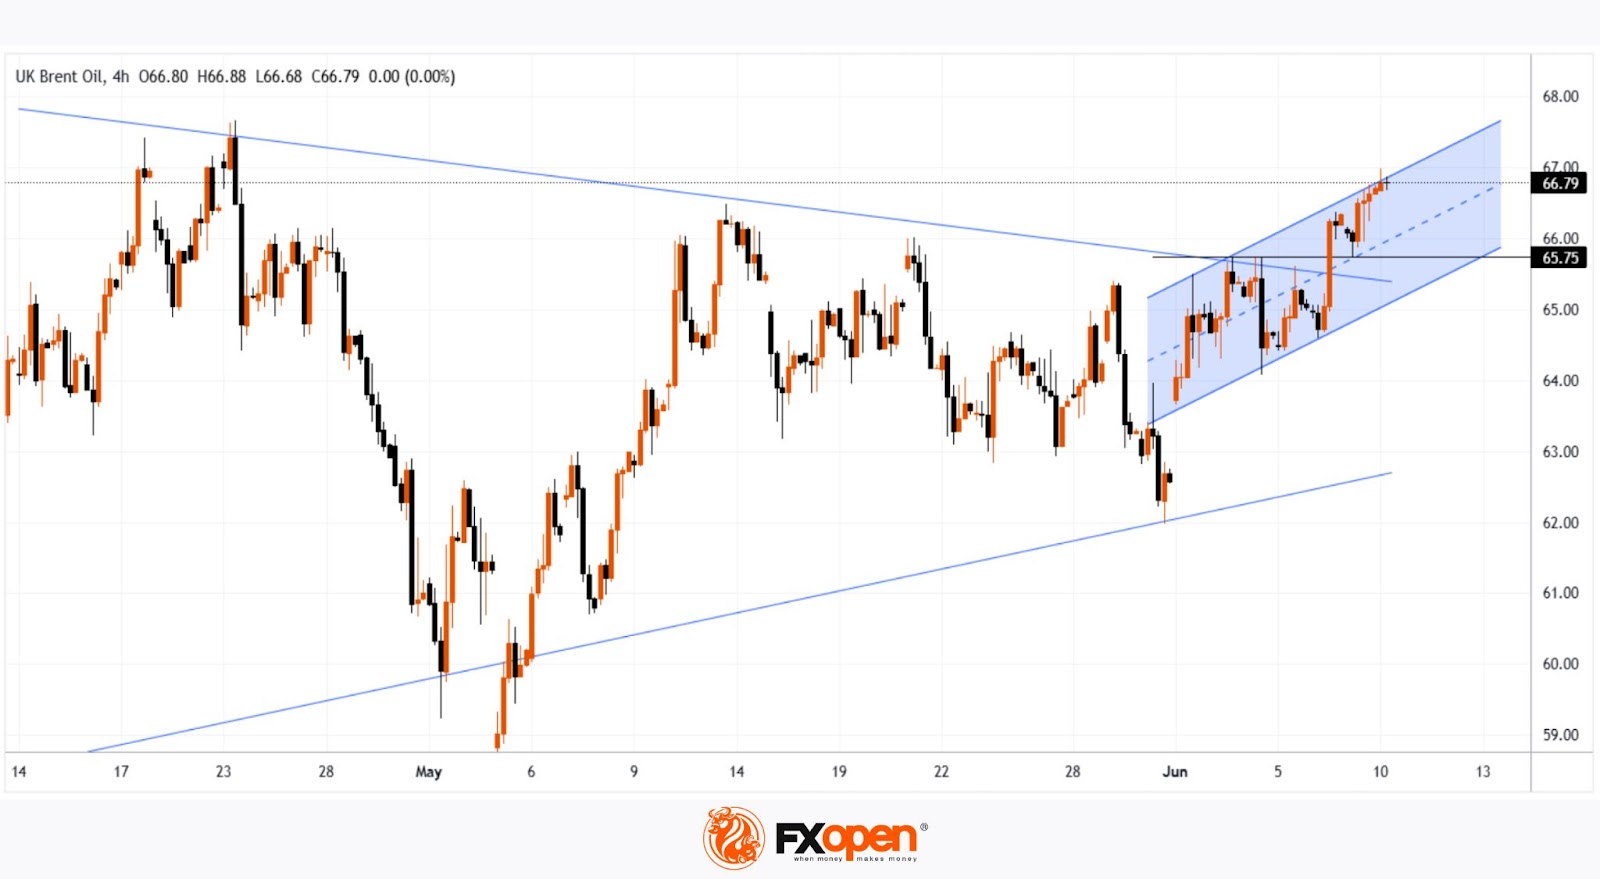
In our analysis of Brent crude oil six days ago, we identified a large contracting triangle and a local ascending channel. We also outlined a potential scenario involving a bullish breakout above the upper boundary of the triangle.
Although this was not the base-case scenario, the XBR/USD chart now suggests it has played out: yesterday, the price climbed to nearly $67 per barrel — its highest level since the end of April.
The main bullish catalyst appears to be ongoing trade talks between the United States and China, which have raised hopes of a resolution to tariff-related tensions between the world’s two largest economies.
At the same time, rising oil prices may exacerbate geopolitical tensions, particularly amid Israeli threats to strike ports in Yemen — a risk that could disrupt supply chains across the Middle East.
Technical Analysis of the XBR/USD Chart
From a technical perspective:
→ Brent crude continues to move within an ascending channel (marked in blue);
→ the upper boundary may now act as a support level.
The fact that the price is holding in the upper half of the channel indicates strong demand-side pressure. Based on this, it is reasonable to assume that as long as Brent remains above the $65.75 level (the retest zone of the breakout), the technical outlook will remain predominantly bullish.
Start trading commodity CFDs with tight spreads. Open your trading account now or learn more about trading commodity CFDs with FXOpen.
This article represents the opinion of the Companies operating under the FXOpen brand only. It is not to be construed as an offer, solicitation, or recommendation with respect to products and services provided by the Companies operating under the FXOpen brand, nor is it to be considered financial advice.
GBP/JPY Daily Outlook
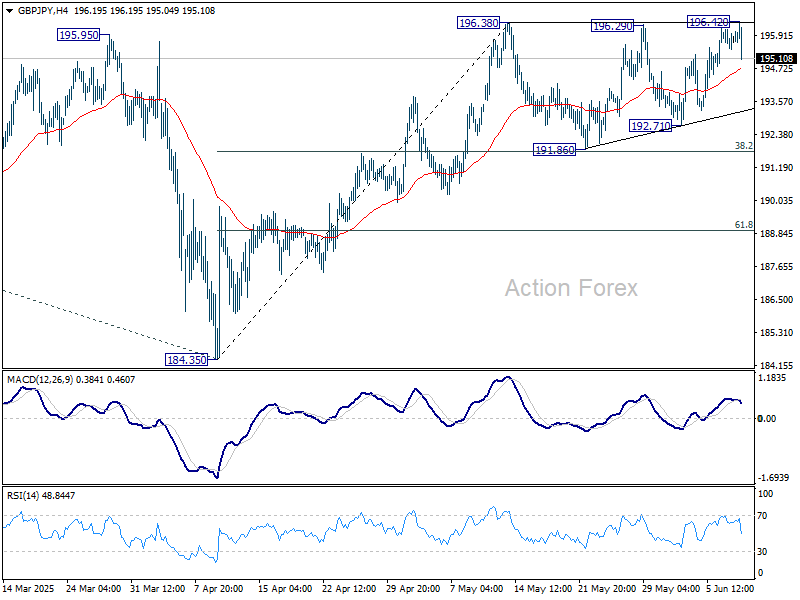
Daily Pivots: (S1) 195.56; (P) 195.86; (R1) 196.26; More...
GBP/JPY edged higher to 196.42 but reversed from there. Corrective pattern from 196.38 is extending with another falling leg and intraday bias remains neutral. Further rise is in favor as long as 191.86 support holds. Firm break of 196.38 will resume whole rally from 184.35 to 199.79 resistance, and possibly further to 100% projection of 180.00 to 199.79 from 184.35 at 204.14.
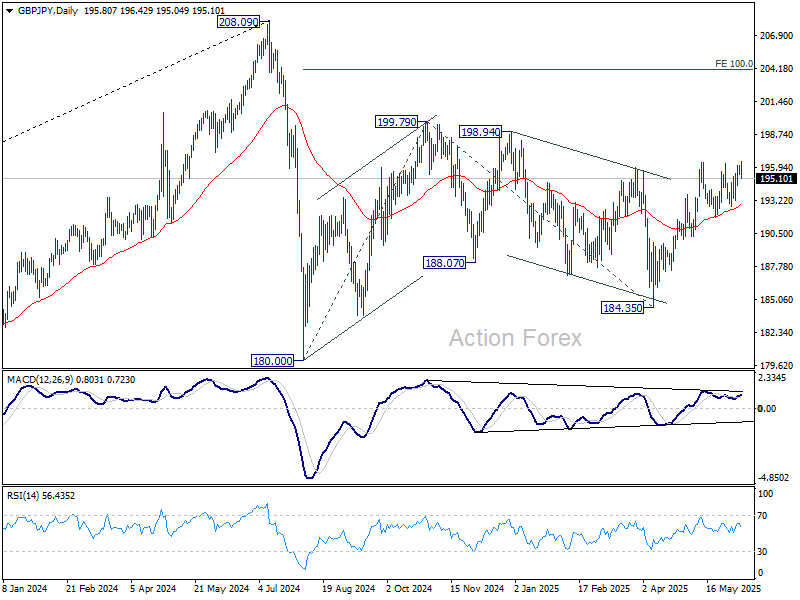
In the bigger picture, price actions from 208.09 are seen as a correction to rally from 123.94 (2020 low). Strong support should be seen from 38.2% retracement of 123.94 to 208.09 at 175.94 to contain downside. However, sustained break of 175.94 will bring deeper fall even still as a correction.
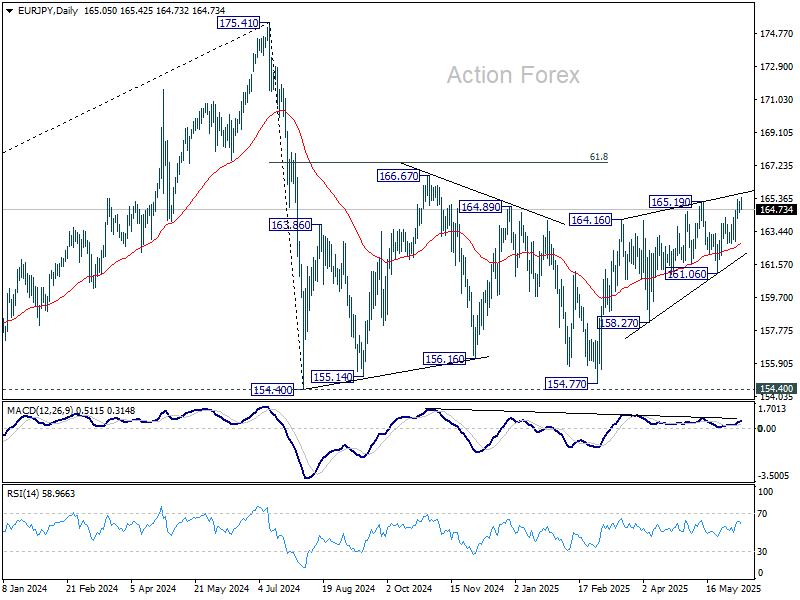
EUR/JPY Daily Outlook
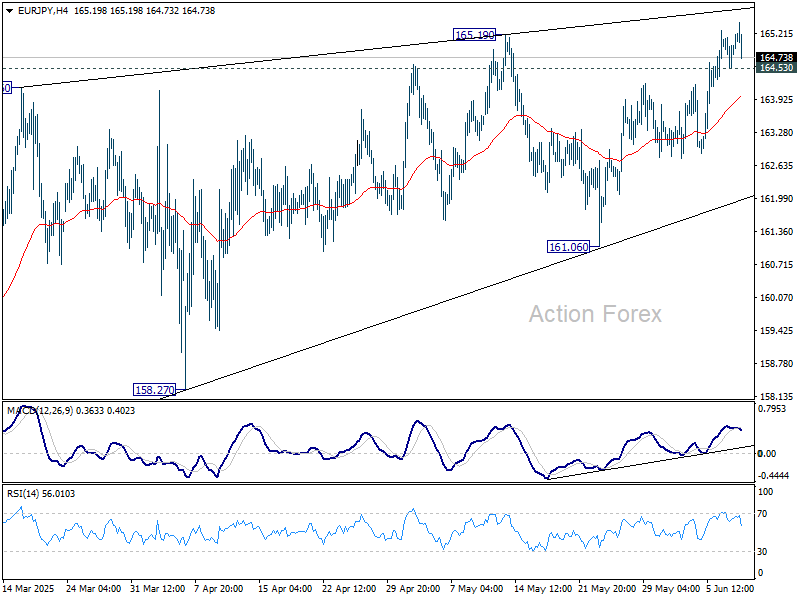
Daily Pivots: (S1) 164.73; (P) 164.97; (R1) 165.40; More...
Intraday bias in EUR/JPY stays mildly on the upside. Current rise from 154.77 would target 166.67 resistance, and possibly further to 61.8% retracement of 175.41 to 154.77 at 167.38. On the downside, below 164.53 minor support will turn intraday bias neutral again first.
In the bigger picture, price actions from 175.41 are seen as correction to up trend from 114.42 (2020 low). Strong support should be seen from 38.2% retracement of 114.42 to 175.41 at 152.11 to contain downside. However, sustained break of 152.11 will bring deeper fall even still as a correction.
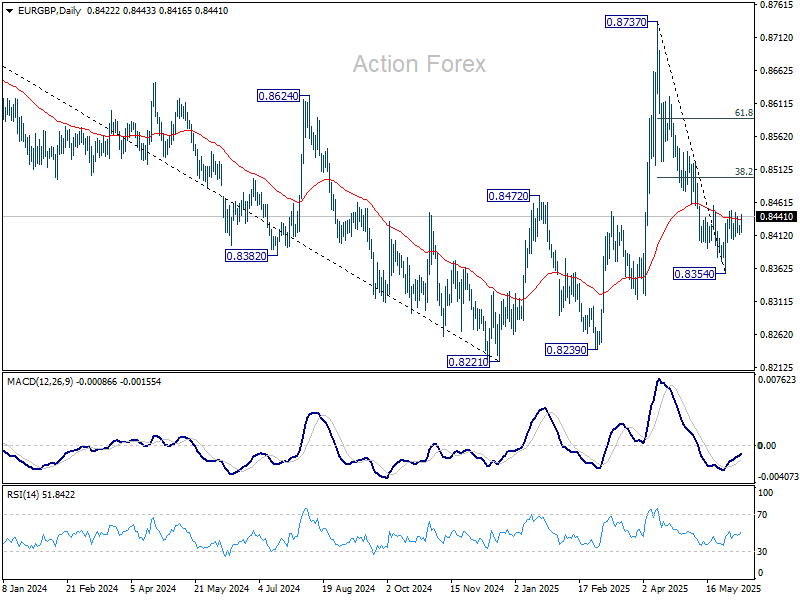
EUR/GBP Daily Outlook
Daily Pivots: (S1) 0.8419; (P) 0.8424; (R1) 0.8433; More...
Intraday bias in EUR/GBP remains neutral and outlook is unchanged. On the upside, above 0.8448 will bring stronger rebound to 38.2% retracement of 0.8737 to 0.8354 at 0.8500. On the downside, below 0.8401 will bring retest of 0.8354 low.
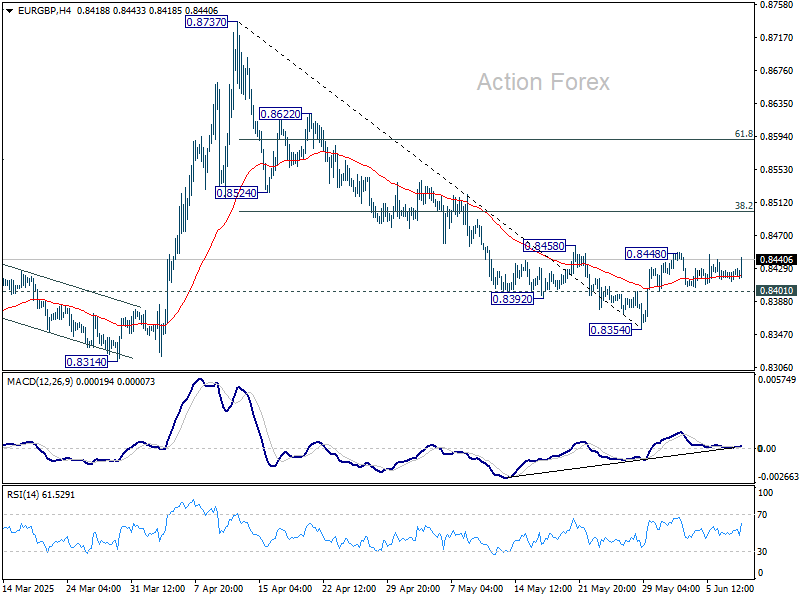
In the bigger picture, price actions from 0.8221 medium term bottom are merely forming a corrective pattern. Nevertheless, there is no clear momentum to break through 0.8201 key support (2022 low) yet. Hence, range trading is expected between 0.8221/8737 for now.
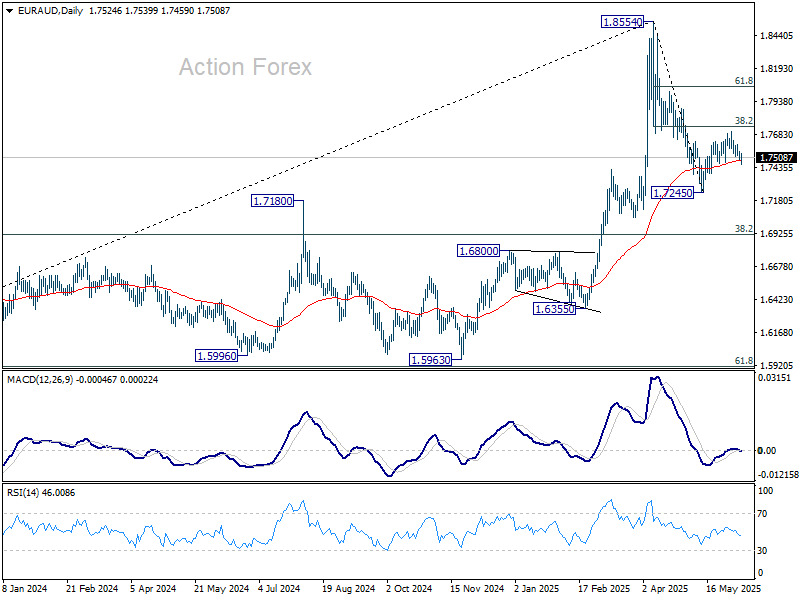
EUR/AUD Daily Outlook
Daily Pivots: (S1) 1.7491; (P) 1.7525; (R1) 1.7557; More...
Intraday bias in EUR/AUD remains neutral for the moment. On the downside, firm break of 1.7460 support will suggest that recovery from 1.7245 has already completed at 1.7705, 38.2% retracement of 1.8554 to 1.7245 at 1.7745. Intraday bias will be back on the downside for 1.7245 first. Firm break there will resume whole decline from 1.8554. On the upside, sustained break of 1.7745 will target 61.8% retracement at 1.8054.
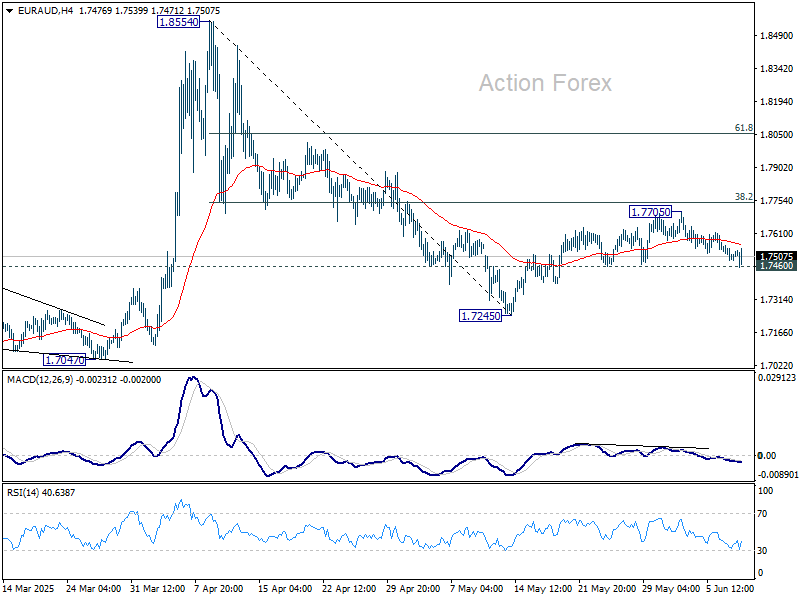
In the bigger picture, with 55 W MACD staying well below signal line, 1.8554 is likely a medium term top already. Price actions from there are seen as a corrective pattern only. While deeper pullback might be seen, downside should be contained by 38.2% retracement of 1.4281 (2022 low) to 1.8554 at 1.6922 to bring rebound. Up trend from 1.4281 is still expected to resume at a later stage.
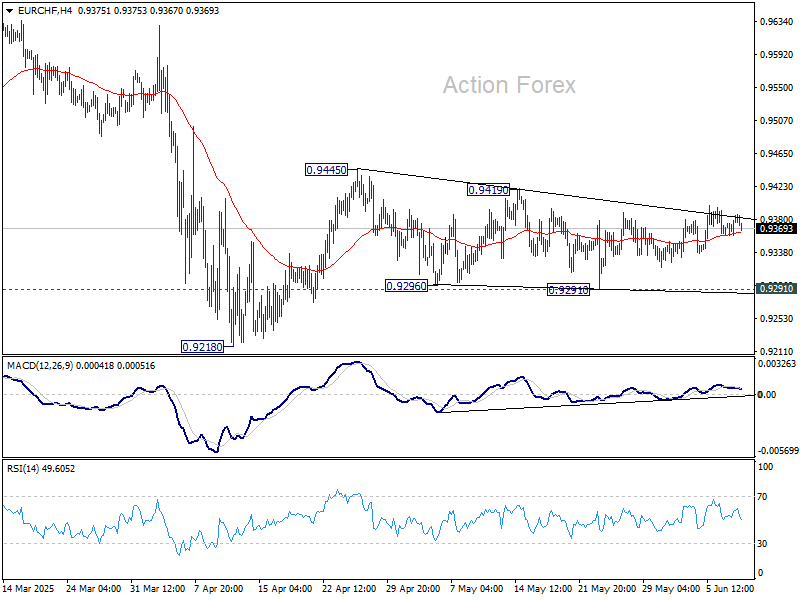
EUR/CHF Daily Outlook
Daily Pivots: (S1) 0.9352; (P) 0.9380; (R1) 0.9396; More....
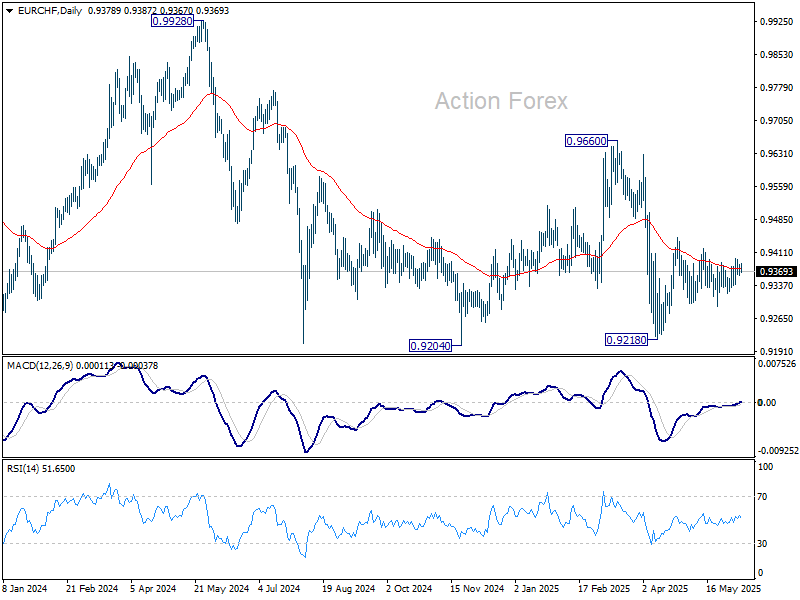
No change in EUR/CHF's outlook as range trading continues. Intraday bias stays neutral for the moment. Price actions from 0.9445 are seen as a triangle consolidation pattern, and thus rise from 0.9218 is not finished. Break of 0.9419 will argue that the rise, either as a correction to fall from 0.9660, or the third leg of the pattern from 0.9204, is ready to resume through 0.9445. Nevertheless, on the downside, firm break of 0.9291 will bring retest of 0.9218 low.
In the bigger picture, prior rejection by long-term falling channel resistance (now at 0.9527) retains medium term bearishness. That is, down trend from 1.2004 (2018 high) is still in progress. Firm break of 0.9204 (2024 low) will confirm resumption. This will remain the favored case as long as 0.9660 resistance holds.
Tonight’s $58bn 3-Year Auction Serves as a First Indication for Investor Appetite for US Bonds
Markets
US yields gave up a couple of basis points from Friday’s surge yesterday in choppy trading. The move end last week was inspired by the May payrolls report not delivering a feared-for downside surprise and news of imminent trade talks between the US and China. These discussions kicked off yesterday in London, will continue today and are centered around export curbs in tech (US) and rare earths (China). German Bunds underperformed slightly with net daily changes of no more than -2 bps at the front end of the curve. After last week’s 25 bps cut to 2%, ECB hawks are becoming a bit more vocal (Kazimir, Holzmann) but that doesn’t alter current market bets for one more late-2025 reduction to 1.75%. Trade optimism kept especially US stocks supported, with the likes of S&P 500 holding on to recent gains and trading an inch (+/- 2%) below the February record high. USD bulls stayed cautious with the greenback trading in the defensive at the start of the new week. EUR/USD rose slightly (above 1.14) to keep the short-term upward trading channel in tact. DXY holds near the recent lows in a tight sideways trading range around the 99 lever. Sterling is still going nowhere. EUR/GBP for all of June so far hovered slightly above 0.84.
Japan’s yen this morning briefly fell to above USD/JPY 145. Bank of Japan governor Ueda doused any market expectations for a rate hike short-term as inflation is still some distance from its inflation goal (ie achieving 2% sustainably). Asian trading otherwise is mostly inspired by the “fruitful” US-Sino trade talks. That’s pushing most stock indices into the green as well as supporting the US dollar. The overall tone for now indeed is a constructive one but predicting the outcome is impossible, including for markets. Other things to watch today while the trade topic is running in the background is tonight’s $58bn 3-year auction. This serves as a first indication for investor appetite for US bonds ahead of the more important 10-yr and especially 30-yr auctions tomorrow and Thursday. Some major market players last week declared a buyers strike for the latter. Weak sales are likely to prompt Treasury and dollar losses. The greenback avoided a test of the April EUR/USD high (1.1573) but the risk is not at all gone. Its growing more fundamental and institutional vulnerabilities are being laid bare by US administration’s decision to send marines to LA after having federalized National Guard troops to address civil unrest. That started on Friday when federal agents arrested several immigrants during a targeted operation. GBP erases early gains after this morning’s April labour market report. Wage growth was strong but slightly below expectations while the unemployment rate rose to 4.6%. The bigger-than-expected employment growth (89k vs 40k) in the three months through April was offset by a poor (but only indicative) reading for the month May (-109k).
News & Views
According to the May Survey of Consumer expectations of the Federal Reserve ban of New York, households’ inflation expectations declined at all three horizons. At the same time, consumers’ recent pessimism about the labour market eased somewhat, while consumer debt delinquency expectations and expectations about one’s household financial situation improved slightly. One-year-ahead inflation expectations declined by 0.4 ppt to 3.2%, three-year-ahead expectations declined by 0.2 ppt to 3.0%, and five-year-ahead expectations declined by 0.1 ppt to 2.6%. The survey’s measure of disagreement across respondents (decreased at all three horizons. Median home price growth expectations decreased by 0.3 ppt to 3.0%. This series has been moving in a narrow range between 3.0% and 3.3% since August 2023. Expectations on the labour market also improve slightly. 1-y ahead earnings growth was seen at 2.6% (+0.2%), but remains below the 12 average. Unemployment expectations also declined. The mean probability of losing one’s job in the next 12 months decreased 0.5 ppt to 14.8% and the probability of leaving one’s Job voluntarily increased marginally.
The Finance Minister of Sweden, Elisabeth Svantesson, yesterday said that new military spending in the country for a couple of years (potentially four or five years) will be financed by debt. in this respect, the Fin Min said that the country will use the strength of the economy including a public debt of only just over 30% of GDP to step up defense spending. The government has the indication spend SEK 300 bln for the military over the next decade and wants to reach military spending of 3.5% of GDP in 20230. According to the Fin Min, the country will need to look for permanent financing to cover the need for military spending in the long run.