
Sample Category Title
GBP/USD Daily Outlook
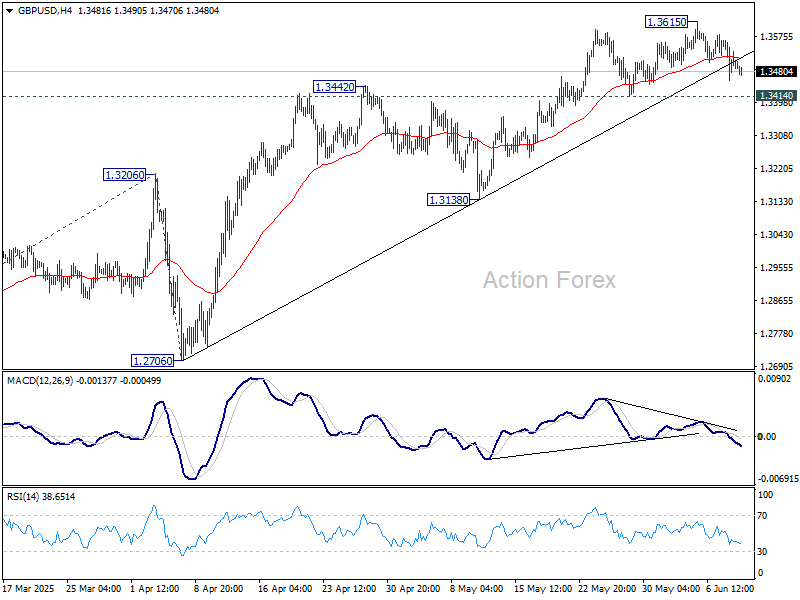
Daily Pivots: (S1) 1.3444; (P) 1.3510; (R1) 1.3563; More...
Intraday bias in GBP/USD remains neutral at this point. With 1.3414 support intact, further rally remains in favor. On the upside, break of 1.3615 will resume the rally from 1.2099 and target 100% projection of 1.2099 to 1.3206 from 1.3138 at 1.3813. Considering bearish divergence condition in 4H MACD, break of 1.3414 support should confirm short term topping, and bring deeper correction to 1.3138 support instead.
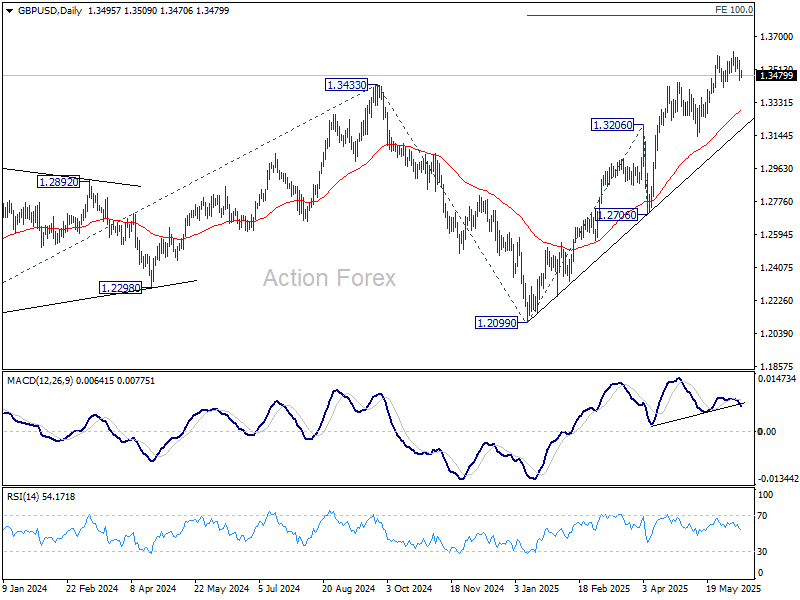
In the bigger picture, up trend from 1.3051 (2022 low) is in progress. Next medium term target is 61.8% projection of 1.0351 to 1.3433 from 1.2099 at 1.4004. Outlook will now stay bullish as long as 55 W EMA (now at 1.2913) holds, even in case of deep pullback.
USD/CHF Mid-Day Outlook
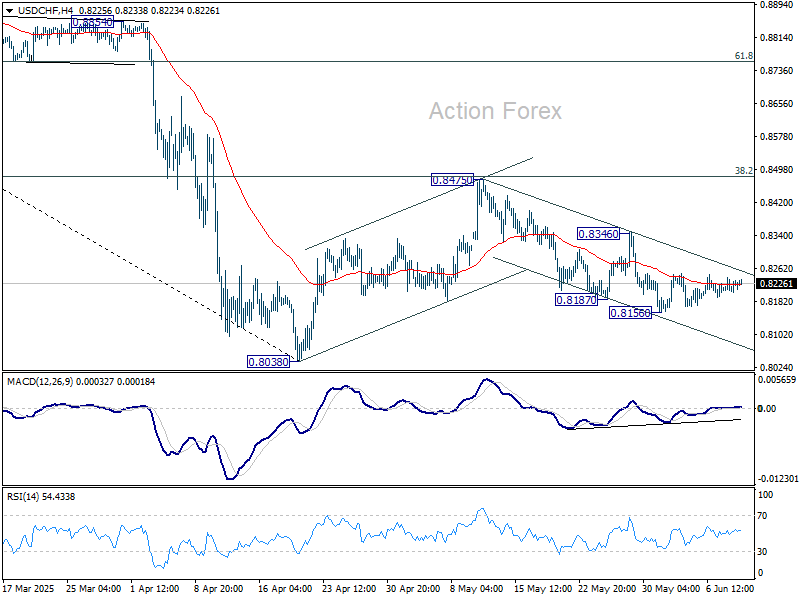
Daily Pivots: (S1) 0.8197; (P) 0.8213; (R1) 0.8234; More….
Intraday bias in USD/CHF remains neutral and outlook is unchanged. Price actions from 0.8038 are seen as a corrective pattern to decline from 0.9200. While fall from 0.8475 might extend lower, downside should be contained by 0.8038 to bring rebound. Break of 0.8436 resistance will suggest that it's already in the third leg of the correction, and target 0.8475.
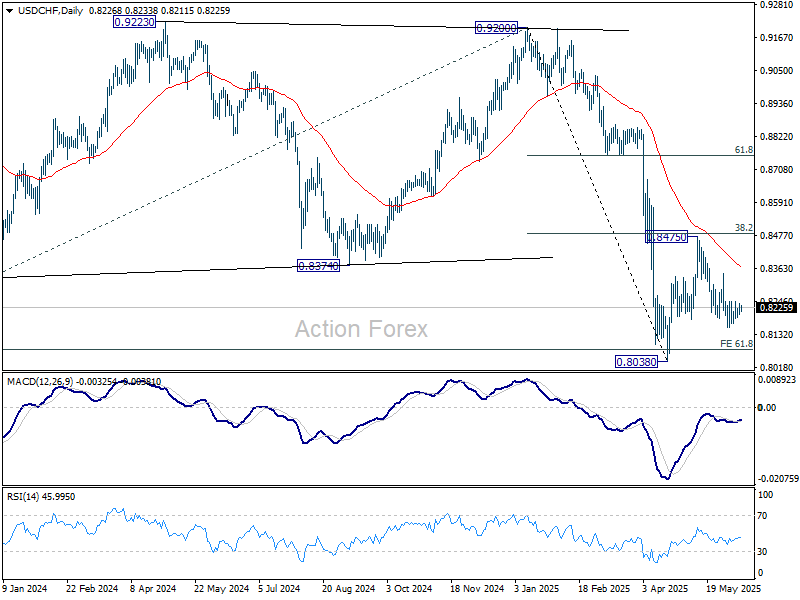
In the bigger picture, long term down trend from 1.0342 (2017 high) is still in progress and met 61.8% projection of 1.0146 (2022 high) to 0.8332 from 0.9200 at 0.8079 already. In any case, outlook will stay bearish as long as 55 W EMA (now at 0.8696) holds. Sustained break of 0.8079 will target 100% projection at 0.7382.
AUD/USD Daily Report
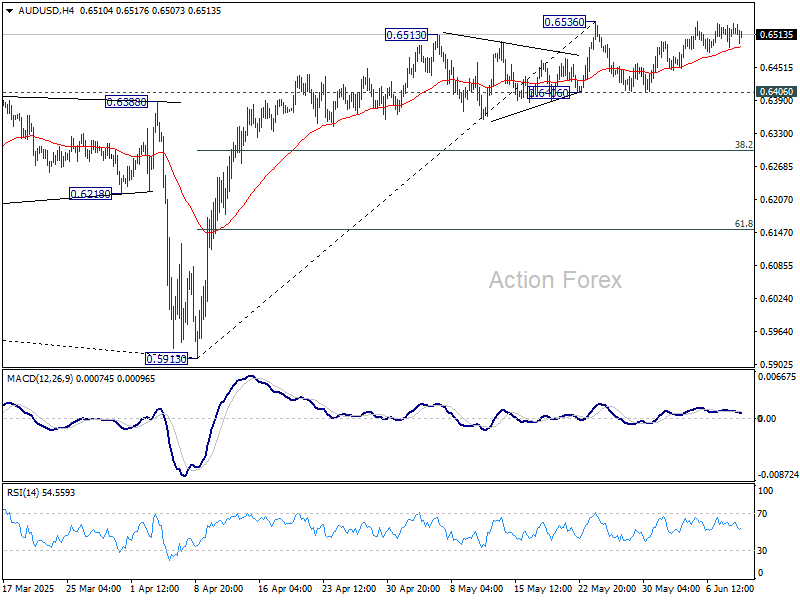
Daily Pivots: (S1) 0.6497; (P) 0.6515; (R1) 0.6540; More...
Intraday bias in AUD/USD remains neutral. More consolidations could be seen below 0.6538, but even in case of another dip, further rise is in favor as long as 0.6406 support holds. On the upside, decisive break of 0.6536 will resume the rally from 0.5913 to 61.8% retracement of 0.6941 to 0.5913 at 0.6548. However, firm break of 0.6406 will turn bias to the downside for 38.2% retracement of 0.5913 to 0.6536 at 0.6298.
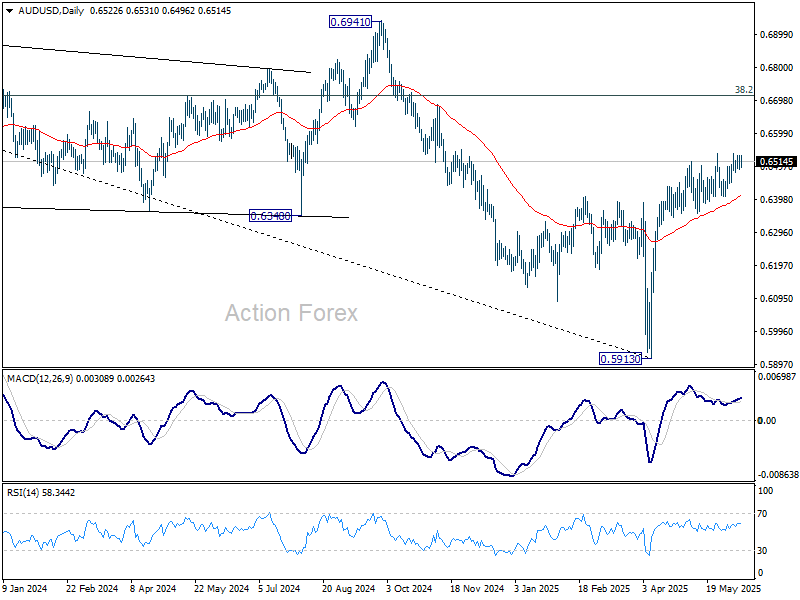
In the bigger picture, AUD/USD is still struggling to sustain above 55 W EMA (now at 0.6443) cleanly, and outlook is mixed. Sustained trading above 55 W EMA will indicate that rise from 0.5913 is at least correcting the down trend from 0.8006 (2021 high), with risk of trend reversal. Further rise should be seen to 38.2% retracement of 0.8006 to 0.5913 at 0.6713. However, rejection by 55 W EMA will revive medium term bearishness for another fall through 0.5913 at a later stage.
US and China Agreed to Restore the Geneva Trade Truce
Markets
The US and China agreed to restore the Geneva trade truce after a two‐day trade talk marathon in London. Both sides accused each other of violating the terms in recent days but have now found common ground. The news broke overnight and after US trading hours. Asian stock markets welcome the news but only cautiously. US equity futures appear to take it with a grain of salt although we should add that the likes of the S&P 500 have never really retraced on the trade matter when things escalated again. Either way it shows that markets are done with headline‐based trading and instead wait for actual results. And trade negotiations between the two largest economies of the world have merely just begun. The stoic dollar reaction is telling the same story. EUR/USD holds on to above 1.14, a level around it has been oscillating for all of June so far. DXY kept steady nearby 99. One of the largest FX moves were reserved for the pound. EUR/GBP shot up from as low as 0.8417 to 0.846. The trigger was a decent but slightly below‐consensus labour market report. Wages grew less than expected and a first, preliminary gauge for May showed employment shrunk the most since the pandemic erupted in 2020 (‐109k). Our feeling, however, is that this figure that’s subject to heavy revisions was more of a good excuse for GBP profit‐taking rather than anything else. US Treasuries traded mixed across the curve. The front underperformed (+1.6 bps). The 3‐yr $58bn auction tailed slightly but left no material traces. The onus remains on tonight’s 10‐yr and especially tomorrow’s 30‐yr sale. Longer maturities shed up to 1.3 bps. German bunds outperformed with net daily changes varying between ‐1.7 and ‐4.4 bps in a bull flattener.
Today’s economic calendar centers around US CPI. Consensus expects the headline reading to rise by 0.2% m/m and accelerate to 2.4% y/y from 2.3%. The core gauge should add 0.3% m/m to 2.9% y/y. It will be interesting to see a potential first impact of the trade tariffs, in particular on goods inflation. But that won’t change the Fed’s policy decision of next week. If anything, after Friday’s payrolls it will only make the job (at least from a communication point of view) easier: a resilient labour market, an economy not derailing so far and inflation above target with risks tilted to the upside means sticking to the sidelines for the time being. Current US money market pricing implies a Fed rate cut by October at the earliest. We find that reasonable given the circumstances. Barring major CPI surprises, the front end of the curve probably won’t budge much. The long end is eying tonight’s bond auction while the US dollar is stuck in directionless, sideways trading.
News and views
In an interview with Bloomberg yesterday, the Governor of the Czech national Bank (CNB), Alex Michl indicated that the CNB needs to keep its policy rate at the current level (3.5%) for some time. The CNB governor elaborated that the country still needs a high and positive real interest rate to keep inflation low in the longer term. The CNB in May after a pause further reduced its policy rate by 25 bps to 3.5%. Michl’s comments come after May inflation at 0.5% M/M and 2.4% Y/Y (up from 1.8% Y/Y in April) printed slightly higher than expected. In this respect, the CNB yesterday in a monthly comment on its website, analyzed that the rebound in May was expected and mainly due to higher volatile food prices. The outcome stays close to CNB spring forecasts. At the same time, the CNB indicates that inflation is not yet stabilized and requires a cautious monetary policy. Especially core inflation increased to 2.8% and will stay close to this level in the months ahead. This reflects the cost of owner‐occupied housing, which is accelerating due to strong house price growth. As a result, market services inflation remains elevated (4.6%), even though there are signs of a slight slowdown in the growth of other services prices (in restaurants, for example). The Czech koruna is well bid of late and trades near the strongest levels since June year (EUR/CZK 24.75 area).
Brazilian inflation in May eased slightly more than expected to 0.26% M/M and 5.32% Y/Y (from 0.43% M/M and 5.53% Y/Y in April). The slowdown was mainly driven by a slower rise in food prices (0.17%), lower transportations costs (‐0.37%) and a decline in prices of household goods (‐0.27%). On the other hand, higher electricity prices accelerated housing costs (1.19%). Even so, inflation still surpasses the central bank’s target (3.0% +/‐ 1.5%). The bank raised its policy rate by 50 bps to 14.75% at the May meeting and vowed a data‐dependent and flexible approach. The central bank meets next week. Even after the May inflation easing the debate remains open whether it will be enough for the bank to pause its tightening cycle or raise rates further.
Trade and Inflation in Focus
Trade headlines are striking an optimistic tone this week. According to Bloomberg, US and Chinese officials have agreed to a plan ‘to ease trade tensions,’ a move that could revive the flow of sensitive goods between the world’s two largest economies. Meanwhile, the US and Mexico appear close to finalising a deal that would lift the 50% tariffs on steel imports.
Risk sentiment across Asian markets is broadly positive. The Chinese CSI 300 is up 0.82% as of this writing, while the Hang Seng has gained 0.95%. US equities also closed higher yesterday, with Big Tech leading the advance on hopes that a trade deal could unlock the flow of rare earth metals.
Zooming in, Nvidia rose nearly 1% following news that TSMC’s May sales jumped 40%. Energy stocks rallied 1.8% as U.S. crude briefly tested a confluence of key technical levels — the 38.2% Fibonacci retracement of the year-to-date decline and the 100-day moving average. However, oil failed to close above that threshold. This morning, WTI is hovering near $65 per barrel, with sentiment supported by an apparent narrowing of supply–demand imbalances.
The US Energy Information Administration (EIA) yesterday projected that U.S. oil production has likely peaked and could fall to 13.37 million barrels per day next year — down 120,000 barrels from its May estimate. The agency also trimmed its global oil demand forecast, now expecting an increase of 800,000 barrels per day, down from a previous estimate of 1 million. However, demand projections may improve if trade tensions ease further.
Still, weaker US output is just one part of the global picture. OPEC+ supply increases, and the EIA expects global inventories to build by roughly 800,000 barrels per day. Add in the macro drag from trade-related uncertainty, and it’s unlikely we’ll see oil prices rally without restraint. Whether oil bulls can reverse the year-to-date slide may hinge on breaking through the critical $65.35/barrel level — the 38.2% Fibonacci retracement. Sustained optimism on trade will be key to validating a medium-term bullish reversal.
That said, US and European equity futures are modestly lower this morning, likely reflecting some disappointment over the lack of concrete detail in trade negotiations. Officials are now expected to present the proposals to their respective presidents.
In the meantime, international institutions are adjusting their growth outlooks. Following last week’s OECD downgrade, the World Bank cut its 2025 global growth forecast to 2.3% (down from 2.7% in January), citing trade tensions and policy uncertainty. That would mark the slowest pace of growth in 17 years, excluding crisis periods like the GFC and COVID.
Meanwhile, Citigroup is reportedly preparing to set aside several hundred million dollars more than last quarter to cover potential loan losses — an early indication that large U.S. banks may be bracing for a more challenging macro environment.
Weakening business and consumer sentiment — compounded by potential disruptions to global trade routes — could drag on economic activity and growth. Yet, equity markets remain near record highs, seemingly disconnected from these risks.
Interestingly, institutional exposure remains light. According to Deutsche Bank, equity positioning has only been lower 23% of the time since 2010. That suggests the recent rally may be driven largely by retail demand, which could explain the divergence between price action and fundamentals.
Still, equity bulls may need a solid narrative to push major U.S. indices to — and beyond — fresh all-time highs. The S&P 500 is currently less than 2% below its February peak, and the Nasdaq 100 is just 1.3% away from its own record. Small- and mid-cap stocks are rebounding more slowly, as rate cut expectations have been dialed back due to resilient U.S. labour data and upward inflation pressures tied to tariffs.
Today’s US CPI report will be key. Core inflation is expected to accelerate to its highest monthly pace this year. A hot print could dampen dovish Federal Reserve (Fed) expectations, push the US 2-year yield further above 4%, and weigh on equity sentiment. A cooler reading, however, may reignite rate cut hopes and support valuations.
In FX, the U.S. dollar is firmer in Asia, underpinned by positive trade news. The EURUSD is trading just below 1.14, while Cable slipped under 1.35 ahead of UK Chancellor Rachel Reeves’ budget announcements.
The UK jobs data released yesterday was grim: more than 250,000 jobs have been lost since October’s budget announcement. Higher taxes are weighing on employment and sustaining inflationary pressure, complicating the Bank of England’s (BoE) policy outlook. Still, markets are increasingly pricing in rate cuts amid signs of further weakness.
Despite that, the FTSE 100 remains near all-time highs. With limited exposure to the domestic economy and strong representation from energy and financials, the index may continue to benefit from softer BoE expectations and supportive global headlines — even if the domestic backdrop darkens.
US CPI Takes Centre Stage Today
In focus today
The most important data release today will be the US May CPI. We forecast headline inflation at +0.2% m/m SA (2.5% y/y) and core inflation at +0.2% m/m SA (2.9% y/y) - slightly below consensus on the latter. We expect firms to gradually pass through the rising tariff costs to core goods and food prices, but also that services inflation will continue to moderate.
Economic and market news
What happened overnight
US and China finished two days of trade talks in London last night agreeing on a framework for implementing the consensus reached between the two countries' leaders. The framework will have to be approved by US President Donald Trump and China's President Xi Jinping. There were no details on what was in the framework, but US Commerce Secretary Howard Lutnick said that they expect that the topic of rare earth minerals will be resolved in the framework implementation. Probably today or tomorrow we will get more details if the two presidents approve it, which seems likely. Chinese negotiators stated that "we hope the progress made will be conducive to building trust". The talks are seen as positive for markets in the short term, but we know from previous trade talks that the good mood can fade quickly between the two sides. It will be key for China in the short term that the US does not implement new tech restrictions.
What happened yesterday
In euro area, investor confidence saw an upswing as the Sentix Investor Confidence Indicator rose to 0.2 in June, marking the highest level in a year. Consensus had expected an increase to -5.5 from -8.1 in May, making this a notably positive surprise. Despite the on-going trade uncertainty investor confidence has thus rebounded and is now higher than the before Trump's "liberation day" according to Sentix.
In Denmark, inflation in May remained relatively stable, increasing to 1.6% y/y from 1.5%. Food prices surged by 1.7%, resulting in an annual food inflation rate of 5.2%. Core inflation remains subdued, aligning well with our updated forecast from last week, where we expect annual inflation to be 1.5% in 2025 and 1.6% in 2026. Inflation remains below the 2% target, underlining that despite a robust labour market and substantial wage increases domestically, the underlying price pressure is well-managed.
In Sweden, the Riksbank's business survey highlights a worsening outlook as businesses grow more pessimistic about economic development. Rising trade tensions and global uncertainty are dampening demand expectations, particularly in manufacturing and construction, while retail shows some resilience. April's activity showed improvement, with the GDP indicator rising by 0.4% m/m, despite its usual unreliability. Moreover, the consumption indicator increased by 0.5% m/m, supporting our forecast that private consumption is regaining strength. Despite a 6.3% m/m decline in industrial orders, the overall outlook remains positive.
In Norway, core inflation for May came in lower than expected at 2.8% ý/y. Norges Bank had projected 3.1% y/y while consensus was for a 2.9% y/y print. As anticipated, food prices moved higher whereas transportation costs decreased following Easter-related impact in April's figures. Apart from these adjustments, there were only minor surprises, the most notable being a slowdown in rent inflation from 3.9% y/y to 3.6% y/y.
Equities: Equity markets edged higher yesterday in a slow and cautious grind. Most notable was the unusual sector dynamic beneath the surface: despite the broader risk-on tone and steadily declining volatility, defensive sectors outperformed. Or rather financials and industrials came under pressure - with banks being the worst performing industry group in Europe - even as yields moved broadly sideways. More broadly, cross-asset volatility remained subdued throughout Tuesday's session, even in the face of a string of moderately market-relevant data prints and ongoing trade discussions between the US and China held in the UK. The lack of reaction across equities, rates, FX, and commodities speaks to a market in wait-and-see mode, with positioning increasingly skewed toward complacency. In the US yesterday, Dow +0.3%, S&P 500 +0.6%, Nasdaq +0.6%, Russell 2000 +0.6%. This morning, Asian markets are higher while futures in both Europe and the US are marginally lower.
FI & FX: Treasuries and the USD little changed on the news coming out after the trade negotiations between US and China ended and ahead of today's US CPI. US10y around 4.47% and EUR/USD at 1.14. Asian equities are trading mostly in green this morning with Hang Seng +1.0% while futures indicate a negative opening. EUR/SEK ignored the activity data and the Riksbank company survey and thus remains stuck just below 11.00. Benign inflation data pulled Norwegian short rates lower and weighed on the NOK.
USD/CAD Daily Outlook
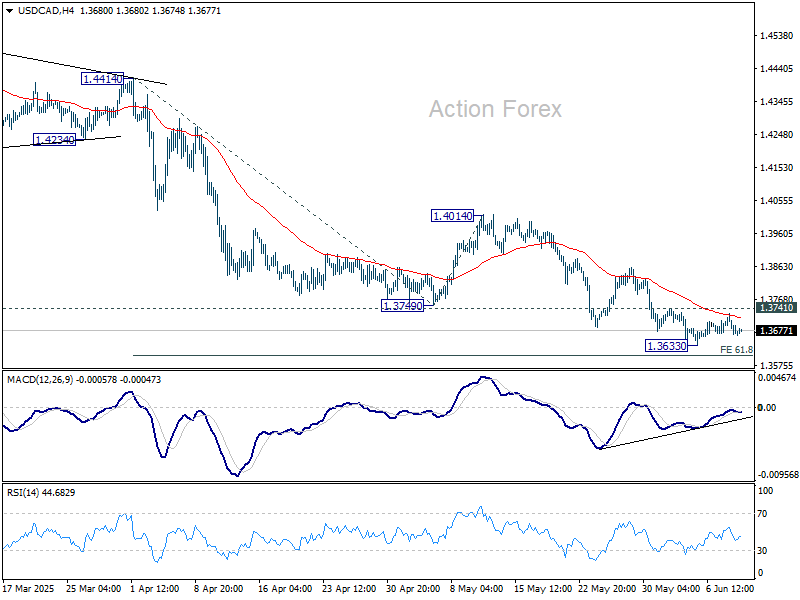
Daily Pivots: (S1) 1.3650; (P) 1.3689; (R1) 1.3711; More...
Intraday bias in USD/CAD remains neutral at this point. Considering bullish convergence condition in 4H MACD, firm break of 1.3741 will indicate short term bottoming at 1.3633. Intraday bias will turn back to the upside for stronger rebound to 1.4014 resistance, as a correction to fall from 1.4791. Nevertheless, decisive break of 61.8% projection of 1.4414 to 1.3749 from 1.4014 at 1.3603 will pave the way to 100% projection at 1.3349.
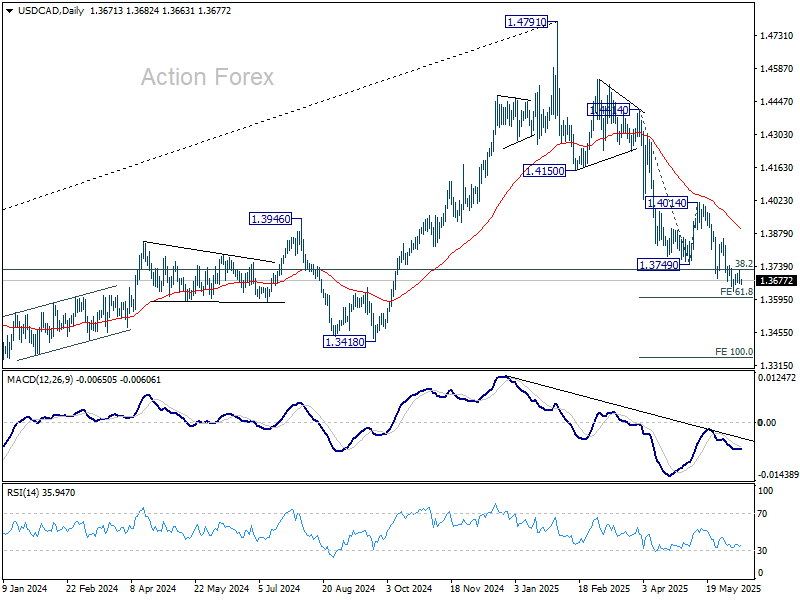
In the bigger picture, price actions from 1.4791 medium term top could either be a correction to rise from 1.2005 (2021 low), or trend reversal. In either case, further decline is expected as long as 1.4014 resistance holds. Firm break of 38.2% retracement of 1.2005 (2021 low) to 1.4791 at 1.3727 will pave the way back to 61.8% retracement at 1.3069.
Fragile Trade Progress and CPI Ahead Keep Risk Appetite in Check
Asian equities edged modestly higher on Wednesday, lifted by the announcement that US and Chinese officials reached a “framework” to implement the Geneva trade consensus and advance commitments made in the latest Trump-Xi phone call. While officials from both sides struck an optimistic tone, the agreement remains preliminary, lacking substantive details on thornier issues.
US Commerce Secretary Howard Lutnick confirmed that the deal would still require presidential approval on both sides before moving forward. One of the key elements of the framework involves China’s rare-earth exports, a pivotal issue as the US seeks to stabilize supply chains. Lutnick said the US expects export restrictions to be eased, with reciprocal rollback of recent US technology export bans to China.
However, the broader market reaction was muted. The US Court of Appeals allowed Trump’s contested tariffs to remain in place pending further legal review, undermining hopes of swift tariff rollback. The ruling enables the continued enforcement of “Liberation Day” tariffs, which apply to imports from major partners. This legal backdrop, coupled with still-fragile diplomatic progress, reinforces the market’s caution.
In the currency markets, the overall tone is mixed, with Swiss Franc and Dollar leading as the day’s strongest performers so far, followed by Loonie. On the other end, risk-sensitive currencies Kiwi and Aussie are softer, alongside Sterling. Euro and Yen are positioning in the middle of the pack. Despite modest equity gains, this is far from a full-fledged risk-on environment.
Attention now shifts to two major US events: US CPI report and 10-year Treasury note auction. The inflation data will serve as a critical barometer for how much of the tariff impact is bleeding into consumer prices. Simultaneously, the Treasury auction will test investor appetite for government debt amid lingering concerns over deficits, erratic trade policies, and rising issuance needs.
In Asia, at the time of writing, Nikkei is up 0.50%. Hong Kong HSI is up 0.92%. China Shanghai SSE is up 0.55%. Singapore Strait Times is down -0.51%. Japan 10-year JGB yield is down -0.017 at 1.463. Overnight, DOW rose 0.25%. S&P 500 rose 0.55%. NASDAQ rose 0.63%. 10-year yield fell -0.008 to 4.474.
Inflation data and treasury auction pose twin tests for US Bond Market
Two major events in the US are closely watched today. The May CPI report and the USD 39B 10-year Treasury auction converge to test sentiment in the bond market.
The May CPI will offer the clearest signal yet of whether tariffs are beginning to filter through to consumer prices. Economists expect a 0.2% mom gain, with annual headline inflation accelerating to 2.5%. Core CPI, is projected to rise 0.3% mom and accelerate to 2.9% yoy.
While today’s CPI reading will provide an initial glimpse, the real acceleration in prices may come in June as tariffs ripple through supply chains. The unpredictability of Trump’s trade strategy, frequent shifts between escalation and truce, could delay the impact but increasing its persistence. Fed’s challenge is not only identifying if inflation is returning, but determining whether it’s sticky enough to warrant policy action beyond holding rates steady.
Meanwhile, the 10-year Treasury auction will act as a referendum on fiscal credibility. With swelling deficits, an uncertain trade outlook, and ballooning spending commitments—including the administration’s touted “big, beautiful” infrastructure and defense budgets—investors will be watching bid-to-cover ratios and indirect bidder participation for signs of strain. A weak auction could rekindle fears of waning demand for US debt, driving yields higher and possibly stoking volatility across asset classes.
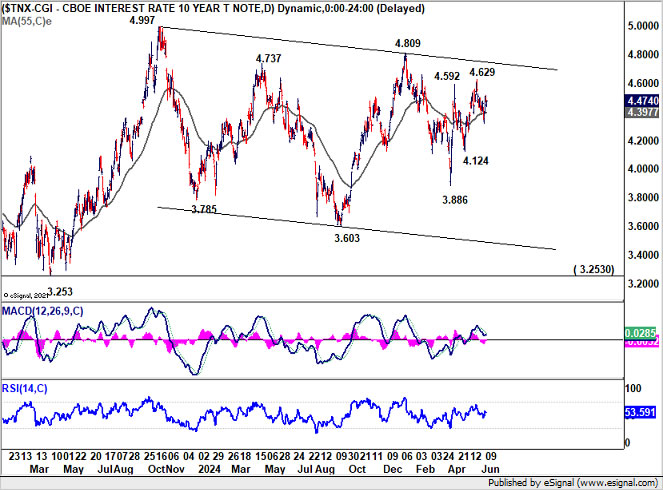
Technically, the 10-year yield has remained within a broad range since peaking at 4.997 in 2023. While it spiked to 4.629% in May following Moody’s downgrade of the US credit rating, the move was limited and quickly retraced. As long as the 4.809 resistance level caps upside attempts, the bond market appears relatively calm—though not immune to future shocks.
Japan’s CGPI cools to 3.2% in May, but food inflation continue to rise
Japan’s corporate goods price index slowed more than expected in May, easing from 4.1% to 3.2% yoy, versus the anticipated 3.5% yoy. The decline reflects the broader disinflationary trend in upstream prices, aided by the recent rebound in Yen. Yen-based import price index plunged -10.3% yoy, a sharper drop than April’s -7.3% yoy.
Falling raw material costs were evident across sectors, with steel prices down -4.8% yoy, chemicals -3.1% yoy, and non-ferrous metals -2.1% yoy
However, consumer-related categories showed more persistence in inflation. Prices of food and beverages accelerated to 4.2% yoy from April’s 4.0% yoy, suggesting that inflationary stickiness in essential goods remains a challenge despite broader producer-side cooling.
USD/CAD Daily Outlook
Daily Pivots: (S1) 1.3650; (P) 1.3689; (R1) 1.3711; More...
Intraday bias in USD/CAD remains neutral at this point. Considering bullish convergence condition in 4H MACD, firm break of 1.3741 will indicate short term bottoming at 1.3633. Intraday bias will turn back to the upside for stronger rebound to 1.4014 resistance, as a correction to fall from 1.4791. Nevertheless, decisive break of 61.8% projection of 1.4414 to 1.3749 from 1.4014 at 1.3603 will pave the way to 100% projection at 1.3349.
In the bigger picture, price actions from 1.4791 medium term top could either be a correction to rise from 1.2005 (2021 low), or trend reversal. In either case, further decline is expected as long as 1.4014 resistance holds. Firm break of 38.2% retracement of 1.2005 (2021 low) to 1.4791 at 1.3727 will pave the way back to 61.8% retracement at 1.3069.
Elliott Wave Insight: Dow Futures (YM) Set to Wrap Up Wave 3 Soon
Since reaching its low on April 7, 2025, Dow Futures (YM) has shown signs of recovery. The Index has initiated a rally that requires further development to confirm whether the April 7 low will hold as a significant bottom. To establish this, the Index needs to either achieve a new all-time high or complete a clear five-wave structure from the April 7 low. Either of these developments would significantly reduce the probability of the Index undergoing a larger double correction. Currently, the rally from the April 7 low is in progress and appears to be forming an impulsive structure. An impulse is typically a strong bullish signal in technical analysis.
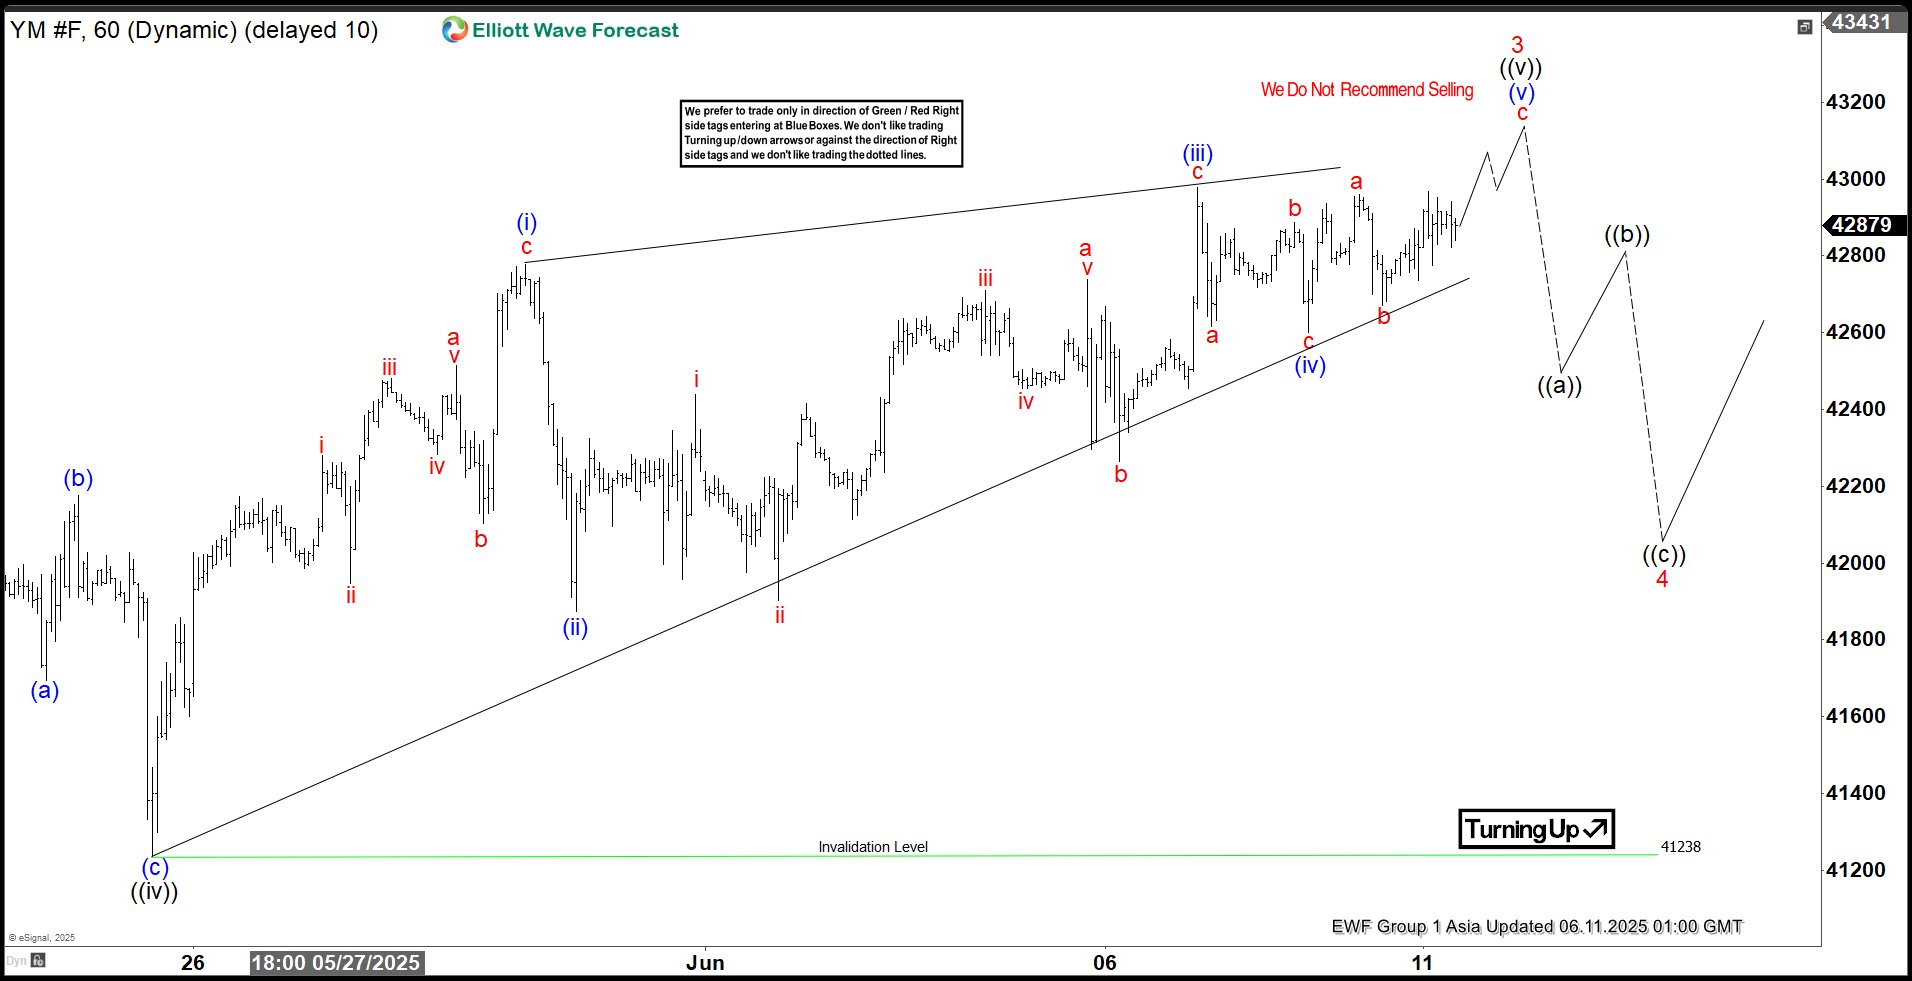
From the April 7 low, the rally has unfolded as follows: wave 1 peaked at 39,427. A corrective wave 2 then followed which ended at 36,882. The ongoing wave 3 is subdividing into a smaller-degree impulse, indicating continued upward momentum. Within wave 3, wave ((i)) concluded at 41,140, and the subsequent pullback in wave ((ii)) ended at 37,998. The advance in wave ((iii)) reached 42,976, with the corrective wave ((iv)) bottoming at 41,236. Currently, wave ((v)) is forming as an ending diagonal, a pattern often signaling the final stage of a move. As long as the Index remains above 41,238, expect one more push higher to complete wave ((v)), which should also finalize wave 3 in the higher degree. Following this, the Index is anticipated to experience a larger-degree wave 4 pullback, likely unfolding in a 3, 7, or 11-swing corrective pattern, before resuming its upward trajectory.
Dow Futures (YM) 60-Minute Elliott Wave Technical Chart
YM Elliott Wave Technical Video
https://www.youtube.com/watch?v=q0bZe3mZoSA
Inflation data and treasury auction pose twin tests for US Bond Market
Two major events in the US are closely watched today. The May CPI report and the USD 39B 10-year Treasury auction converge to test sentiment in the bond market.
The May consumer price index (CPI) will offer the clearest signal yet of whether tariffs are beginning to filter through to consumer prices. Economists expect a 0.2% mom gain, with annual headline inflation accelerating to 2.5%. Core CPI, is projected to rise 0.3% mom and accelerate to 2.9% yoy.
While today’s CPI reading will provide an initial glimpse, the real acceleration in prices may come in June as tariffs ripple through supply chains. The unpredictability of Trump’s trade strategy, frequent shifts between escalation and truce, could delay the impact but increasing its persistence. Fed’s challenge is not only identifying if inflation is returning, but determining whether it’s sticky enough to warrant policy action beyond holding rates steady.
Meanwhile, the 10-year Treasury auction will act as a referendum on fiscal credibility. With swelling deficits, an uncertain trade outlook, and ballooning spending commitments—including the administration’s touted “big, beautiful” infrastructure and defense budgets—investors will be watching bid-to-cover ratios and indirect bidder participation for signs of strain. A weak auction could rekindle fears of waning demand for US debt, driving yields higher and possibly stoking volatility across asset classes.
Technically, the 10-year yield has remained within a broad range since peaking at 4.997 in 2023. While it spiked to 4.629% in May following Moody’s downgrade of the US credit rating, the move was limited and quickly retraced. As long as the 4.809 resistance level caps upside attempts, the bond market appears relatively calm—though not immune to future shocks.