Sample Category Title
Dollar Losing Dominance as FX Markets Shift to Multiple Themes
The Dollar's decline paused on Friday as trading quietened ahead of the US Independence Day holiday, but the bigger story is not the day's price action. It is that the foreign exchange market is beginning to move beyond the one-dimensional narrative that dominated much of the second quarter. For weeks, almost every major currency traded as a reflection of one question: would the Federal Reserve tighten policy further? After this week's payrolls report, that monopoly is beginning to break.
Thursday's employment data did not paint the picture of a rapidly deteriorating labor market. Unemployment unexpectedly fell and wage growth remained firm. Yet payroll growth slowed much more than anticipated, reinforcing the view that the labor market is cooling rather than overheating. Combined with the sharp decline in oil prices following the US-Iran ceasefire, investors believe the Fed has time on its side. Futures markets have pared expectations for a September rate hike, while Treasury yields around 4.5% suggest markets are adjusting to a longer pause rather than pricing an imminent easing cycle.
That change in Fed expectations has not produced a classic "risk-on" response. Instead, it has encouraged investors to differentiate between sectors and currencies. The Dow Jones Industrial Average reached fresh record highs, while the NASDAQ retreated after reports that Meta Platforms intends to sell excess AI computing capacity fuelled concerns that the AI infrastructure spending boom could be approaching saturation. Rather than lifting all growth stocks, lower rate expectations triggered a rotation away from semiconductor names and into other parts of the market.
The same pattern is emerging in foreign exchange. Dollar is the week's weakest major currency, but selling has been selective rather than broad-based. Sterling continues to outperform as markets focus on the Bank of England's relatively restrictive policy outlook. Euro remains pressured by rapidly fading expectations of further ECB tightening after softer inflation data. Yen, meanwhile, has developed a story of its own. Reports that Tokyo is shifting toward surprise intervention rather than publicly defending exchange-rate levels have fundamentally changed how traders assess intervention risk.
That message was reinforced on Friday when Finance Minister Satsuki Katayama stressed that Japan's stance "has not changed at all" and that authorities "will respond appropriately at any time as needed." He also highlighted that Tokyo remains in regular contact with Washington on foreign exchange matters despite the US holiday. Whether intervention actually took place this week may ultimately matter less than the shift in strategy itself.
Markets are entering a period where local policy paths, intervention risks and domestic fundamentals drive currency performance. The Dollar remains central to global markets, but it is not the only story.
UK Services PMI Falls to Lowest Since 2023 as Demand Weakens Despite Cooling Cost Pressures
UK Services PMI fell to its lowest level since January 2023 in June as new orders declined for a fourth straight month, although easing cost pressures offered some relief.. Read More.
Eurozone PMI Services Stabilize While Cooling Inflation Supports ECB Pause
Lower oil prices are reshaping the Eurozone outlook. Discover why June's PMI survey points to stabilizing growth and fewer arguments for another ECB rate hike. Read More.
Japan Services PMI Rebounds While Rising Costs Keep Inflation Pressures Alive
Japan's Services PMI rebounded to 52.2 in June, lifting the Composite PMI to a three-month high as domestic demand strengthened despite weaker export business and persistent inflation pressures. Read More.
EUR/USD Daily Outlook
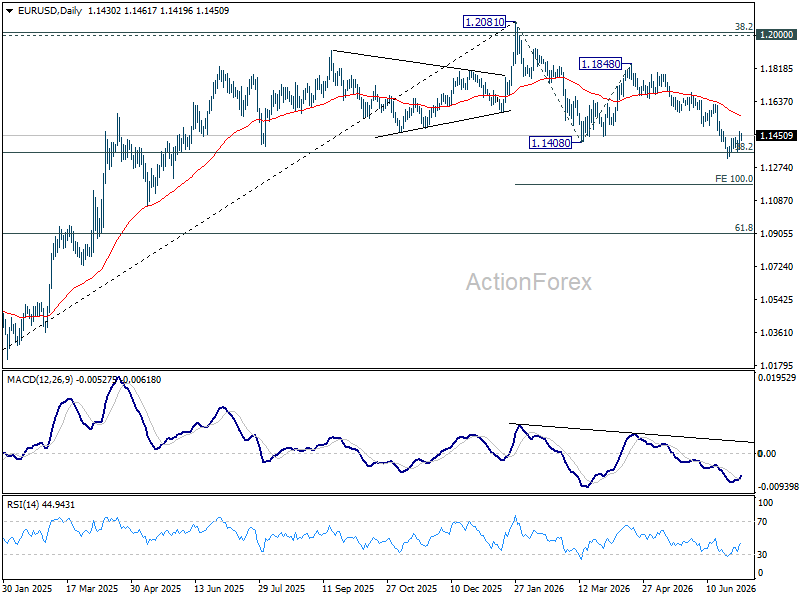
EUR/USD is staying below 1.1499 support turned resistance. Intraday bias remains neutral, and further decline is in favor. On the downside, break of 1.1323 will resume the fall from 1.2081 to 100% projection of 1.2081 to 1.1408 from 1.1848 at 1.1175. However, decisive break of 1.1499 will turn bias back to the upside for 55 D EMA (now at 1.1559) and above.
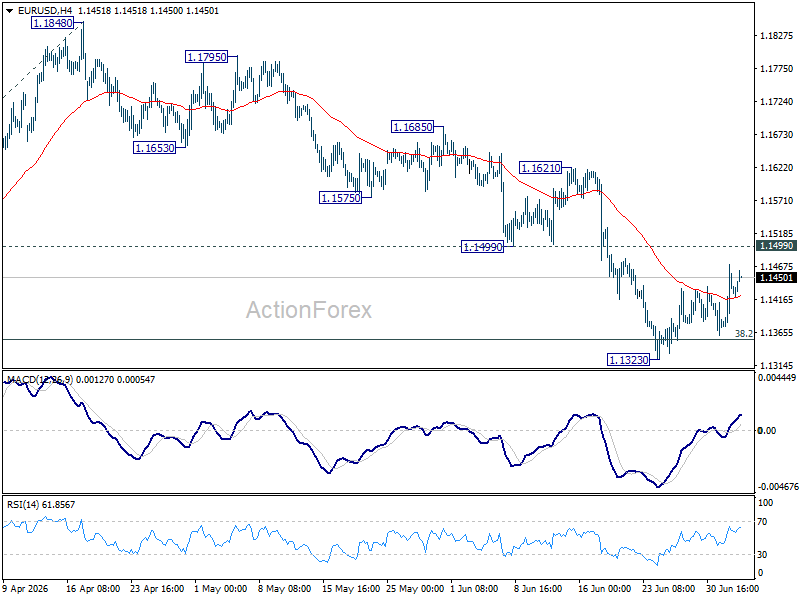
In the bigger picture, focus is back on 38.2% retracement of 1.0176 to 1.2081 at 1.1353. Decisive break there will revive the case of medium term bearish trend reversal after rejection by 1.2 key cluster resistance level. Further fall should be seen to 61.8% retracement at 1.0904. Nevertheless, strong rebound from 1.1353, followed by break of 1.1621 resistance, will retain medium term bullishness.
Gold Rises Sharply as Markets Reassess Fed Rate Outlook
Gold rose to 4,177 USD per troy ounce on Friday, having gained more than 2% in the previous session. The primary driver of the recovery was US labour market data, which came in weaker than expected, prompting investors to scale back expectations for further Federal Reserve interest rate hikes.
In June, the US economy added only 57,000 new jobs, falling well short of the 110,000 forecast – the weakest result in four months. The unemployment rate ticked up to 4.2%. Earlier in the week, the ADP report also pointed to slowing private-sector employment growth.
Following the data release, the probability of a Fed rate hike in September dropped to approximately 50%, down from 67% before the report. Additional support for the market came from comments by Fed Chair Kevin Warsh, who noted easing inflation expectations while reaffirming the regulator's commitment to price stability.
Reduced inflation risks remain a positive factor for gold. The restoration of commercial traffic through the Strait of Hormuz and progress in US–Iran negotiations have contributed to a further decline in oil prices, supporting sentiment towards the precious metals market.
Technical Analysis
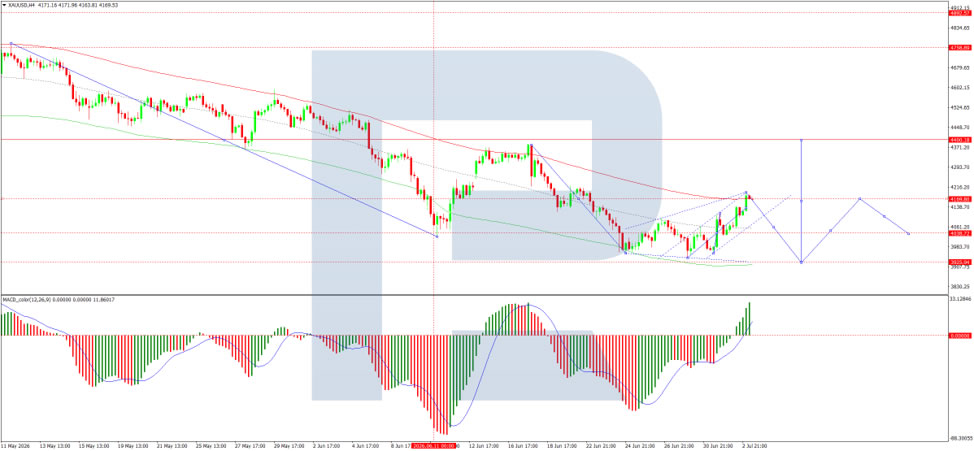
On the H4 XAU/USD chart, the market is trading within a consolidation range around the 4,038 USD level and has advanced to 4,190 USD. A move lower towards 3,929 USD is expected, followed by a potential rise to 4,170 USD, with scope for the trend to extend to 4,400 USD. The MACD indicator signals weakening upward momentum, with its signal line above the centre line but pointing firmly downwards.
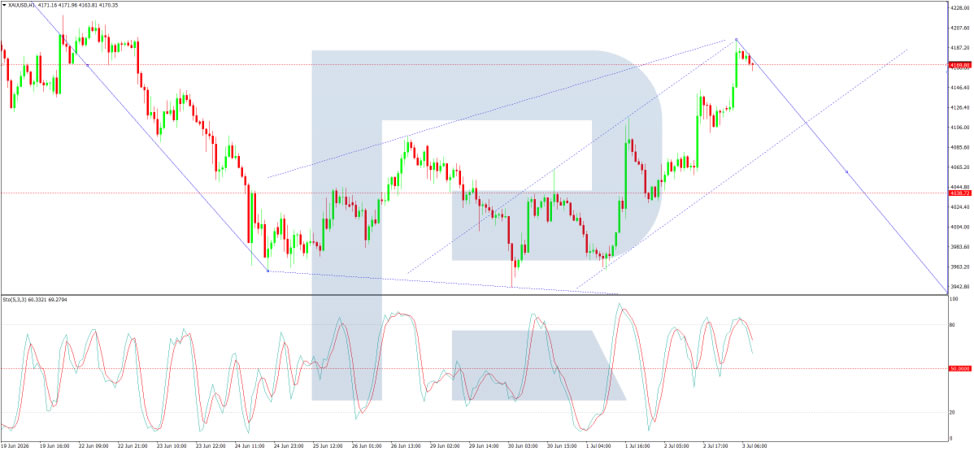
On the H1 chart, the market broke above the 4,141 USD level and moved higher to 4,190 USD. A decline towards 3,929 USD may follow, with a broad consolidation range forming around 4,060 USD. The Stochastic oscillator supports this scenario, with its signal line below 80 and pointing downwards towards 20, indicating increasing short-term downside pressure.
Conclusion
Gold has staged a sharp recovery following weaker-than-expected US labour market data, which significantly reduced expectations for further Fed rate hikes. The economy added just 57,000 jobs in June against a forecast of 110,000, while unemployment rose to 4.2%, reinforcing signs of a cooling labour market. Fed Chair Warsh's comments on easing inflation expectations have further supported the case for a more cautious rate outlook. At the same time, progress in US–Iran negotiations and the reopening of the Strait of Hormuz have helped lower oil prices, improving sentiment towards gold. Technically, gold appears poised for a near-term pullback towards 3,929 USD before potentially resuming its upward trajectory.
EUR/USD Daily Outlook
EUR/USD is staying below 1.1499 support turned resistance. Intraday bias remains neutral, and further decline is in favor. On the downside, break of 1.1323 will resume the fall from 1.2081 to 100% projection of 1.2081 to 1.1408 from 1.1848 at 1.1175. However, decisive break of 1.1499 will turn bias back to the upside for 55 D EMA (now at 1.1559) and above.
In the bigger picture, focus is back on 38.2% retracement of 1.0176 to 1.2081 at 1.1353. Decisive break there will revive the case of medium term bearish trend reversal after rejection by 1.2 key cluster resistance level. Further fall should be seen to 61.8% retracement at 1.0904. Nevertheless, strong rebound from 1.1353, followed by break of 1.1621 resistance, will retain medium term bullishness.
USD/JPY Daily Outlook
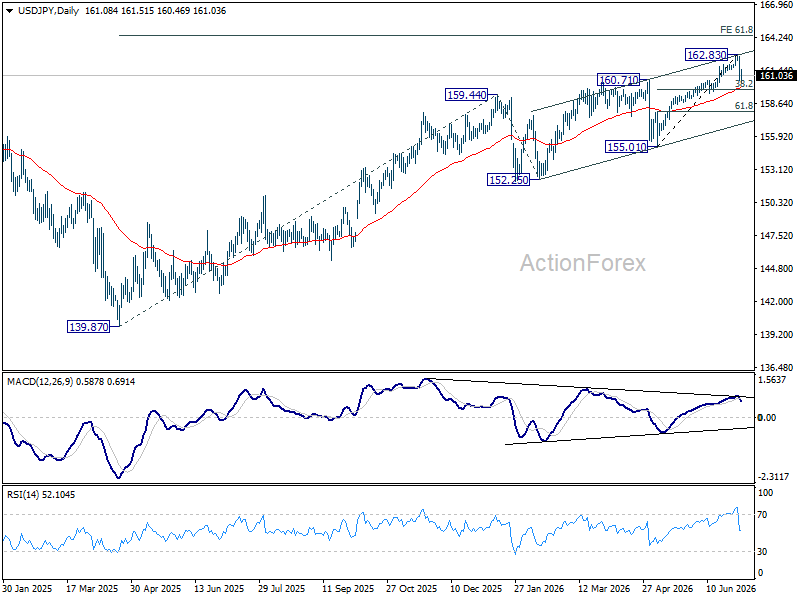
Intraday bias in USD/JPY remains mildly on the downside. Pullback from 162.83 short term top would extend to 38.2% retracement of 155.01 to 162.83 at 159.84. Since this level is close to 55 D EMA (now at 159.95), strong support should be seen from there to bring rebound. On the upside, above 161.63 minor resistance will turn intraday bias neutral. Overall, consolidations should continue below 162.83 for a while.
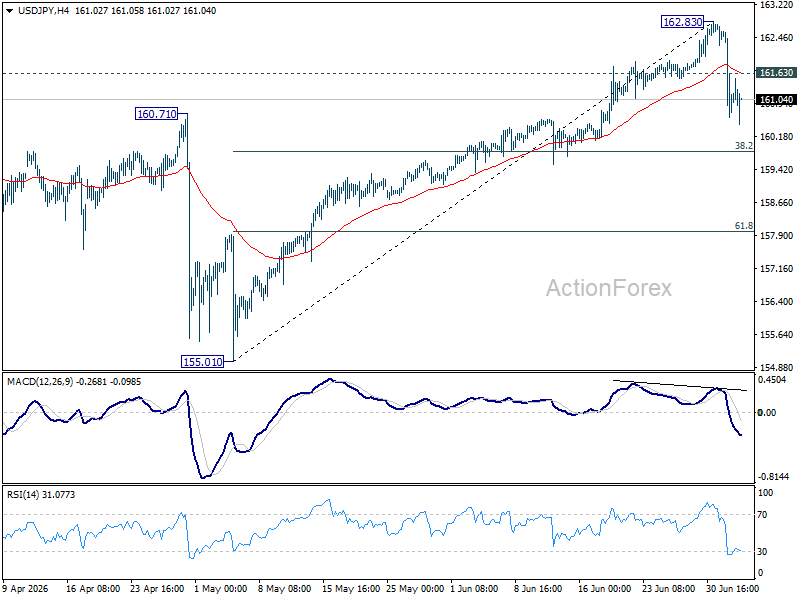
In the bigger picture, rise from 139.87 (2025 low) is seen as another rising leg of the long term up trend. Next target is 61.8% projection of 139.87 to 159.44 from 152.25 at 164.34. For now, outlook will remain bullish as long as 155.01 support holds, even in case of deep pullback.
GBP/USD Daily Outlook
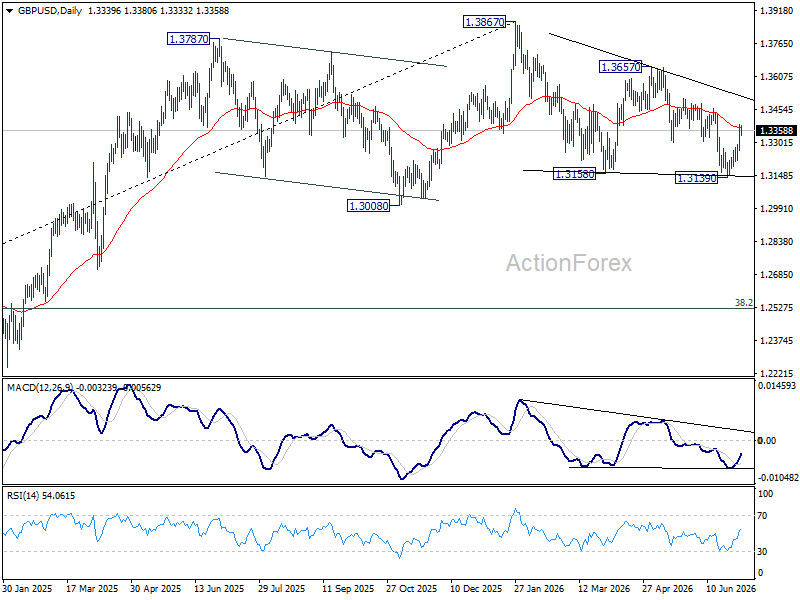
Intraday bias in GBP/USD remains on the upside for 1.3459 resistance. Firm break there will add to the case that correction from 1.3867 has completed at 1.3139. Next target is 1.3657 for confirmation. On the downside, below 1.3264 minor support will turn intraday bias neutral again first.
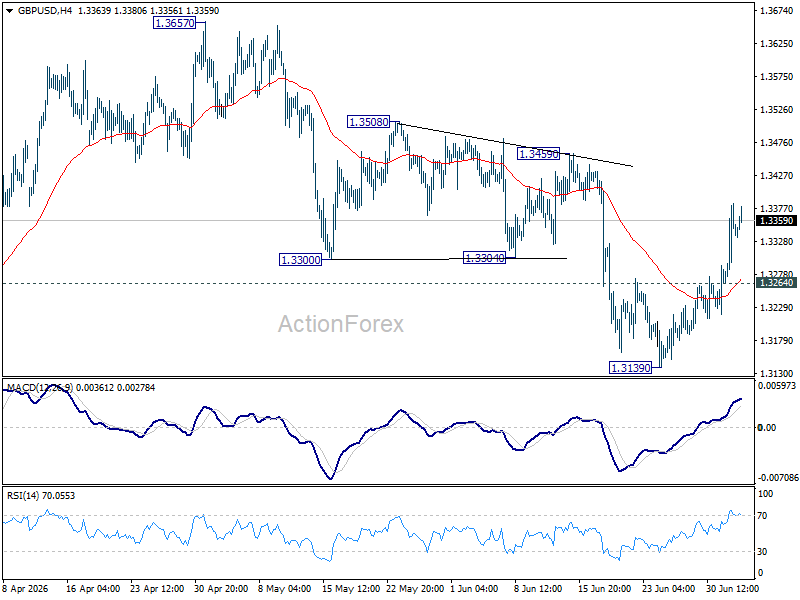
In the bigger picture, price actions from 1.3867 are a corrective pattern within the broader up trend from 1.0351 (2022 low). With 1.3008 support intact, medium term bullishness is maintained and break of 1.3867 is in favor for a later stage, towards 1.4248 key resistance (2021 high). However, firm break of 1.3008 will at least bring deeper fall to 38.2% retracement of 1.0351 to 1.3867 at 1.2524, with increased risk of bearish reversal.
USD/CHF Daily Outlook
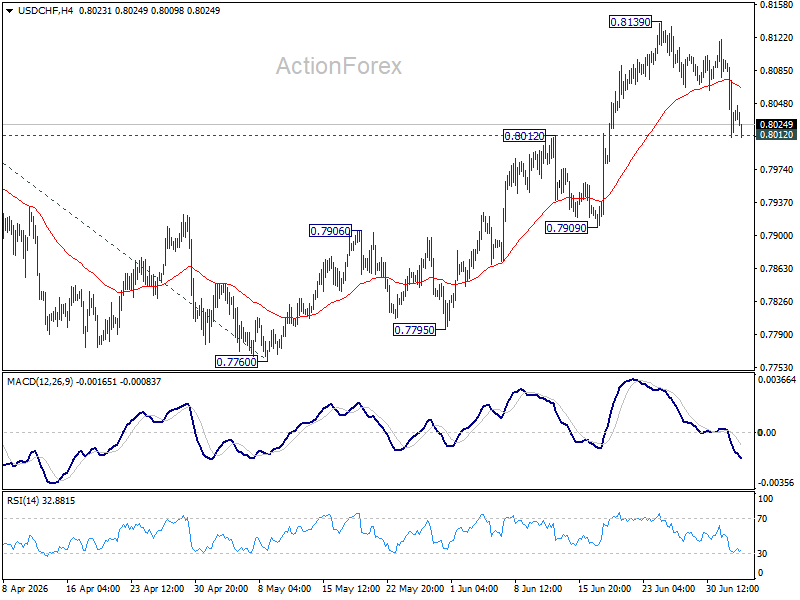
USD/CHF is still defending 0.8012 resistance turned support and intraday bias remains neutral first. On the upside, above 0.8139 will extend the larger rise from 0.7603 to 100% projection 0.7603 to 0.8041 from 0.7600 at 0.8198 next. However, sustained break of 0.8012 will bring deeper fall to 55 D EMA (now at 0.7951) and below.
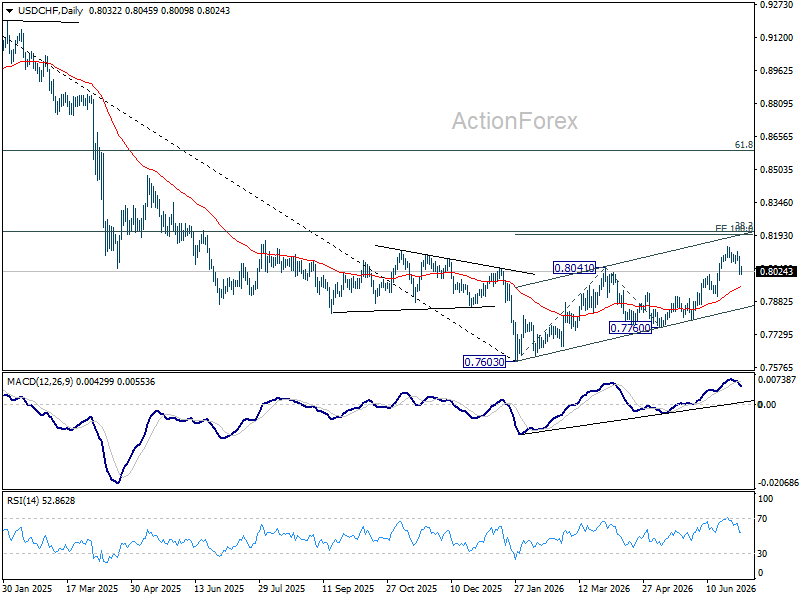
In the bigger picture, while a medium term bottom was formed at 0.7603, it's still early to call for bullish trend reversal. As long as 38.2% retracement of 0.9200 (2025 high) to 0.7603 at 0.8213 holds, the larger down trend could still continue through 0.7603 at a later stage. However, firm break of 0.7603 will argue that the trend has reversed and turn focus to 0.8332 support turned resistance (2023 low) for confirmation.
UK Services PMI Falls to Lowest Since 2023 as Demand Weakens Despite Cooling Cost Pressures
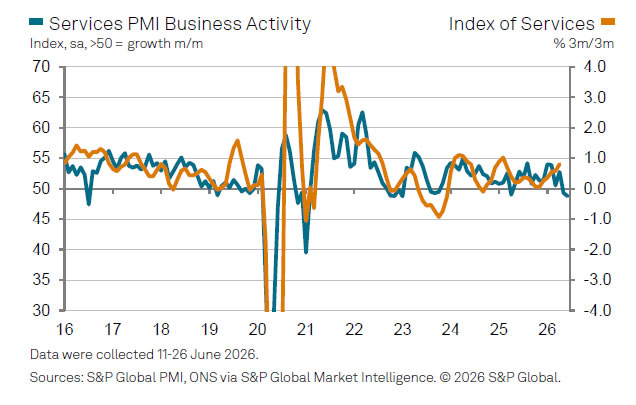
UK business activity weakened further in June as the services sector recorded its sharpest contraction in nearly three and a half years, highlighting a loss of economic momentum during the second quarter. The final S&P Global UK Services PMI Business Activity Index fell to 48.8 from 49.3 in May, its lowest reading since January 2023. The Composite PMI Output Index also slipped to 49.3 from 49.7, marking a second consecutive month below the 50.0 threshold and its weakest reading since April 2025.
The survey pointed to weakening demand as a key driver of the slowdown. New orders declined for a fourth straight month, with S&P Global describing the fall as the steepest in just over three and a half years. According to Economics Director Tim Moore, firms cited persistent cost pressures, subdued customer demand and uncertainty surrounding the Middle East conflict as the main factors weighing on activity. Businesses also reported fragile investment sentiment, greater client caution and pressure on household spending, all of which contributed to softer service-sector output.
There was, however, some encouragement on inflation. Input cost inflation eased to its lowest level since March, largely reflecting lower fuel prices following the decline in global oil prices. Although businesses continued to report higher transport, wage and raw material costs, the moderation in overall cost pressures should provide some relief. Business confidence also improved modestly on hopes that the US-Iran ceasefire will prove durable, but optimism remained well below levels seen at the start of the year as concerns over the broader UK economic outlook persisted.
| Indicator | Previous | Latest |
|---|---|---|
| Services PMI Business Activity | 49.3 | 48.8 |
| Composite PMI Output | 49.7 | 49.3 |
Ethereum: Has the Recovery Begun?
Ethereum has staged a notable rebound after once again testing the heavily watched psychological zone around 1500$. Since bouncing off this support, ETH/USD has climbed roughly 13%, now trading around the $1,700 mark.
This recovery is being driven by a combination of technical and fundamental factors. On the technical side, the aforementioned support zone has once again proven its relevance, attracting buyers at a historically significant level. On the fundamental side, the latest US Non-Farm Payrolls report added just 57,000 jobs in June, well below the 110K-115K consensus and a sharp slowdown from May's downwardly revised 129,000. Combined with a 74,000-job downward revision to the prior two months, the weaker print has weighed on the US Dollar, reducing the likelihood of near-term Fed rate hikes and boosting risk assets positioned as an alternative to the greenback — including cryptocurrencies.
Technical analysis of ETH/USD
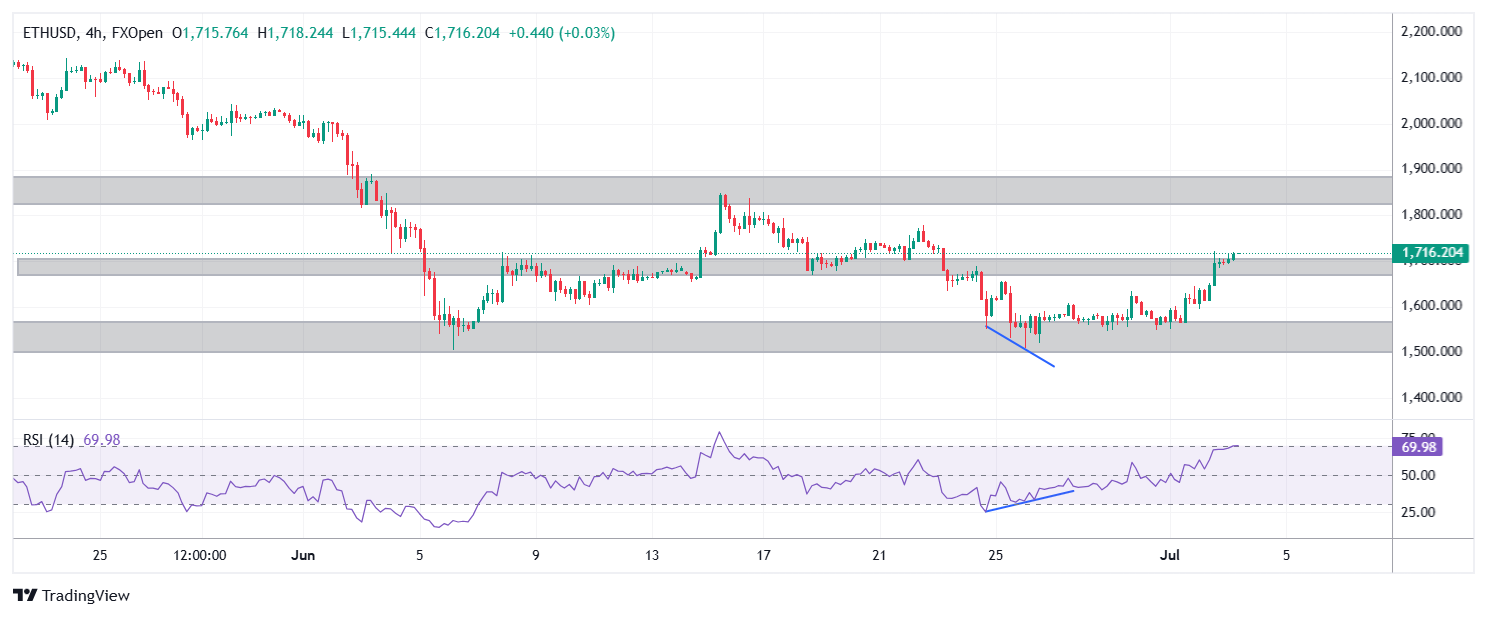
After bouncing off the $1,500 support zone, Ethereum seems to be directed to a key test at the former support, turned resistance, around $1,800.
Bullish scenario
A confirmed break and hold above the $1,800 level would allow ETH to sustain bullish momentum and begin forming a structure of higher highs and higher lows after months of bearish price action. This potential recovery also finds support from a notable bullish divergence on the 4-hour RSI, where a sequence of rising lows on the indicator contrasts with the sequence of falling lows on price, a signal that downward momentum may be fading.
Bearish scenario
Alternatively, as price approaches the $1,800 resistance, ETH could reject the level and resume its broader downtrend, slipping back below the intermediate $1,680–$1,700 zone. Such a move would suggest the asset still lacks the strength needed to break through this crucial threshold.
Investors and traders remain focused on new Fed Chair Warsh's statements and their impact on the DXY. Will a weaker Dollar Index prove to be the real catalyst for a bullish return across the crypto market?
FXOpen offers the world's most popular cryptocurrency CFDs*, including Bitcoin and Ethereum. Floating spreads, 1:2 leverage — at your service (additional fees may apply). Open your trading account now or learn more about crypto CFD trading with FXOpen.
*Important: At FXOpen UK, Cryptocurrency trading via CFDs is only available to our Professional clients. They are not available for trading by Retail clients. To find out more information about how this may affect you, please get in touch with our team.
This article represents the opinion of the Companies operating under the FXOpen brand only. It is not to be construed as an offer, solicitation, or recommendation with respect to products and services provided by the Companies operating under the FXOpen brand, nor is it to be considered financial advice.
The Crypto Market Is Rebounding: BTC Needs $67K to Reverse Course
Market Overview
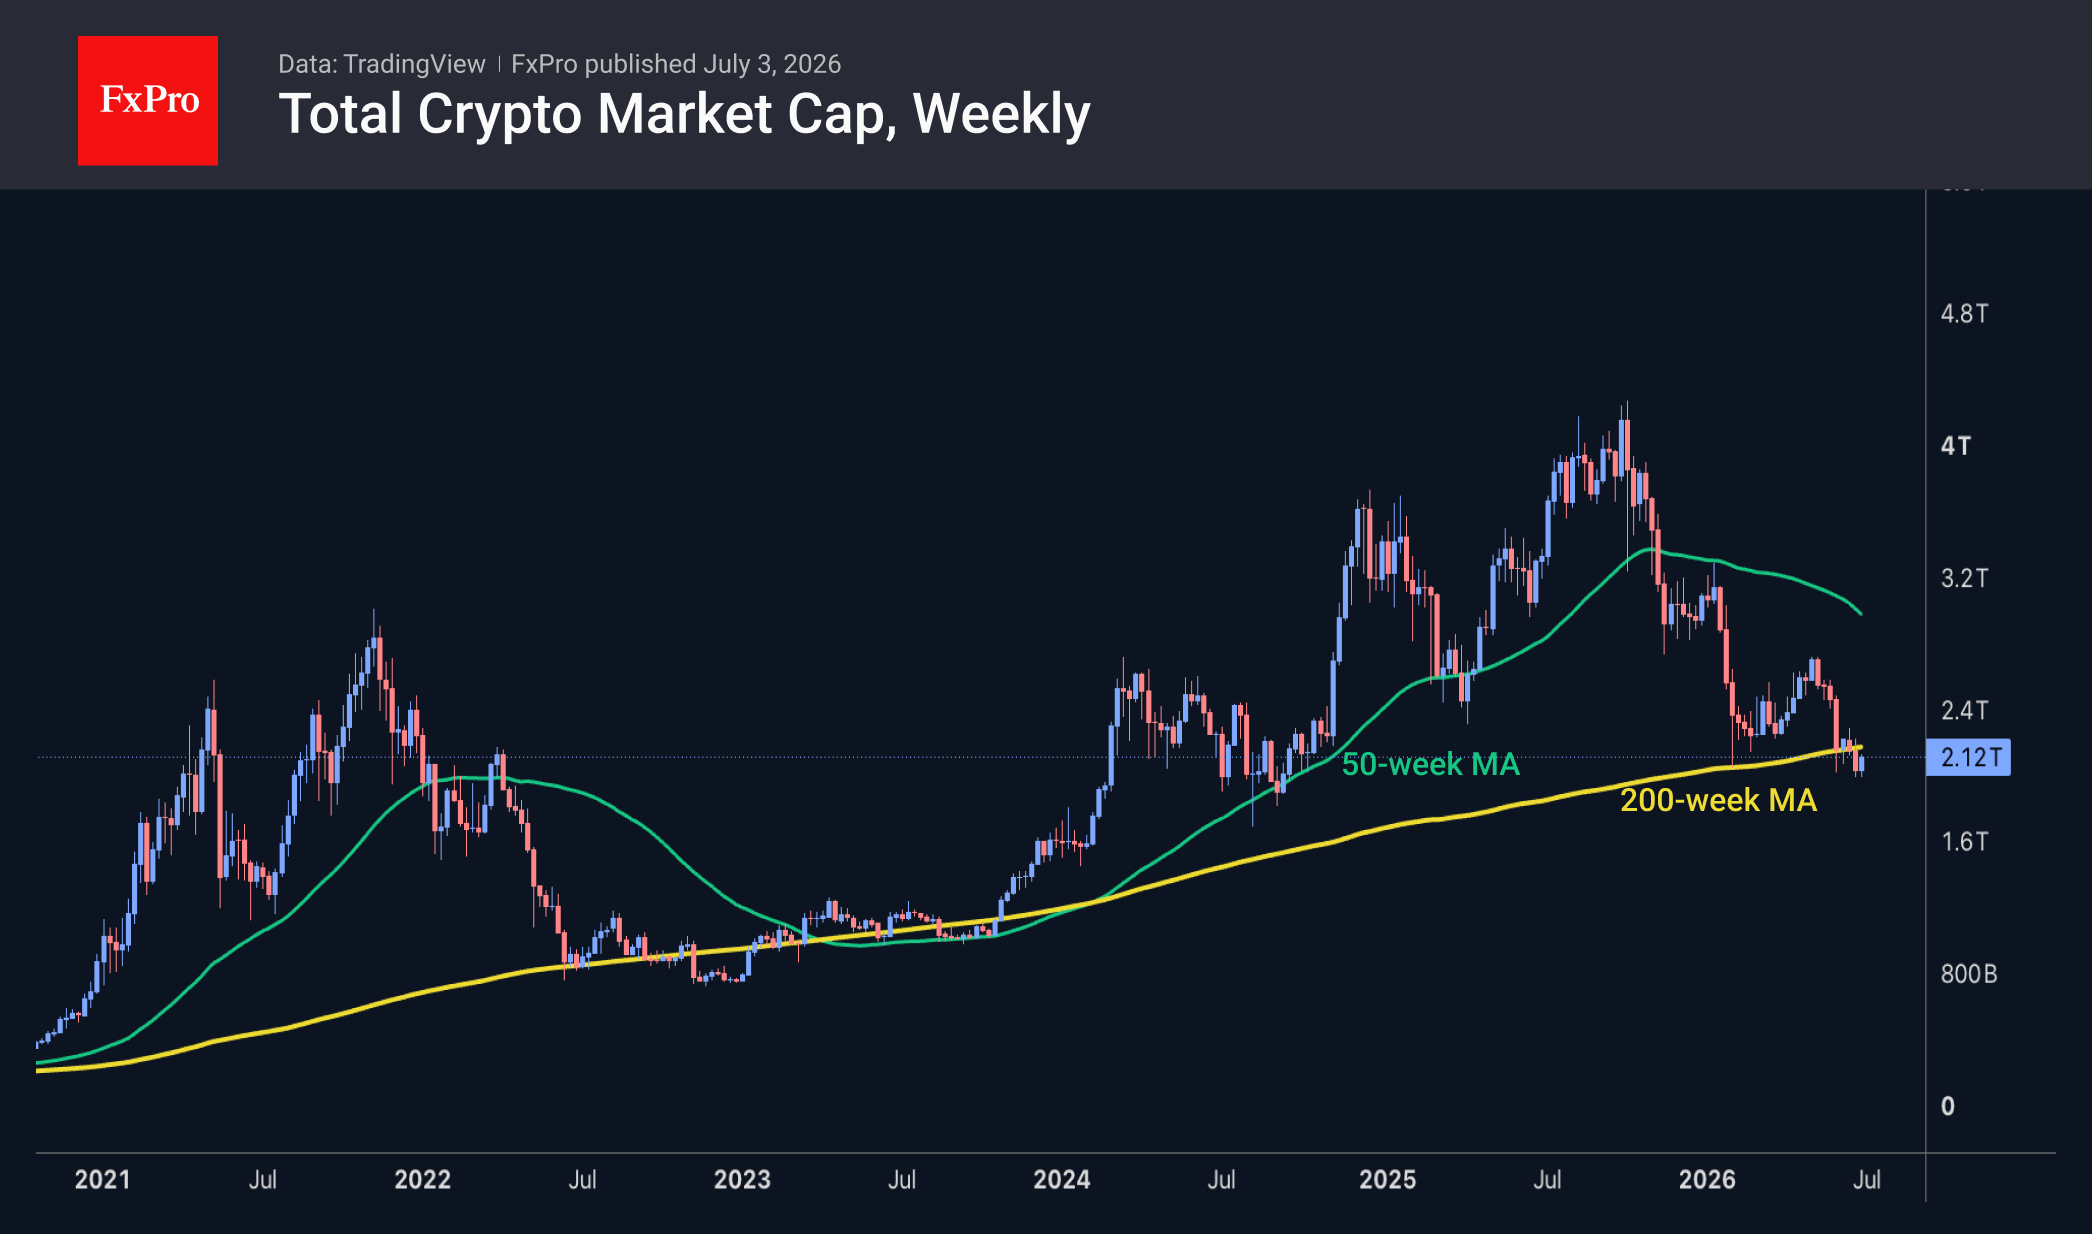
The crypto market is continuing its recovery, which coincided with the start of the calendar month. Market capitalisation has reached $2.14T, up from a low of $2.02T at the start of 1 July. Buying is taking place across the board. Amongst the individual performers over the last 24 hours, the leaders were Uniswap (+13.1%), SushiSwap (+6.8%) and Cardano (+6.5%), while Hedera (-1.9%) and IOTA (-1.7%) lost ground. The crypto market is edging up from below its 200-week moving average. However, we stand by our view that a dip below, or even an approach to, this line reflects a bearish sentiment in the cryptocurrency market, which often lasts for weeks or months. On the other hand, we have not seen any significant historical falls below this curve, so it would be overly pessimistic, in our view, to expect a pullback to $1T, the starting point of the last bull market in 2023.
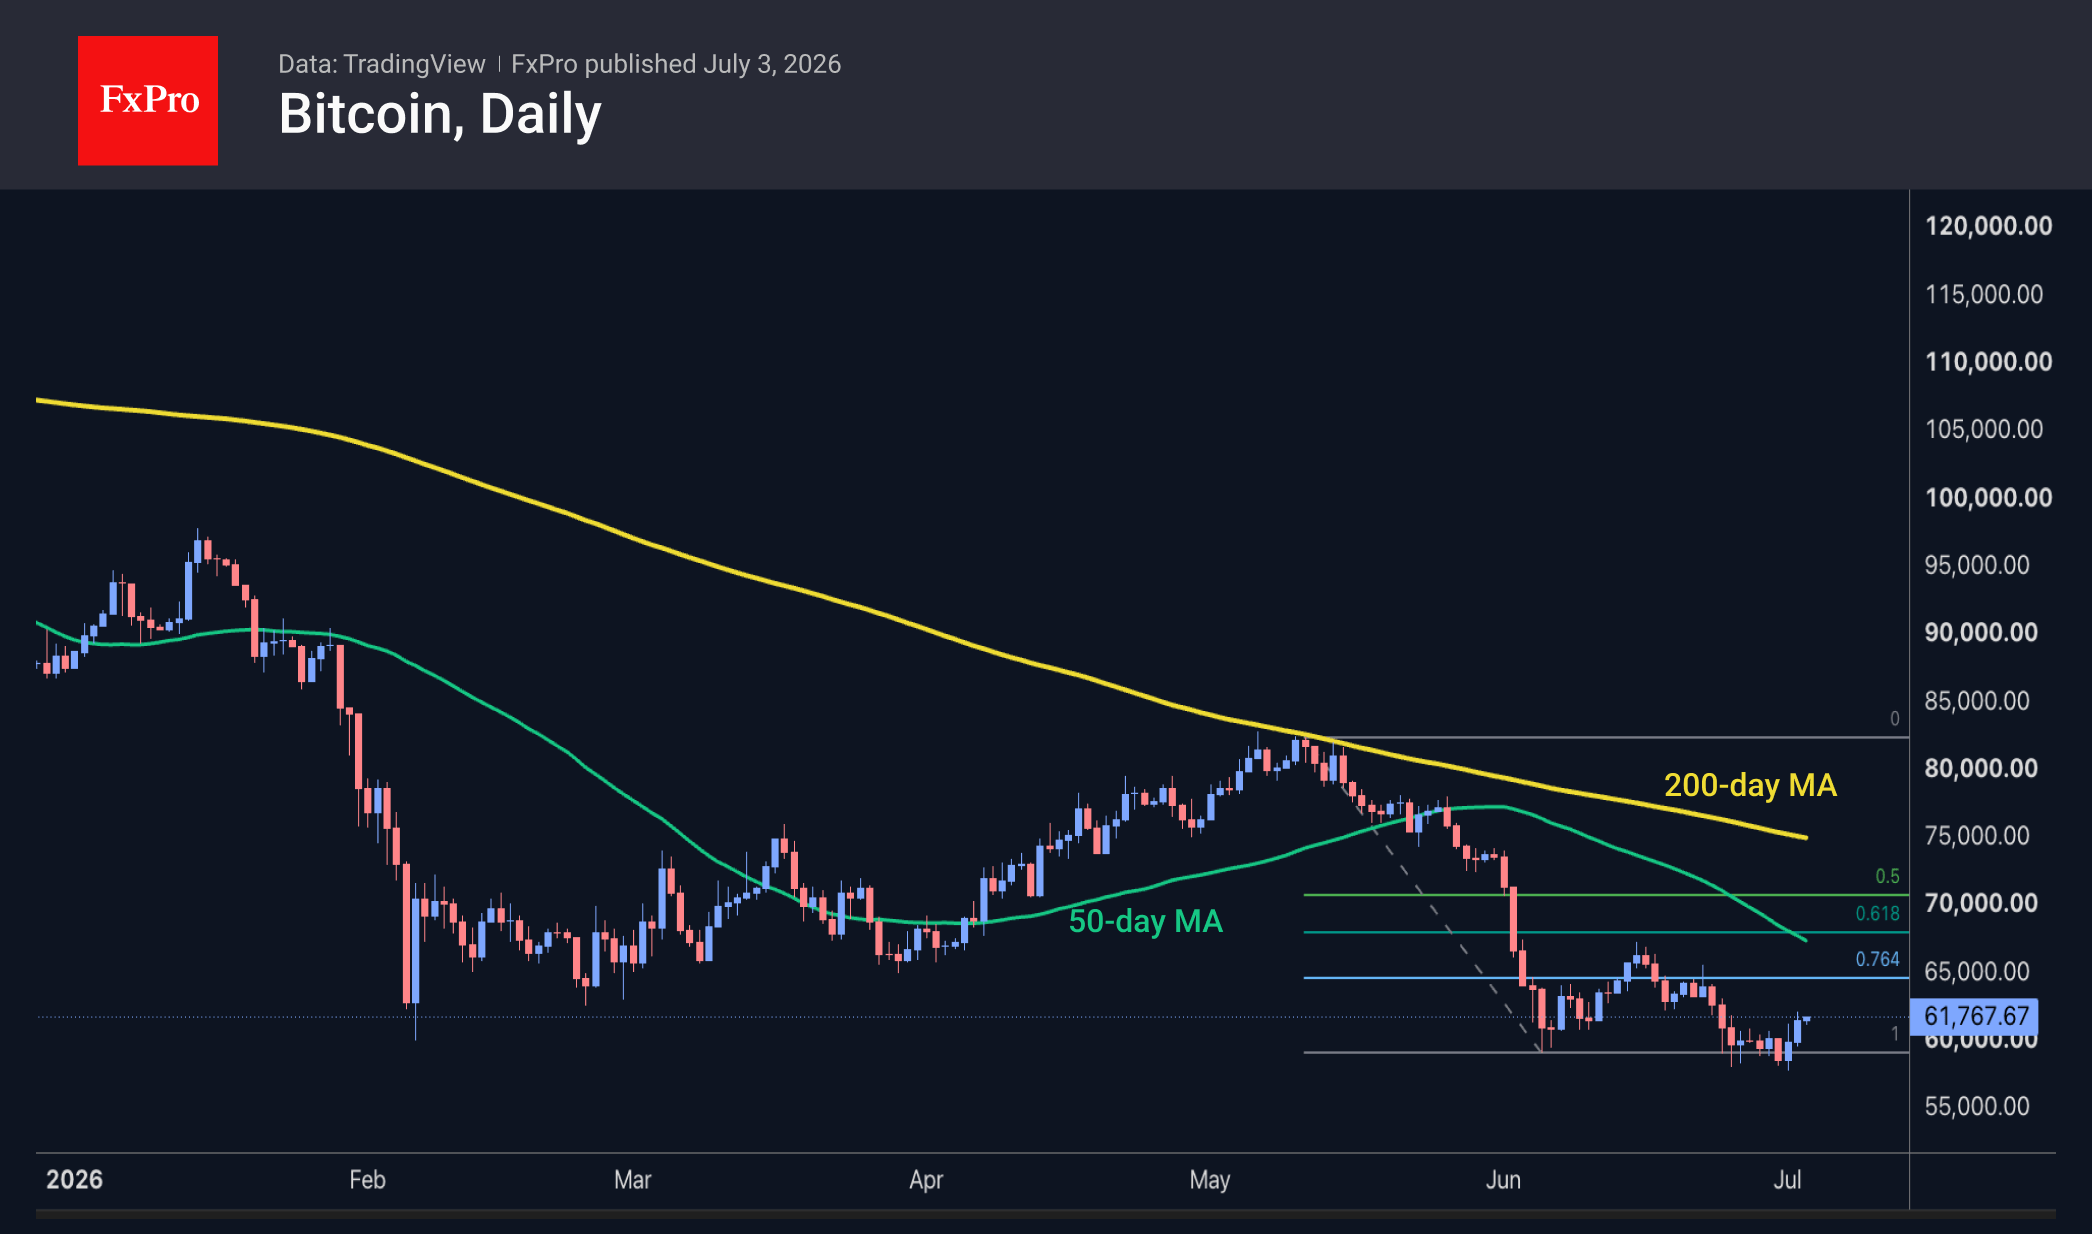
Bitcoin rose above $62K at one point on Thursday but retreated to $61.6K amid low trading activity due to the US weekend. On daily timeframes, the RSI has moved out of oversold territory and formed a bullish divergence with the price, indicating that selling momentum is waning and laying the groundwork for a rebound. However, it would only be reasonable to speak of a fundamental reversal of the downtrend if the price consolidates above the $67–68K range, where the local highs from June, the 50-day moving average and the 61.8% retracement level of the May–June decline are concentrated.
News Background
CryptoQuant points to a growing proportion of investors in the red. Losses are reaching record levels, suggesting that the bottom is near.
The collapse in Strategy shares, although painful, is a necessary part of the market cycle, signalling that Bitcoin is approaching its bottom, said Matt Hougan, Chief Investment Officer at Bitwise. In his view, a new BTC bull market could begin this autumn.
Japanese investment firm Metaplanet purchased a further 2,823 bitcoins in the second quarter, according to its quarterly report. The company’s total holdings have reached 43,000 BTC, making it the third-largest corporate holder of the leading cryptocurrency.
According to Arkham Intelligence, brothers Cameron and Tyler Winklevoss transferred Bitcoin and Ethereum totalling around $67 million to hot wallets on their crypto exchange, Gemini. Previously, such transactions were followed by cryptocurrency sales.
The FxPro Analyst Team
AUD/USD Daily Report
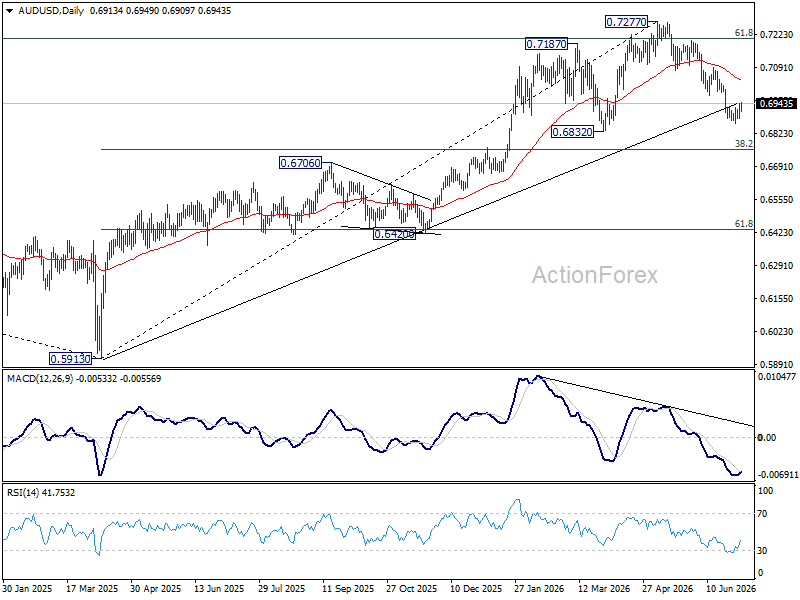
Intraday bias in AUD/USD remains neutral at this point. Further decline is expected as long as 0.6977 support turned resistance holds. Below 0.6864 will extend the fall from 0.7277 to 0.6832 support. Firm break there will target 0.6756 fibonacci level. However, sustained break of 0.6977 will bring stronger rebound to 0.7087 resistance instead.
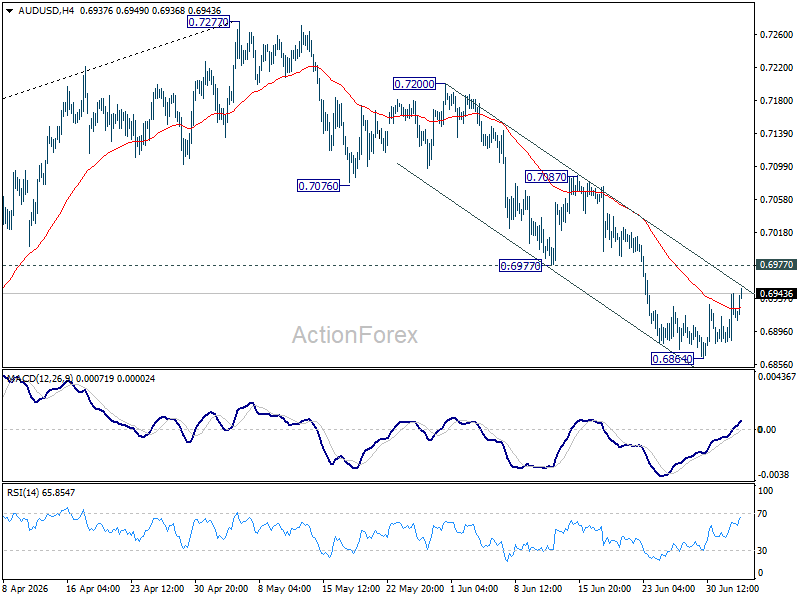
In the bigger picture, considering bearish divergence condition in D MACD, a medium term top could be formed at 0.7277 after failing to sustain above 61.8% retracement of 0.8006 (2021 high) to 0.5913 (2024 low) at 0.7206. Deeper fall could be seen to 38.2% retracement of 0.5913 to 0.7277 at 0.6756 as a correction. But strong support should be seen there to bring rebound. Consolidations would continue below 0.7277 for a while.