Sample Category Title
U.S. Tariffs on Canada Take Effect: What is the State of Play?
The U.S. administration has implemented blanket tariffs on Canada and Mexico after a 30-day reprieve with 25% on all imports except 10% on Canadian energy. An additional 10% tariff on China is also planned.
Canada has been hit with its largest trade shock in nearly 100 years and responded promptly with 25% tariffs on $30 billion of U.S. goods, rising to $155 billion in 21 days. Evolving trade policies and government responses still remain highly uncertain as we highlighted in our first economic takeaways a month ago.
But, as we assess the implications of the implementation of tariffs on our forecasts—to be released in our Financial Markets Monthly next week—here is a cheat sheet summary of what we know and are incorporating into our outlook.
Lack of precedence for economic shock
This is not 2018 and we have a limited experience for this magnitude of a trade shock. In 2018-19, tariff policies raised the average import duty from 1.5% to approximately 3%. As of March 4, the average tariff rate quadruples to nearly 12%. That’s the largest trade shock to the U.S. and Canada since the 1930s.
Interestingly, these tariffs apply to double the share of U.S. imports (Canada + Mexico = 30%) than China-only tariffs (15%). The U.S. economy, in particular, has experienced a sizeable economic shock since 2018—prices are up 29% since Donald Trump’s first day in office eight years ago and we suspect the sensitivity to inflation is much higher now than before.
Impact is highly variable depending on duration
The ultimate impact of these tariffs on Canada and the U.S. will depend on how long they—and retaliatory measures—remain in place. Those are political decisions and difficult to economically forecast. The movement of currencies is key as well, because it can buffer some of the impact on inflation and growth on both sides of the border.
As a specific timeline, we previously delineated a duration of three to six months to show material mark downs in growth for the Canadian and U.S. economies. Tariffs would likely reduce real gross domestic product growth to zero in 2025 if implemented beyond a year and lead to a 2% contraction in 2026 with a peak unemployment rate more than 8%.
Canada’s deeply U.S-integrated manufacturing sector (about 10% of GDP) is particularly vulnerable, along with its heartland in Ontario and Quebec. Alberta and New Brunswick are also among the vulnerable provinces due to their commodity exposure, but the lower tariff rate implies an easier adjustment. Again, these scenarios make many assumptions about the path of currencies, retaliatory measures, central bank responses and fiscal packages. Read more on our scenario analysis here.
The damage is already in play
The threat of tariffs alone has already been enough to create an impact. We have already seen early evidence of stockpiling from U.S. importers ahead of the tariff implementation, a feature in our Playbook for how to measure a tariff shock in Canada. This has worsened the U.S. trade deficit and mechanically pushed down U.S. GDP nowcasts.
Meanwhile, uncertainty measures are at or near all-time highs, which will weigh on business investment and hiring in Canada. Surveys like the ISM Manufacturing indicator showed a surge in expectations for prices combined with a drop in new orders and employment activity in February—a stagflationary sentiment likely to reveal itself in a variety of other indicators into March.
A stagflationary shock for the U.S.
While Canada’s concerns are tilted towards the growth side, we expect the U.S. will struggle with the inflationary impact of broad-based tariffs. With a persistent tariff, we expect the U.S. could see a year-over-year rise in core inflation of 0.5-1 percentage point, pushing it above 3% by the end of 2025. However, growth would also need to be downgraded with our forecast suggesting that U.S. growth would move sideways in 2025 with risks to the downside should tariffs expand to Europe or globally. Growth would likely be materially impacted as well with tariffs in place for at least six months.
That said, we expect a very tight labor market and lack of labor supply will keep a lid on how high the unemployment rate can rise. That will make the U.S. Federal Reserve’s job especially challenging as they maneuver a supply-side shock to inflation that could be unresponsive to interest rate hikes. Currently, we have the Fed on hold for 2025, but further deterioration in sentiment or investment could prompt higher probabilities of additional cuts.
Incoming near-term support
Central bankers and governments may have time. Indeed, they might need time to develop strategies to react. The Bank of Canada has been noncommittal in how it would respond to a tariff shock—waiting to see whether inflation or growth dominate. Without tariffs, we expected the BoC to gradually cut rates to 2.25%. Now, we expect that the longer tariffs remain in play, the greater the likelihood that rates fall faster and by a larger magnitude.
Provincial and federal stimulus packages will also matter. A prolonged trade shock means governments would have to respond to both the immediate recession, while also strengthening the underlying economy that is ill positioned to absorb such a shock. Targeted support would help to offset the growth impact, while broad-based cash transfers risk inflation that would complicate the BoC’s job and limit future fiscal firepower. Prorogued legislatures at the federal level and in Ontario conveniently give policymakers more time to plan their reaction, while automatic stabilizers like employment insurance or Crown financial programs likely provide latitude to address many immediate concerns.
An eye on medium- and longer-term solutions
There are longer-term plays available to facilitate export diversification and stronger domestic growth drivers despite the hurdles facing the Canadian economy. One is the U.S.’s recognition of the importance of Canadian commodities. Lower tariff rates on Canadian energy and critical minerals reveal how big a global player Canada is on oil, gas, potash, agrifood, uranium and other essentials without easy substitutes. Expanding a cross-border partnership in these areas could refocus the relationship, while underpinning a greater value capture in manufacturing and ancillary services, and greater trade diversification.
There is increasing consensus in Canada on the urgency of addressing structural growth impediments from interprovincial trade barriers to peer-lagging business investment and high regulatory burdens. There are no easy fixes for U.S. tariffs. These issues could only be addressed over time, but would unequivocally be positive for the Canadian economy.
Trade turbulence is likely to be a persistent theme
While our current focus is on 25% across the board tariffs on Canadian and Mexican goods, there are other trade-related deadlines coming. In addition to the planned March 12 implementation of previously announced steel and aluminum tariffs, April 2 is the next trigger date. The U.S. administration is expecting trade analysis from several agencies to support reciprocal tariffs, while its already put out a notice for stakeholder views on USMCA/CUSMA in advance of July 2026 renegotiations. Ongoing trade disruption means both economies can expect to be beset by policy uncertainty that weighs on business investment.
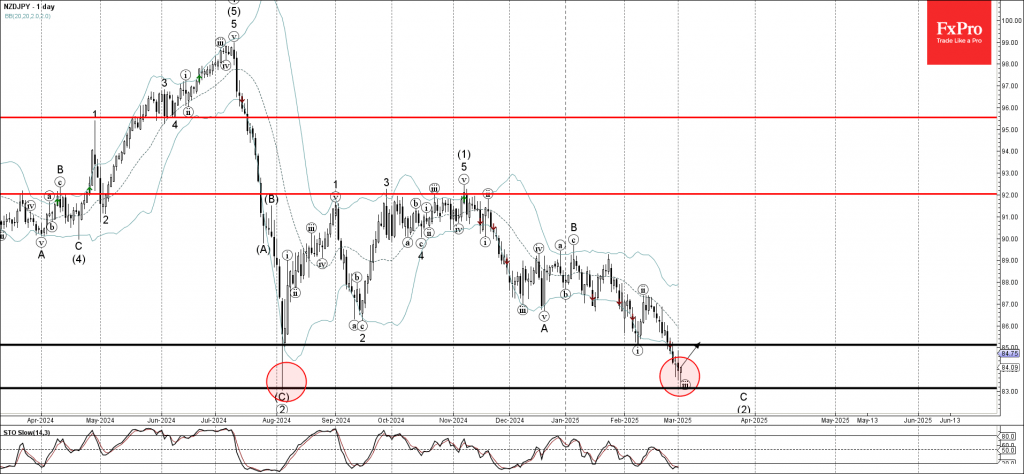
NZDJPY Wave Analysis
- NZDJPY reversed from long-term support level 83.15
- Likely to rise to resistance level 85.00
NZDJPY currency pair today reversed up exactly from the long-term support level 83.15 (which stopped the sharp downtrend at the start of August of 2024 as can be seen below), standing near the lower daily Bollinger Band.
The upward reversal from this support zone will form the daily Japanese candlesticks reversal pattern Hammer – if the pair closes today near the current levels.
Given the proximity of the strong support level 83.15 and the oversold daily Stochastic, NZDJPY currency pair can be expected to rise to the next resistance level 85.00, former support from the start of February.
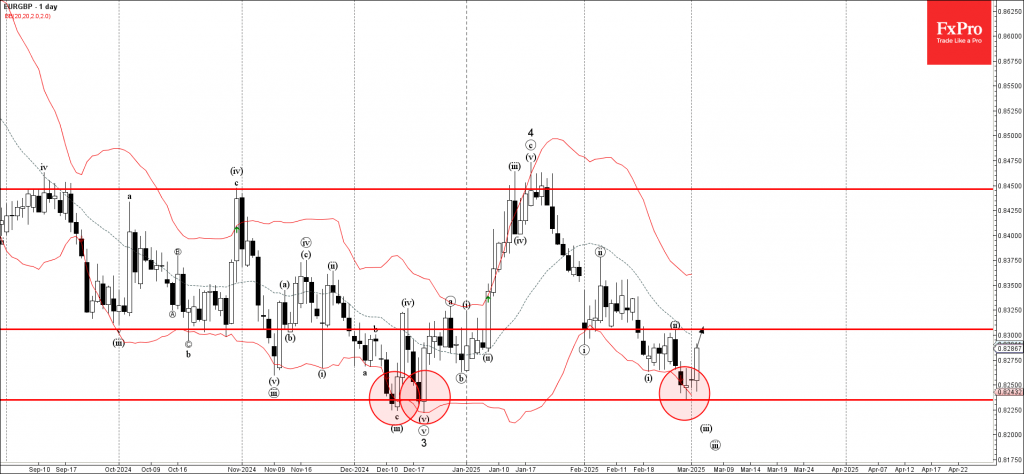
EURGBP Wave Analysis
- EURGBP reversed from support area
- Likely to rise to resistance level 0.8300
EURGBP currency pair recently reversed from the support area set between the multi-month support level 0.8235 (which created the Double Bottom in December) and the lower daily Bollinger Band.
The upward reversal from this support zone created the daily Japanese candlesticks reversal pattern Doji which signalled the strength of this support area.
Given the strength of the support level 0.8235 and the strongly bullish euro sentiment seen today, EURGBP can be expected to rise to the next resistance level 0.8300 (top of the previous correction ii).
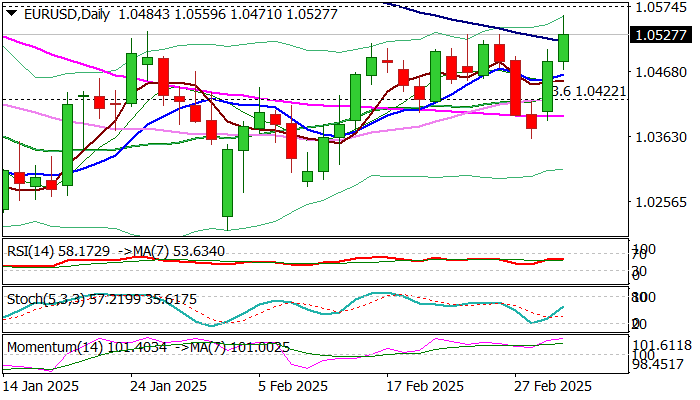
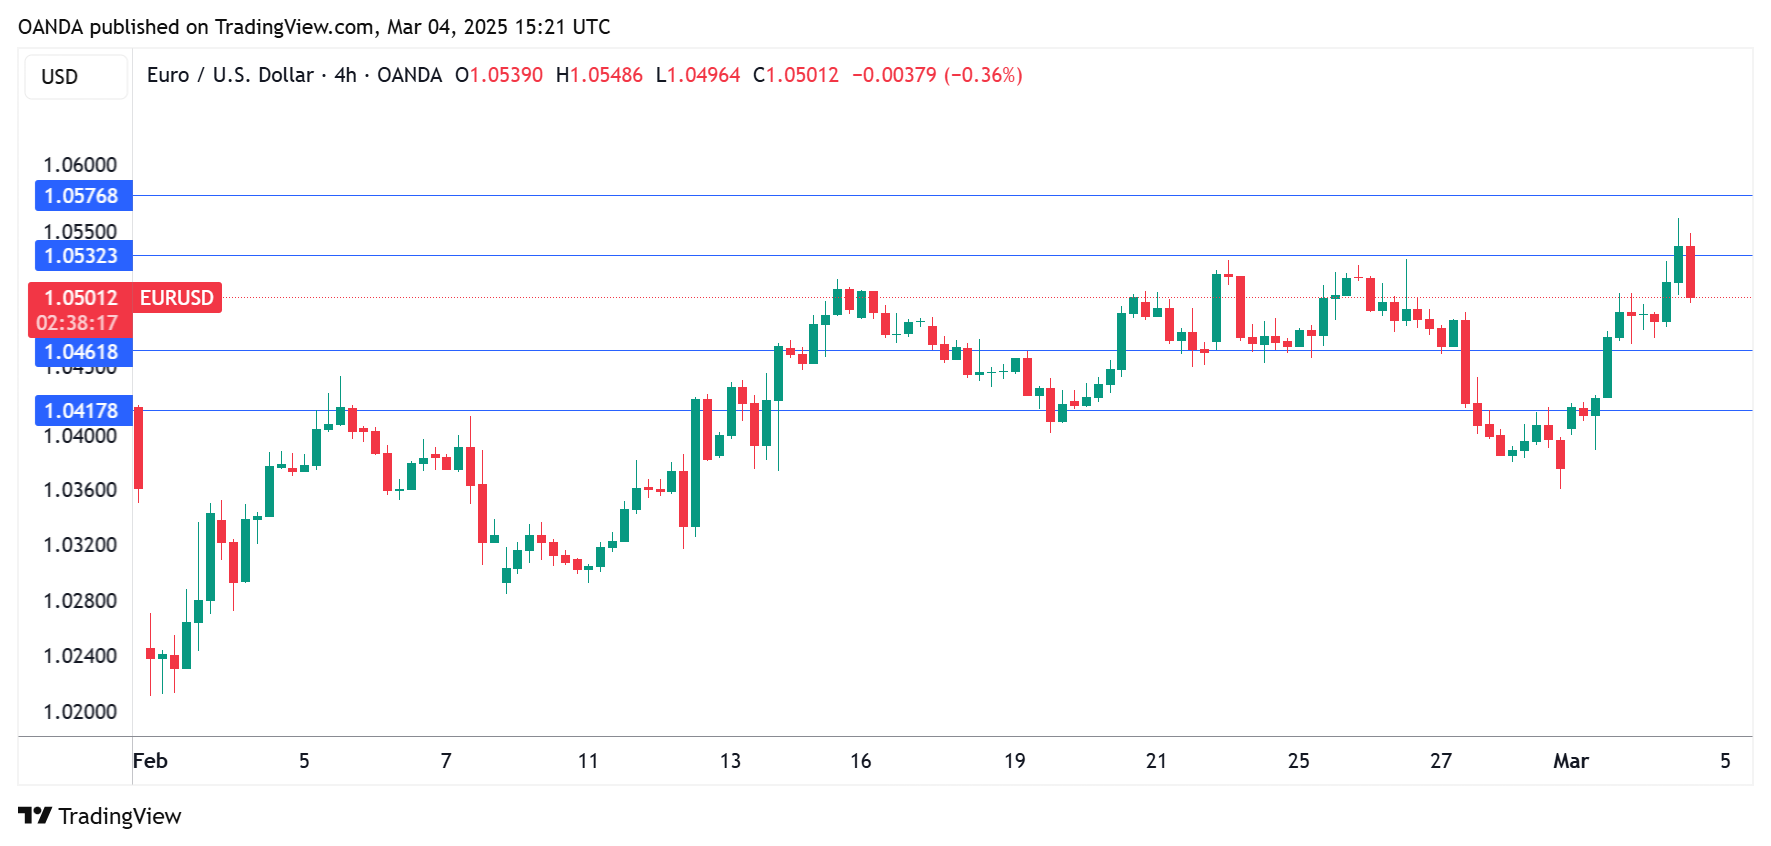
EURUSD Rises to New 2025 High as Dovish Fed Deflates Dollar
Fresh bullish acceleration extends into second consecutive day and pushed EURUSD to new 2025 high (1.0559) on Tuesday.
Weaker dollar on dovish shift in monetary policy outlook, as US Treasury Secretary signaled stronger policy easing, after a series of weak US economic data, with markets pricing in three 25 bp cuts this year, was the main driver of the single currency
Little help for dollar was seen on anticipated safe haven demand after the USA imposed new tariffs.
On the other hand, the Euro received boost from signals that the bloc is working on increase of spending on defense, which may provide some support to economic growth.
Bulls cracked pivotal barriers at 1.0533/29 (recent range tops) and pressure another key resistance at 1.0573 (Fibo 38.2% of 1.1214/1.0177 downtrend) but need a clear break above this zone to signal an end of sideways phase and bullish continuation.
Technical picture on daily chart is overall positive, as bullish momentum is strengthening and rising Tenkan and Kijun-sen are diverging after formation of bull-cross.
However, closing above cracked 100DMA (1.0517) is minimum requirement to keep fresh bulls in play and focus shifted to the upside.
Markets focus on important economic releases in coming days – EU February Services PMI, ECB interest rate decision (25bp cut is expected) and US NFP.
Res: 1.0559; 1.0573; 1.0630; 1.0695
Sup: 1.0471; 1.0426; 1.0395; 1.0360
Euro Hits Three-Month High, Eurozone Unemployment Rate Unchanged
The euro has extended its gains on Tuesday. EUR/USD is trading at 1.0523 in the North American session, up 0.36% on the day. Earlier, the euro rose as high as 1.0559, its highest level since December 10.
Eurozone unemployment remains at 6.2%
The eurozone economy is sputtering but there’s nothing wrong with the employment picture. The unemployment rate remained at 6.2% for a third straight month in January, a record low. The December reading was revised downwards from 6.3%. Germany, the largest economy in the bloc, is yet to recover but unemployment is just 3.5%, the lowest in the eurozone. As well, the employment rate rose to 71.7%, its highest level in 20 years.
For the European Central Bank, inflation remains the key driver of rate decisions. In February, headline inflation dipped to 2.4% and the core rate eased to 2.6%, but both readings were higher than expected. Services inflation has been sticky and fell to 3.7% from 3.9%. Inflation remains above the ECB’s target of 2% and the February numbers could complicate the ECB’s plans to continue lowering rates. The euro responded to this sentiment which huge gains of 1% on Monday.
The ECB meets next on March 6 is widely expected to lower rates by a quarter-point, which would bring the cash rate to 2.50%. What happens after March isn’t clear and which direction inflation takes will be a crucial factor in the ECB’s rate path. Another headache for the ECB is US tariffs. The Trump administration is yet to impose tariffs on EU products but has threatened to hit the bloc with 25% on European cars and other goods. EU officials have promised to retaliate with counter-tariffs and the specter of a full-blown trade war between the US and EU will damage both economies.
EUR/USD Technical
- EUR/USD tested resistance at 1.0483 earlier. Above, there is resistance at 1.0576
- 1.0461 and 1.0417 are the next support lines
Sunset Market Commentary
Markets
There’s little left from yesterday’s (European) stock market optimism. US President Trump personally pulled the EuroStoxx50 off an all-time high by pausing all US military aid to Ukraine until he is convinced about Ukrainian president Zelensky’s intentions toward peace negotiations with Russia. The White House didn’t specify any conditions for the US to resume its military aid. The EU was already on a fast-track towards increased defense spending after Friday’s collapsed talks between Trump and Zelensky with EC von der Leyen speeding up to timeline further today ahead of Thursday’s EU Council dedicated to defense and Ukraine. She today proposed a Rearm Europe Plan. In a letter to EU leaders, she outlines five potential measures to massively boost defense spending, both to respond to the short-term urgency to act and to support Ukraine, but also to address the long-term need to take on more responsibility for our own European security. They include a new €150bn loan instrument to finance joint defense investments and €650bn from individual member states increasing defense spending by 1.5% of GDP on average and for which fiscal discipline rules will be once again lifted. Von der Leyen’s press conference unfortunately failed to lift market spirits. Party pooper Trump’s second folly came from pushing through with 25% tariffs against Canada and Mexico and raising the level for China from 10% to 20%. China and Canada immediately retaliated with Mexico joining on Sunday. The escalation extends market worries that the Tariff Man will in the short term raise inflationary pressures and in the mid-to-long run pull the US economy into recession. Prepare for more fireworks tonight as he addresses a joint session of US Congress for a first time in his second term. Today’s empty eco calendar and lack of central bank talk left markets vulnerable to this explosive geopolitical situation. Key European indices lost 2.5% on average. The front end of European bond curves outperforms as investors pour back into ECB April rate cut bets. Front end yields lose around 5 bps. The (very) long end trades flat given the avalanche of fiscal stimulus ahead of us. The dollar remains vulnerable to the US recession narrative with EUR/USD taking out the previous YTD top at 1.0533 and testing 38% retracement (1.0551) on the September to February decline in EUR/USD. US Treasury yields cede up to 6 bps at the front end with US money markets again fully discounting three additional 25 bps Fed rate cuts this year. Oil prices extend their drop after yesterday’s surprise OPEC+ production cut reversal announcement with Brent crude testing $70/b support.
The Kingdom of Belgium launched a now long 15y OLO via syndication (Jun2042). Order books ended above €37bn, allowing the debt agency to print €5bn at 8 bps over the Belgian OLO curve compared with guidance in the OLO + 10 bps area. They now raised €16.39bn YtD compared with a €42bn OLO funding need to cover the lion share of the €44.65bn gross borrowing requirement. One final syndicated deal (5y) is expected later this year.
News & Views
The Hungarian central bank’s new leadership sees no room to cut policy rates from the current 6.5%, Bloomberg reported today citing sources. Mihaly Varga, the former finance minister to prime minister Orban, took over from Gyorgy Matolcsy starting today. Varga himself in his first comments to Bloomberg said “The central bank supports sustainable economic growth by keeping inflation sustainably low and by guarding financial-market stability”. According to the people tapped by the news agency this translates into an even longer rates status quo, adding that he is committed to tackle inflation and doesn’t plan to conduct monetary policy in such a way that it would weaken the forint. Hungarian inflation rose to a 13-month high of 5.5% in January, well above the central bank’s 3% target. The Hungarian forint briefly strengthened to the highest level against the euro since early October. EUR/HUF remains near the 400 support barrier though. Hungarian swap rates swapped earlier losses for 3 bps gains.
The Japanese yen trades strong today. USD/JPY broke below 150 yesterday and extends losses to the lowest level since October of last year. Aside from the current risk-off, it was US President Trump who sparked the recent two-day JPY appreciation with his first comments since taking office on Japan. He accused the country of having an unfair advantage through its FX policy. Trump said something similar about the Chinese yuan. Believing the Chinese authorities will either partially or fully comply to Trump’s demands (of a stronger FX) or face tariffs otherwise, it helps explain today’s CNY strengthening even as the US just slapped the country with a 20% levy.
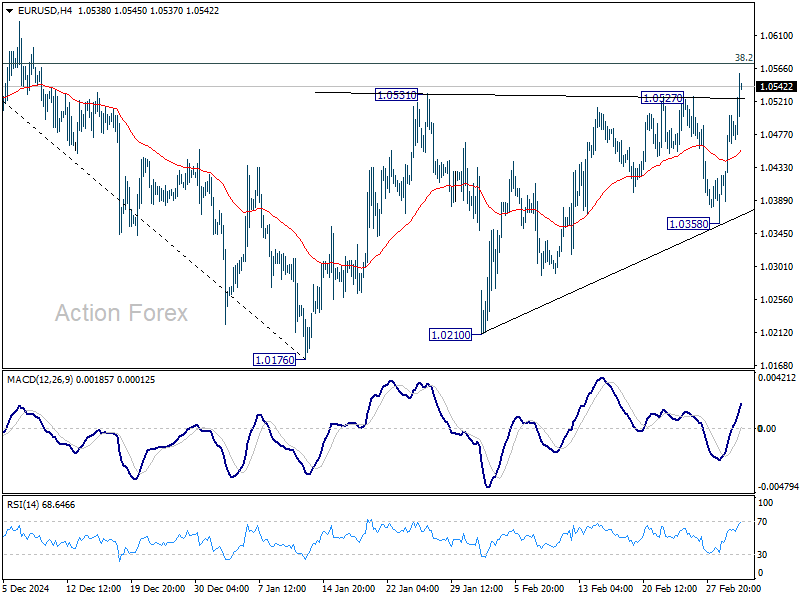
EUR/USD Mid-Day Outlook
Daily Pivots: (S1) 1.0417; (P) 1.0461; (R1) 1.0532; More...
Intraday bias in EUR/USD is back on the upside with break of 1.0527 resistance. Immediate focus is now on 38.2% retracement of 1.1213 to 1.0176 at 1.0572. Sustained break there will raise the chance of near term bullish reversal, and target 61.8% retracement at 1.0817. On the downside, break of 1.0358 support will turn bias back to the downside for retesting 1.0176 low.
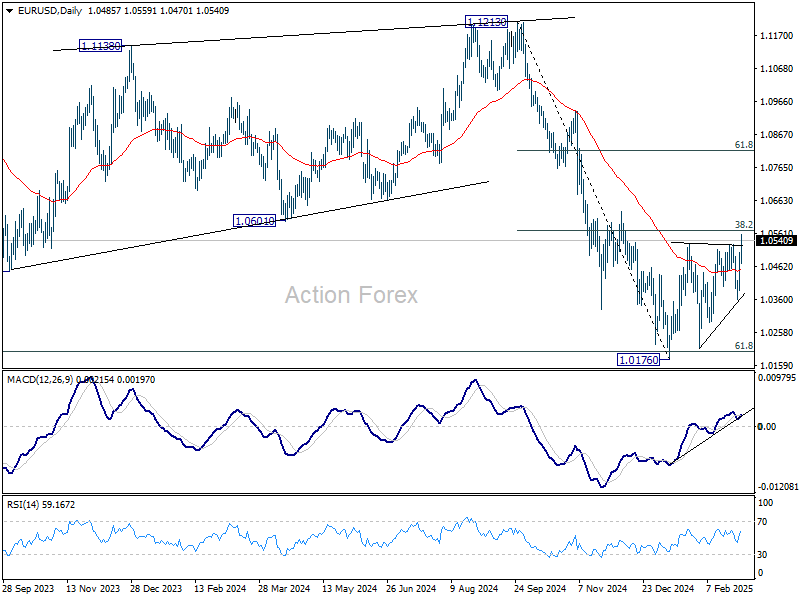
In the bigger picture, immediate focus is on 61.8 retracement of 0.9534 (2022 low) to 1.1274 (2024 high) at 1.0199. Sustained break there will solidify the case of medium term bearish trend reversal, and pave the way back to 0.9534. However, reversal from 1.0199 will argue that price actions from 1.1274 are merely a corrective pattern, and has already completed.
GBP/USD Mid-Day Outlook
Daily Pivots: (S1) 1.2614; (P) 1.2669; (R1) 1.2757; More...
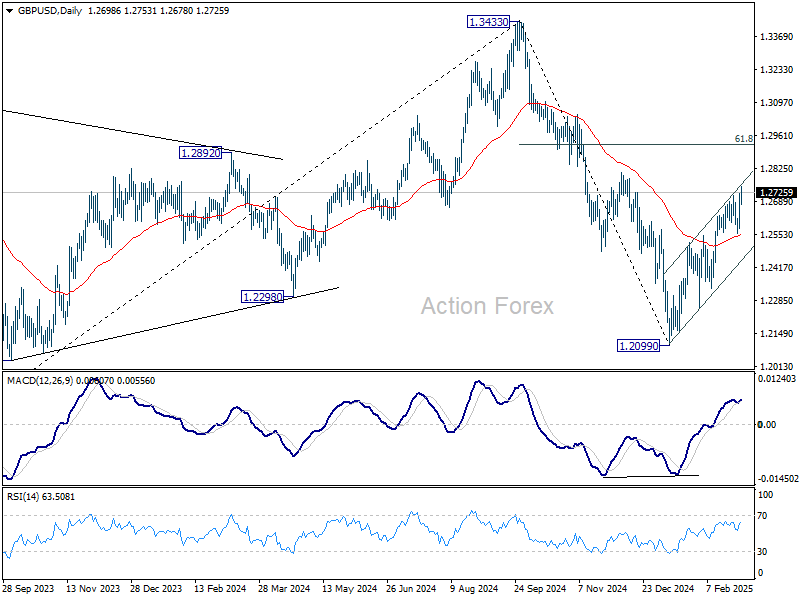
Intraday bias in GBP/USD remains on the upside as rise from 1.2099 is in progress for 1.2810 resistance. Firm break there will target 61.8% retracement of 1.3433 to 1.2099 at 1.2923. On the downside, break of 1.2558 will turn bias back to the downside for near term rising channel support (now at 1.2453).
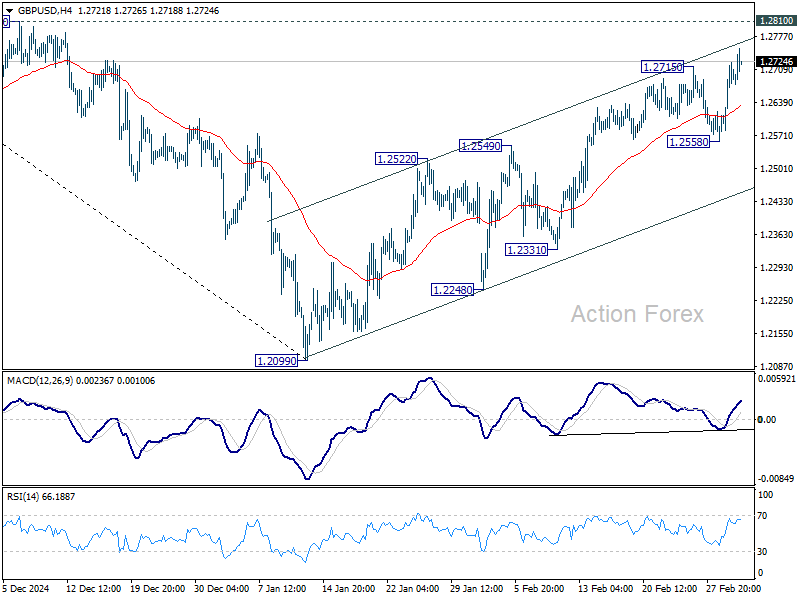
In the bigger picture, rise from 1.0351 (2022 low) should have already completed at 1.3433 (2024 high), and the trend has reversed. Further fall is now expected as long as 1.2810 resistance holds. Deeper decline should be seen to 61.8% retracement of 1.0351 to 1.3433 at 1.1528, even as a corrective move. However, firm break of 1.2810 will dampen this bearish view and bring retest of 1.3433 high instead.
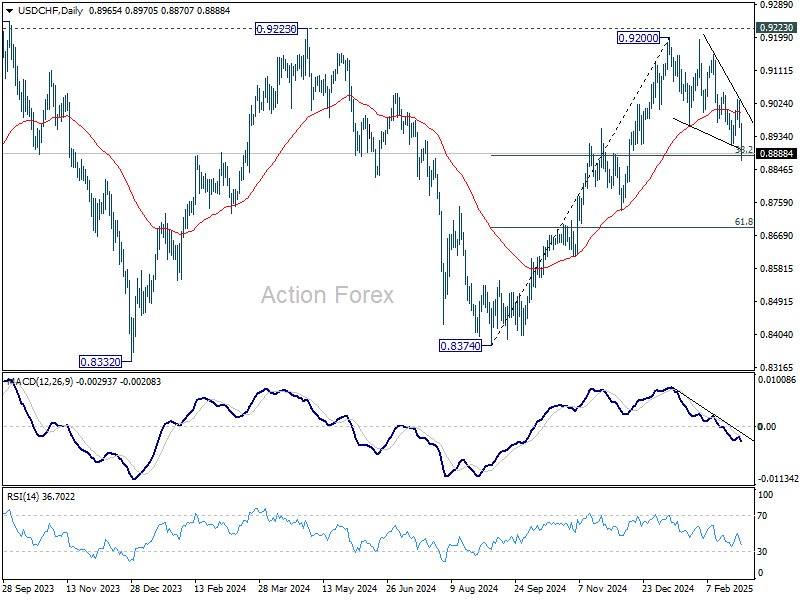
USD/CHF Mid-Day Outlook
Daily Pivots: (S1) 0.8941; (P) 0.8987; (R1) 0.9013; More…
Intraday bias in USD/CHF is back on the downside as fall resumes through 0.8911 support. Immediate focus is now on 38.2% retracement of 0.8374 to 0.9200 at 0.8884 Strong rebound from current level, followed by break of 0.9035 resistance, will retain near term bullishness, and bring retest of 0.9200/23 resistance zone. However, firm break of 0.8444 will confirm rejection by 0.9223 resistance and turn near term outlook bearish.
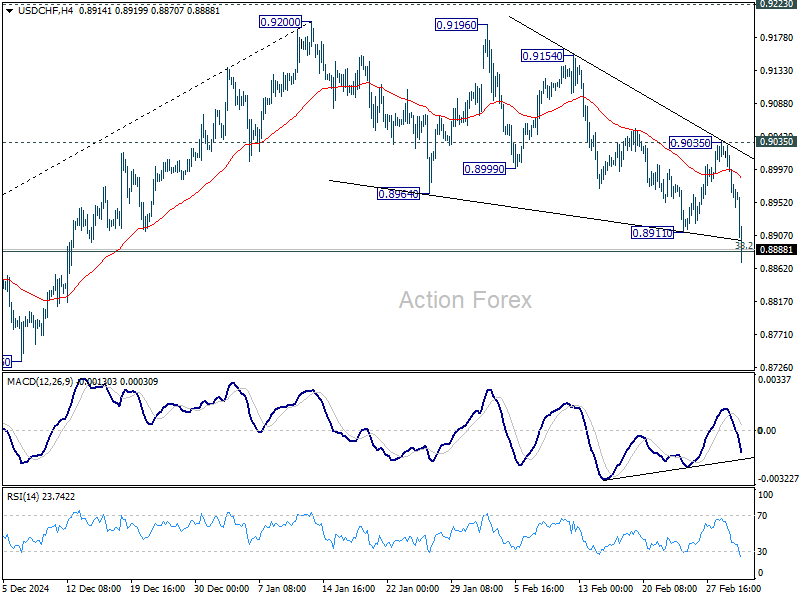
In the bigger picture, decisive break of 0.9223 resistance will argue that whole down trend from 1.0342 (2017 high) has completed with three waves down to 0.8332 (2023 low). Outlook will be turned bullish for 1.0146 resistance next. Nevertheless, rejection by 0.9223 will retain medium term bearishness for another decline through 0.8332 at a later stage.