Sample Category Title
Trade Idea: USD/CAD – Sell at 1.3320
USD/CAD - 1.3251
Recent wave: Only wave v of c has ended at 0.9407 and wave C of major A-B-C correction is underway for headway to 1.4700
Trend: Near term up
New strategy :
Sell at 1.3320, Target: 1.3120, Stop: 1.3380
Position: -
Target: -
Stop:-
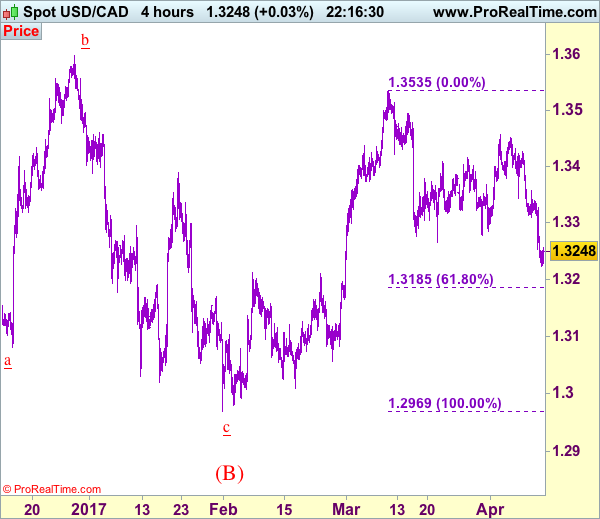
As the greenback finally broke below indicated previous support at 1.3264, adding credence to our view that the erratic decline from 1.3535 top is still in progress, hence consolidation with downside bias is seen for further weakness to 1.3180-85 (61.8% Fibonacci retracement of 1.2969-1.3535), then towards 1.3120-25, however, near term oversold condition should prevent sharp fall below 1.3080-85 and price should stay above previous support at 1.3056 and bring rebound later.
In view of this, would not chase this fall here and would be prudent to sell on recovery as 1.3290-00 should limit upside and resistance at 1.3327 should hold, bring another decline. Above resistance at 1.3357 would abort and suggest low is formed instead, bring a stronger rebound d to 1.3390-00 but only break of 1.3425-30 would shift risk back to upside and bring retest of 1.3456 resistance first.
To recap, wave B from 1.3066 is unfolding as an a-b-c and is sub-divided as a: 1.2192, b: 1.2716 and wave c is a 5-waver with i: 1.1983, ii: 1.2506, extended wave iii with minor iii at 1.0206, wave iv ended at 1.0781 and wave v as well as wave iii has ended at 0.9931, hence the subsequent choppy trading is the wave iv which is unfolding as (a)-(b)-(c) with (a) leg of iv ended at 1.0854, followed by (b) leg at 1.0108 and (c) leg as well as the wave iv ended at 1.0674. The wave v is sub-divided by minor wave (i): 0.9980, (ii): 1.0374, (iii): 0.9446, (iv): 0.9913 and (v) as well as v has possibly ended at 0.9407, therefore, consolidation with upside bias is seen for major correction, indicated target at 1.3700 and 1.4000 had been met and further gain to 1.4700 would be seen later.
PPI Edges Down in March and It Wasn’t Just Oil
Producer price inflation ticked down 0.1 percent in March, snapping six months of gains. Ex-food, energy and trade services, the PPI also slipped 0.1 percent and signals little change in the underlying trend in inflation.
Energy Recovery Pauses, Food Prices Rising
Reflationary pressures continue to look fairly modest, with the PPI for final demand edging back 0.1 percent in March.
As expected, energy was a drag on the headline, down 2.9 percent. Overall prices for goods, however, fell only 0.1 percent on rising prices for food and core goods. Food prices are now up on a year-ago basis for the first time in more than two years, while core goods prices are up 2.3 percent over the past year.
Input Prices for Goods Continue to Rise
After strong gains the first two months of the year, prices for services ticked down 0.1 percent. Increasing only 1.5 percent over the past year, services inflation remains little changed on trend.
Outside of energy, input prices for goods continue to rise. Food & feed and core intermediate goods prices, both for processed and unprocessed, rose over the month.
Canada: Manufacturers See a Mixed Month
Canadian manufacturing sales fell modestly in February, down 0.2% month-on-month in February, ahead of market expectations for a 0.7% decline. In volume terms it was a better story, with sales up 0.1%.
Sales were down in 10 of 21 major industries, with the most significant declines seen in the petroleum and coal product and wood product industries (-5.0% and -3.3% respectively). Declines in motor vehicle (- 5.3%) and parts (-3.3%) manufacturing were offset by gains in the typically noisy aerospace and railroad sectors, leaving broad transportation equipment sales effectively flat on the month. On the plus side of the ledger, the machinery, fabricated and primary metal products and mineral products all reported solid gains, up 2.9% as a group.
Looking across the country, the sales declines were fairly widespread. Sales in the Atlantic provinces were down 3.1%, while B.C. (-1.7%), Manitoba (-1.4%), and Ontario (-1.1%) also saw declines. The bright spots were Quebec (+2.1%) and Alberta (+1.4%).
Inventories were, up 1.6% to $71.9 billion in February, tipping the inventory-to-sales ratio up to 1.34 (January: 1.32). Forward-looking indicators remained solid - with unfilled orders (+0.7%) and new orders (+0.8%) both up, for a second and third straight month respectively.
Key Implications
Today's sales report may not be a barn-burner, but neither is it cause for concern. Sales volumes managed to eke out a fourth consecutive monthly gain, and firms continue to see decent strength in their order books. If anything, it is promising to see sales volumes holding at current levels given the strong gains seen at the end of last year.
Indeed, the sales figures do little to alter the near-term growth outlook one way or the other. We continue to track solid first quarter GDP growth of around 3.4% quarter-on-quarter, annualized.
Looking further ahead, gains in order books are encouraging, but there remains a cloud on the horizon in the form of potential trade barriers south of the border. Whether and how these risks materialize will have an impact on the Canadian economy more broadly; as reinforced yesterday, the Bank of Canada is taking a cautious approach to the outlook, and the persistence (or lack thereof) of economic growth and price pressures will be key to moving their policy interest rate sooner rather than later.
Canadian Manufacturing Sales Inched Lower in February but Still Elevated
Highlights:
- Nominal manufacturing sales dipped 0.2% in February, above market expectations for a 0.7% decline. The dip followed a downwardly revised 0.1% gain in January but outsized 2.4% (previously 2.1%) and 2.2% increases in December and November, respectively.
- Weakness was concentrated in a 5.3% drop in motor vehicle sales and price-led 5.0% drop in petroleum & coal sales (petroleum & coal volume sales declined a more modest 2.0%). An outsized 27% jump in the volatile aerospace component provided the main offset although machinery shipments also rose an encouraging 3.1%.
- Sale volumes inched up 0.1%
- Inventories increased 1.6% after a 1.1% increase in February. The inventory-to-sales ratio increased but from very depressed levels in January and February.
Our Take:
The modest dip in manufacturing sales in February was somewhat smaller-than-expected, particularly given the series of strong reports in the often-volatile series leading up to February (sales increased an average 1.6% per month October to January) that pointed to risk of a near-term correction and an earlier-reported drop in exports in the month. The February result would have been weaker if not for a 27% jump in the volatile aerospace component (sales declined 1.0% excluding aerospace); however, nominal sales were also restrained by lower prices, particularly for petroleum & coal products. Looking through monthly volatility, strong earlier readings and a 0.1% tick higher in February left sales in volume terms up 10% (at an annualized rate) in Q1 to-date. February sales volumes were up 4.1% from a year ago, marking the fastest annual gain since December 2014. Survey based measures (eg. the Markit Canada Manufacturing PMI and CFIB's Business Barometer) of manufacturing activity have also generally improved in 2017 to-date to provide further evidence that the sector is on a somewhat firmer footing. The same can broadly be said for the overall economy. While today's report is in line with our view that GDP was little-changed in February, that would follow three months of outsized gains (averaging 0.5% over the last three months) and leave growth in Q1 as a whole tracking in line with our forecast for a 3.8% increase.
Japanese Yen Steady, US Producer Inflation Data Disappoints
USD/JPY is showing little movement in the Thursday session, as the pair trades just above the 109 line in the North American session. In economic news, there are no major Japanese events on the schedule. In the US, key numbers were mixed. PPI came in at -0.1%, missing the estimate of 0.0%. There was better news from unemployment claims, which remained unchanged at 234 thousand, beating the estimate of 242 thousand. Later in the day, the US releases UoM Consumer Sentiment, which is expected to drop to 97.1 points. On Friday, the US releases consumer spending and inflation numbers.
The yen improved to 5-month highs this week, as jittery investors have moved away from the US dollar in favor of the safe-haven Japanese yen. Escalating geopolitical concerns, particularly over Syria and North Korea, are weighing on the US dollar. The US bombed a Syrian military base last week, in response to a chemical attack by Syrian warplanes. Russia has strongly condemned the US move, chilling relations even further between the US and Russia. President Trump has declared that he has sent "an armada" to the Korean peninsula in response to North Korea firing ballistic missiles, and the escalation in rhetoric between North Korea has unnerved the markets. Also, Donald Trump said in a newspaper interview that the value of the US dollar was too strong and that he was in favor of a low interest rate policy. Trump's comment has further weighed on the greenback and boosted the yen.
Earlier this week, Federal Reserve Chair Janet Yellen said that with the economy close to full employment and 2 percent inflation, the Fed was in a better position to reduce its support for the US economy. The minutes of the March meeting indicated that the Fed plans to trim the $4.5 trillion balance sheet, which has ballooned as a result of the huge asset-purchase program which started in response to the financial crisis in 2008. Yellen emphasized that the Fed's policy stance is neutral, as interest rate increases will be gradual, given that the economy is growing at a moderate pace. The Fed is widely expected to raise rates twice more in 2017, with the next rate expected in June. At the same time, some Fed policymakers are in favor of three more rate hikes, which would bring the total this year to four moves.
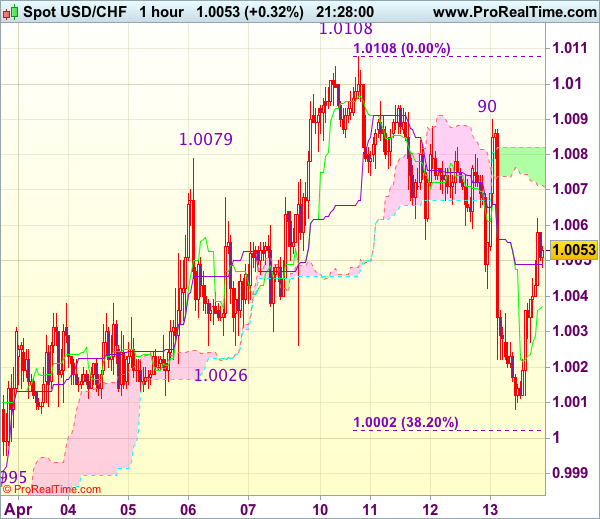
Trade Idea Update: USD/CHF – Stand aside
USD/CHF - 1.0063
Original strategy :
Buy at 0.9995, Target: 1.0100, Stop: 0.9960
Position : -
Target : -
Stop : -
New strategy :
Stand aside
Position : -
Target : -
Stop : -
As the greenback has surged again after staging a strong rebound from 1.0008, suggesting the fall from 1.0108 has ended there and consolidation with mild upside bias is seen for test of resistance at 1.0090, however, a firm break above there is needed to retain bullishness and signal the fall from 1.0108 has ended, bring a retest of 1.0108 but only a break of this week’s high at 1.0108 would confirm recent upmove from 0.9813 has resumed for headway to 1.0140-45 and later towards another previous resistance at 1.0171.
In view of this, would not chase this rise here and would be prudent to stand aside for now. Below the Tenkan-Sen (now at 1.0040) would bring test of 1.0025, break there would signal an intra-day top is formed, bring another fall to 1.0007, once this level is penetrated, this would revive bearishness and extend fall to previous support at 0.9995, then towards 0.9970 (50% Fibonacci retracement of 0.9831-1.0108).
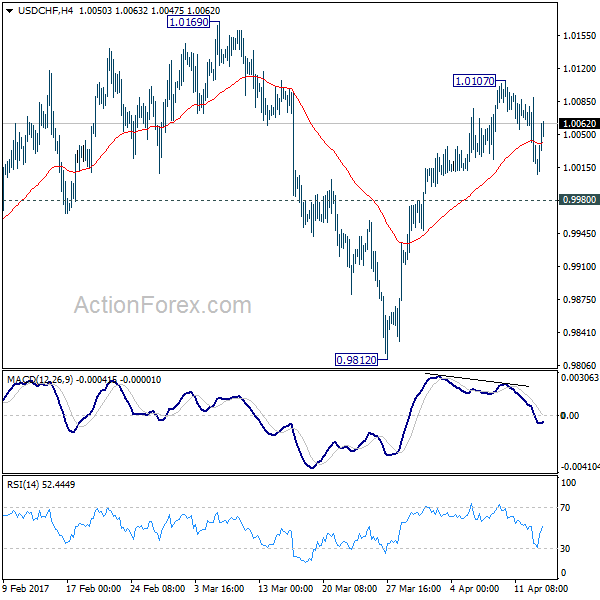
USD/CHF Mid-Day Outlook
Daily Pivots: (S1) 1.0004; (P) 1.0047; (R1) 1.0072; More.....
USD/CHF is still staying above 0.9980 support for the moment. Intraday bias remains neutral with cautiously bullish outlook. Corrective fall from 1.0342 should have finished with three waves down to 0.9812. Above 1.0107 will target 1.0169 resistance. Decisive break there will confirm this bullish case and target 1.0342 key resistance next. However, below 0.9980 will dampen this bullish case and turn bias back to the downside for 0.9812 low.
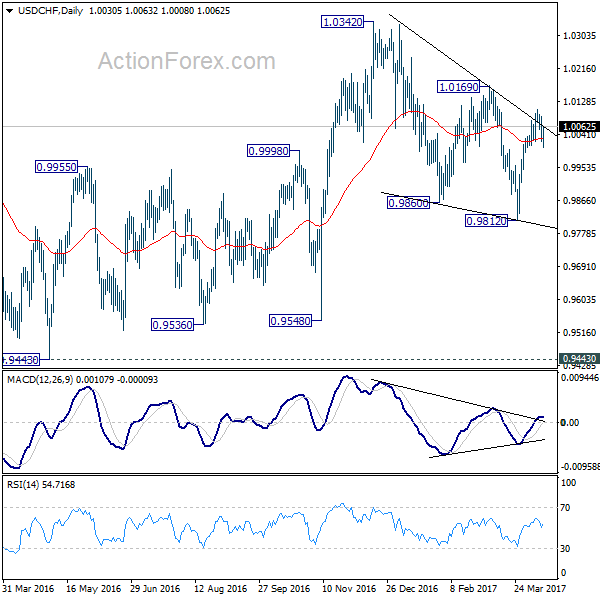
In the bigger picture, we're still maintain that firm break of 1.0342 key resistance is needed to confirm underlying bullish momentum in the cross. However, the corrective nature of the fall from 1.0342 to 0.9812 is starting to give the medium term outlook a bullish favor. Hence, in stead of looking for topping signal around 1.0342, we'd now pay closer attention to upside acceleration as USD/CHF approaches this level again.
Trade Idea Update: GBP/USD – Buy at 1.2485
GBP/USD - 1.2527
Original strategy :
Buy at 1.2485, Target: 1.2585, Stop: 1.2450
Position : -
Target : -
Stop : -
New strategy :
Buy at 1.2485, Target: 1.2585, Stop: 1.2450
Position : -
Target : -
Stop : -
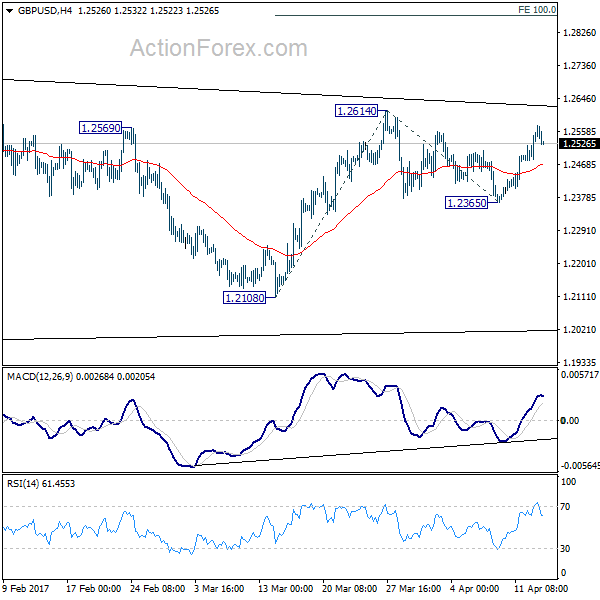
As cable has continued trading with a firm undertone after this week’s rally, adding credence to our view that low has been formed at 1.2365 on Monday and upside bias remains for the rebound from there to extend gain to 1.2585-90, however, break of previous resistance at 1.2616 is needed to retain bullishness and extend further subsequent rise to 1.2650-60.
In view of this, would not chase this rise here and would be prudent to buy cable on pullback as 1.2481 support should limit downside and bring another upmove later. Below the lower Kumo (now at 1.2455) would defer and suggest top is formed, risk test of 1.2433 (previous resistance) first.
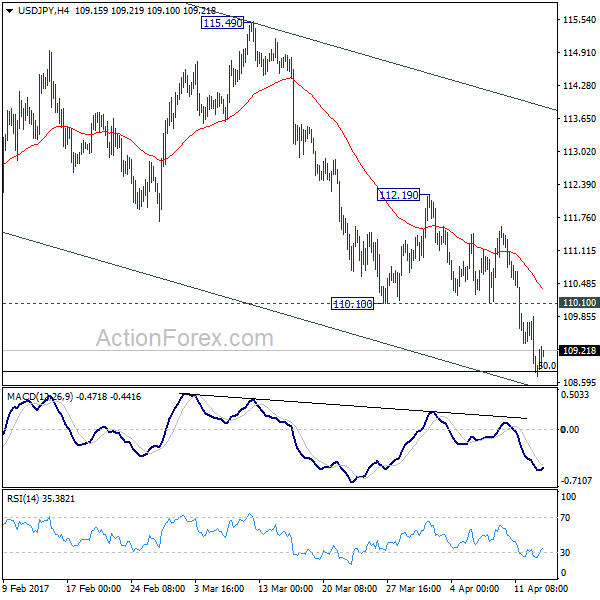
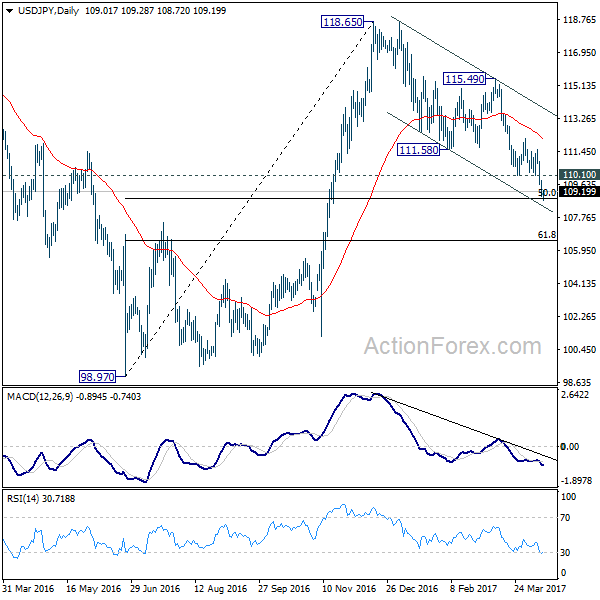
USD/JPY Mid-Day Outlook
Daily Pivots: (S1) 108.67; (P) 109.26; (R1) 109.58; More....
At this point, intraday bias remains on the downside with 110.10 support turned resistance intact. Sustained break of 50% retracement of 98.97 to 118.65 at 108.81 will target 61.8% retracement at 106.48 and possibly below. Nonetheless, break of 110.10 will indicate short term bottoming and turn bias back to the upside for 112.19 resistance.
In the bigger picture, price actions from 125.85 high are seen as a corrective pattern. Sustained trading below 55 week EMA (now at 111.15) will indicate that the second leg from 98.97 has completed at 118.65. And in that case, USD/JPY would start the third leg down through 98.97 low to 61.8% retracement of 75.56 to 125.85 at 94.77. On the upside, break of 115.49 resistance should resume the rise from 98.97 for a test on 125.85 high.
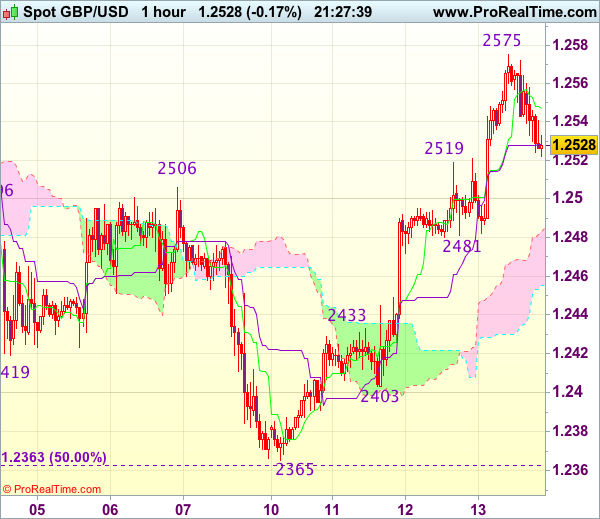
GBP/USD Mid-Day Outlook
Daily Pivots: (S1) 1.2499; (P) 1.2524; (R1) 1.2567; More...
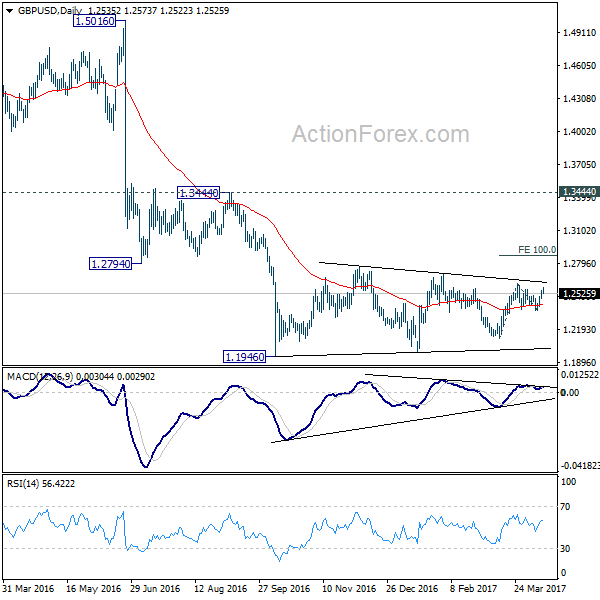
Intraday bias in GBP/USD remains on the upside for 1.2614 resistance. Break there will resume whole rise from 1.2108 and target 100% projection of 1.2108 to 1.2614 from 1.2365 at 1.2871. But overall, price actions from 1.1946 low are viewed as a consolidation pattern. We'd expect strong resistance around 55 week EMA (now at 1.3015) to limit upside and bring down trend resumption. But for now, further rise will be favored in near term as long as 1.2365 support holds.
In the bigger picture, fall from 1.7190 is seen as part of the down trend from 2.1161. There is no sign of medium term reversal yet. Sustained trading below 61.8% projection of 2.1161 to 1.3503 from 1.7190 at 1.2457 will target 100% projection at 0.9532. Overall, break of 1.3444 resistance is needed to confirm medium term bottoming. Otherwise, outlook will remain bearish.