Sample Category Title
Aussie Shrugs After RBA Says No Rush to Ease
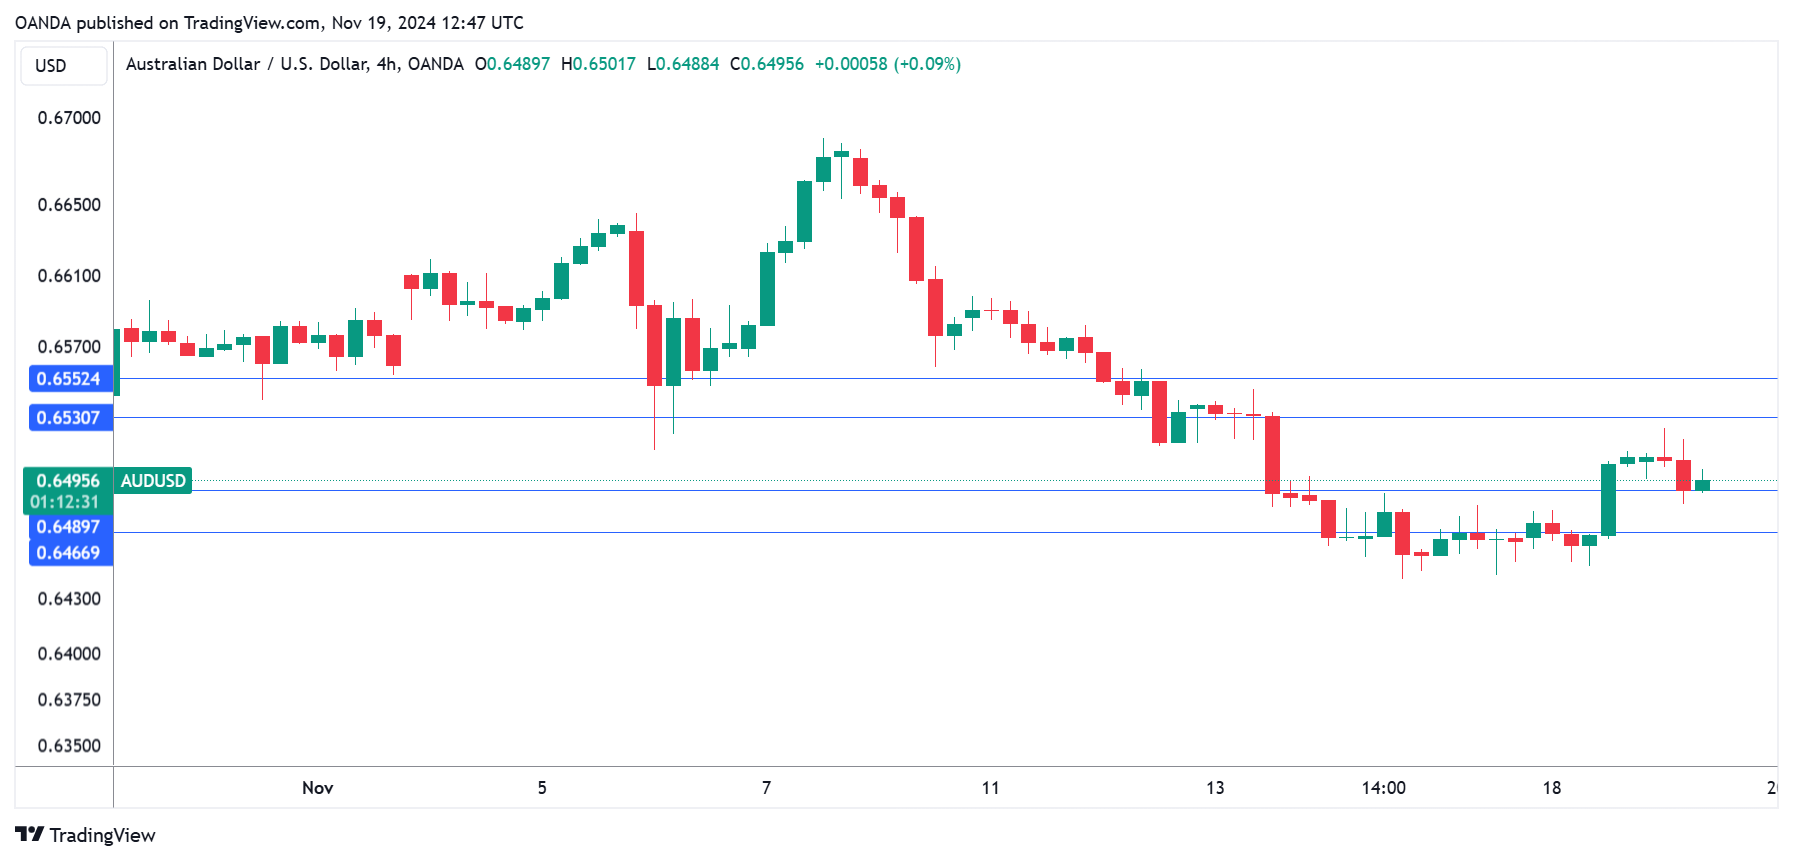
The Australian dollar is showing limited movement on Tuesday. In the European session, AUD/USD is trading at 0.6501, down 0.14% on the day. The Aussie flew out of the gates on Monday, climbing 0.75%.
RBA minutes: No rush to cut rates
The Reserve Bank of Australia has maintained its cash rate at 4.35% over the past year, making it an outlier among other major central banks that are in the midst of a rate-cutting cycle. The RBA released the minutes of the meeting earlier this month, which indicated that policymakers are not in any rush to lower rates.
The minutes stated that the Board considered underlying inflation to be “too high” and it did not expect inflation to return sustainably to the 2%-3% target range until 2026. The Board remained “viligant to the upside risks of inflation” and that “it was not possible to rule anything in or out in relation to future changes in the cash rate target”. That is a long way of saying that the Bank has not ruled out rate cuts or hikes.
The minutes reiterated that the Board’s highest priority is returning inflation to target. Given that the Board stated that inflation remains too high and goods inflation is expected to rise, the message from the minutes is that a rate cut is not imminent. The minutes served as a message to the markets that the RBA is willing to maintain rates unless inflation falls unexpectedly. The RBA meets next on Dec. 10 and is expected to hold rates.
AUD/USD Technical
- AUD/USD tested support at 0.6489 earlier. Below, there is support at 0.6467
- 0.6530 and 0.6552 are the next resistance lines
BoE’s Bailey links tax rises to need for measured policy easing
BoE Governor Andrew Bailey highlighted in a parliamentary committee hearing today that the Labour government’s tax increases, outlined in the Autumn Budget, support the central bank’s gradual approach to easing monetary policy.
He explained, “There are different ways in which the increase in employer National Insurance Contributions announced in the Autumn Budget could play out in the economy.” This cautious approach, he said, will allow the Bank to observe how these fiscal changes interact with other inflation risks.
Bailey also cautioned about persistent wage pressures, with firms surveyed by the BoE expecting wage growth of 4% over the next year, even as the labor market shows early signs of loosening. He emphasized the importance of carefully monitoring these developments.
ECB’s Panetta calls for shift to neutral amid stagnant demand
Italian ECB Governing Council member Fabio Panetta emphasized today that restrictive monetary policies are "no longer necessary", given inflation’s proximity to the target and sluggish domestic demand.
Panetta noted, “In the current phase, we should focus more on the sluggishness of the real economy,” highlighting the risk that a lack of recovery could drive inflation well below target, creating challenges for monetary policy to counteract.
He advocated for normalizing the ECB’s stance and moving toward a neutral or even “expansionary territory” if necessary, stressing, “We are probably a long way from the neutral rate.” Panetta also reminded that lowering rates below neutral at the bottom of a cycle aligns with standard policy frameworks historically followed by both ECB and Fed.
Separately, Estonian ECB Governing Council member Madis Muller shared that, “I wouldn’t ever want to say anything is a done deal,” but he expressed confidence that “we can again reduce interest rates in December.”
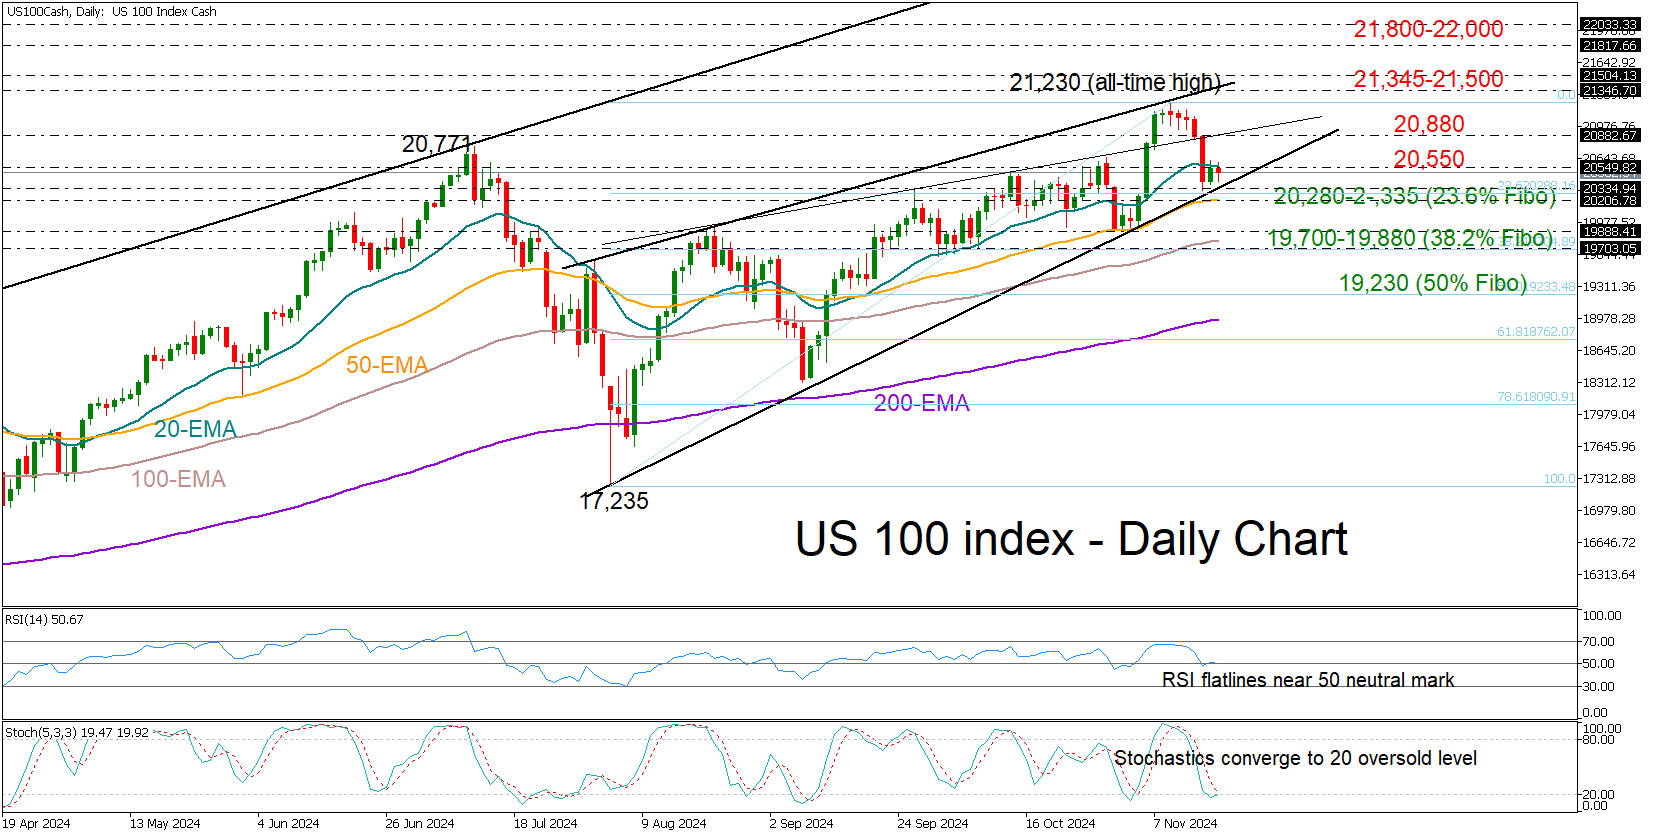
US 100 Index Awaits Fresh Direction
- US 100 index slides below 20-day EMA, but remains supported
- Technical indicators reflect uncertainty among traders
The US 100 stock index has recently pulled from a record high of 21,230 to set a footing near the 23.6% Fibonacci retracement of its August-November uptrend at 20,288. Despite its retreat, the index seems well-supported and market sentiment is currently in a holding pattern.
The 20-day exponential moving average (EMA) has again resumed its resistance role, capping the index within a tight range, as seen earlier this month. With technical indicators offering unclear signals, traders are stuck in wait-and-see mode. The Relative Strength Index (RSI) sits around its 50 neutral level, signaling indecision, while the stochastic oscillator seems to be printing a potential bullish cross just around its 20 oversold level.
Given the current setup, the index is poised for a potential breakout in either direction. A rally above the 20-day EMA at 20,550 could pave the way toward the 20,880 barrier. Even higher, the bulls could attempt to chart a new record high near the resistance line at 21,345, while a step above 21,500, could challenge the 161.8% Fibonacci extension of the latest pullback at 21,800 or even touch the psychological bar of 22,000.
On the other hand, if the index falls below the support trendline from August at 20,335 and beneath its 50-day EMA, bearish momentum could pick up steam toward 19,880 and the 38.2% Fibonacci of 19,700. A deeper pullback could eventually bring the 50% Fibonacci level at 19,230 into play.
In short, the US 100 index is holding a neutral bias, waiting for a clear move above 20,550 or below 20,200 to gain fresh direction.
Gold Price Analysis: Is $2,600 Breakout a Bullish Signal or a Temporary Retracement?
- The bullish rally in gold is fueled by concerns over the Russia-Ukraine conflict stirring safe haven demand.
- Market sentiment is torn between the prospect of fewer Fed rate cuts in 2025 and rising geopolitical risks
- Goldman Sachs analysts predict gold will set new records by the end of 2025, further bolstering bullish sentiment.
Gold bulls came out of the blocks with speed this week as heightened geopolitical tensions in Europe dominated the weekend. News that the US has authorized Ukraine to use ATACMS missiles to strike in Russian Territory saw the precious metals safe have appeal return.
There is no doubt that Gold has also benefited from a weaker US Dollar to start the week.
Currency Strength Chart (Strongest to Weakest): JPY, AUD, NZD, USD, CAD, GBP, CHF, EUR
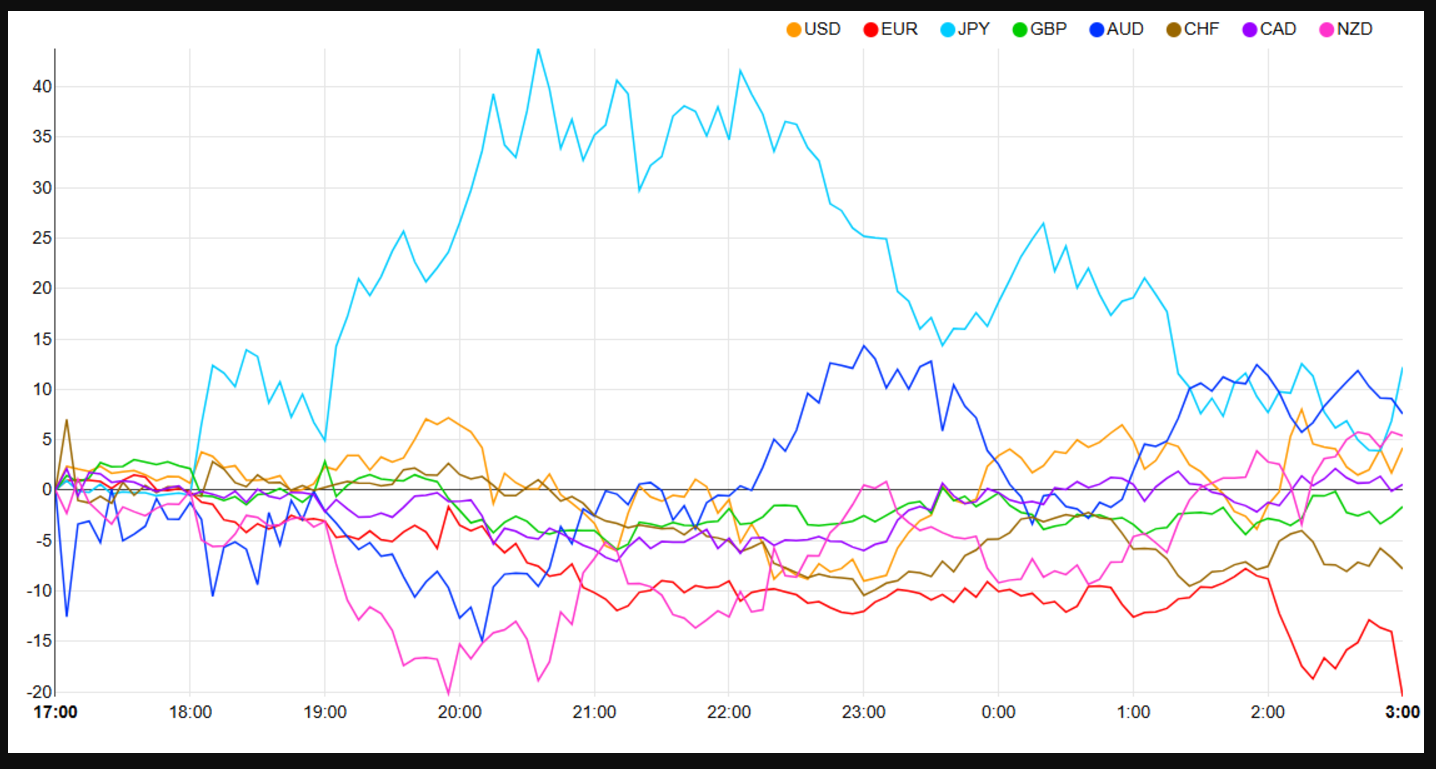
Source: FinancialJuice
At the moment though, the precious metal is caught between a rock and a hard place. Markets continue to bet on less rate cuts in 2025 from the Federal Reserve which is keeping the USD supported. At the same time, the heightened geopolitical risk around Russia-Ukraine and the ongoing situation in the Middle East are keeping Gold buyers interested. The question is, which of the two opposing forces will win?
The longer term picture for Gold does appear to favor the bulls. Looking back at President Trump’s first term in office, Gold prices rose as much as 55% on account of the trade war with China and tensions with Iran and North Korea. Looking at the picks by President Trump for some of the key positions in his administration and a lot of them are what you would call ‘China hawks’.This has only ramped up expectations of a potential US-China trade war, one of the driving forces behind the Gold rally in Trump’s previous term. Will history repeat itself?
Adding to the idea that Gold might be beginning the next leg to the upside, Goldman Sachs analysts predict the precious metal will set a new record by the end of 2025.
Economic Data Ahead
US data is sparse this week with Geopolitics and more names for Trump’s cabinet likely to drive market sentiment. This morning, news that Russian President Vladimir Putin may use nuclear weapons to any strikes on Russian territory have added a new safe haven narrative.
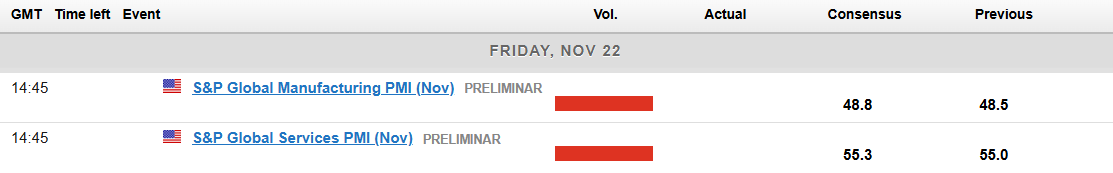
On Friday, the only high impact data release from the US is due. The S&P global PMI report will be watched closely as markets are still weighing up the actual health of the US jobs market. This is a direct result from two broad-based downgrades to the numbers since June.
Following the US PPI data release last week, markets will also focus on the pricing of manufacturing and labor costs. Any uptick here usually trickles downstream to consumers and could suggest an uptick in inflation is indeed on its way, even before President Trump officially takes office.
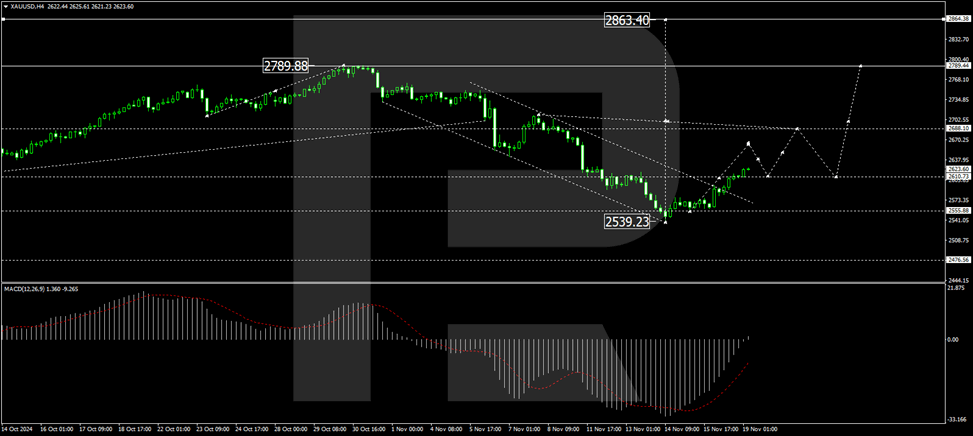
Technical Analysis Gold (XAU/USD)
From a technical analysis standpoint, Gold has failed to maintain its bearish momentum despite a daily candle close below the outer trendline. Earmarks of a false breakout as the precious metal found support at the 100-day before rallying over the last two days to rise around 2.7% thus far.
The previous breakout of the inner trendline was followed by a retest before a continuation to the downside. This time however, the geopolitical landscape has helped the precious metal push toward a key resistance area around the 2650 handle.
The move higher this week mirrors the selloff over the past week or two, the question is will it be able to match the selloff in terms of the size of the move. If Goldman Sachs are right, this could potentially be the beginning of the next upside leg leading to new ATHs.
Immediate resistance rests at 2639 and 2650 before the longer term zone around 2673 comes into focus.
On the support side, we have potential support resting at 2624 and 2600 before last week’s lows come into focus.
GOLD (XAU/USD) Daily Chart, November 19, 2024
Source: TradingView (click to enlarge)
Support
- 2624
- 2600
- 2574.5
Resistance
- 2639
- 2650
- 2673
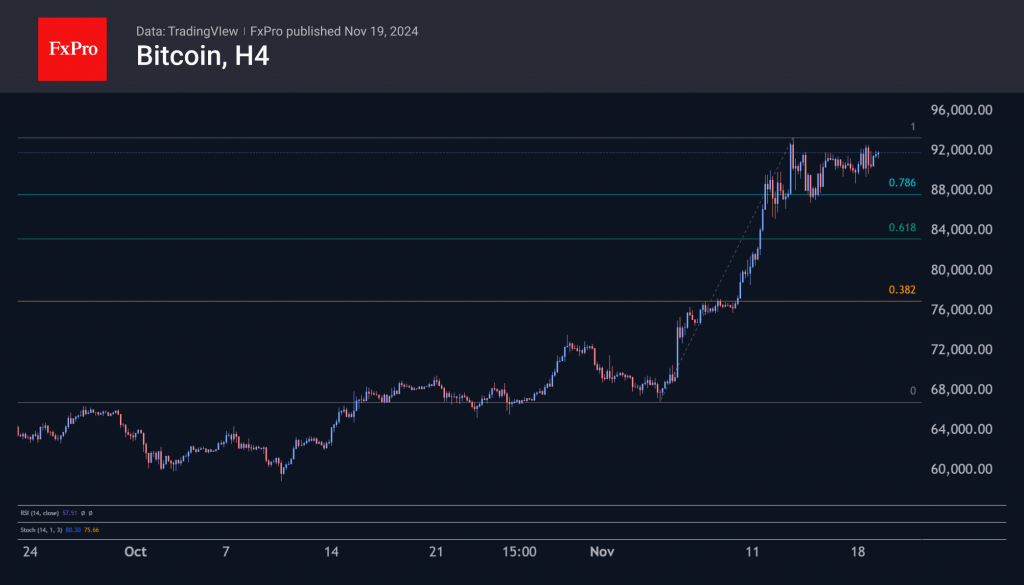
Bitcoin Aiming for $110K
Market Picture
The cryptocurrency market is down 0.5% in 24 hours to $3.08 trillion. The market has paused after rallying since the end of last week. Ethereum and Litecoin have pulled back from recent highs, while XRP is stabilising. Bitcoin and Solana are hovering near recent highs and are getting ready to update them.
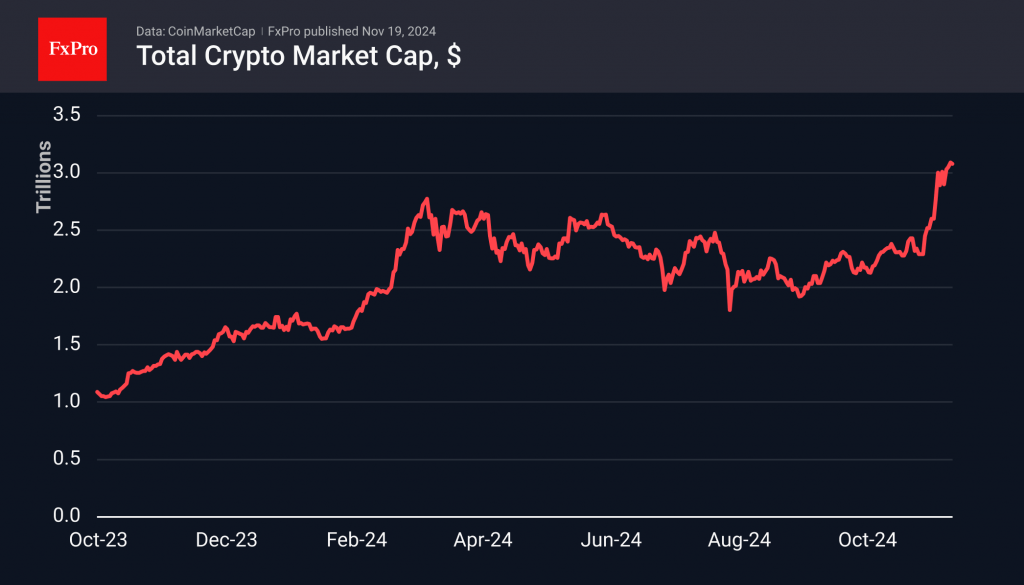
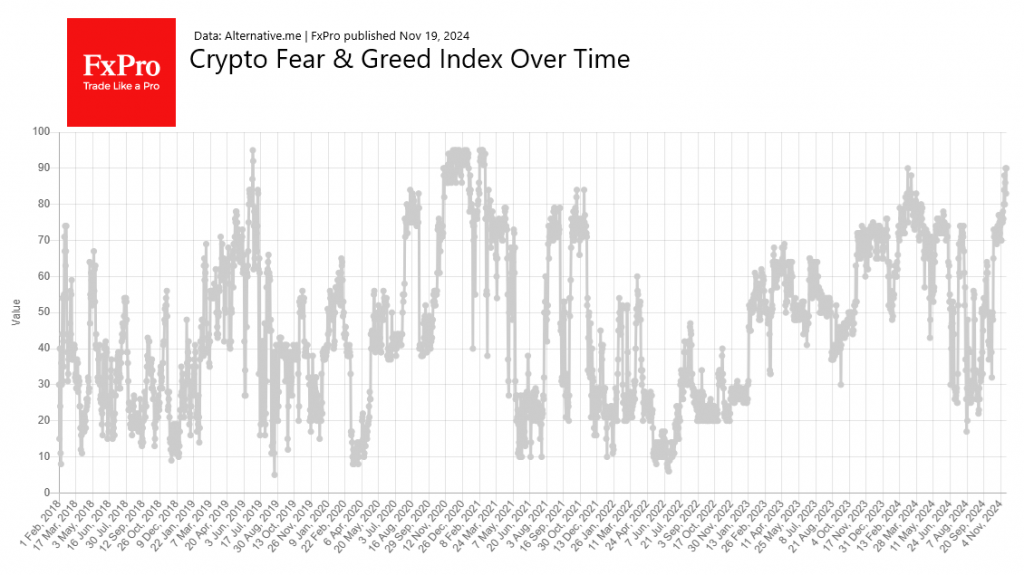
As a result, the sentiment index reached 90 for only the third time this year—it was only higher at the end of 2020. This sentiment confirms that traders are sticking to the four-year halving cycles. In 2020, price records attracted companies to buy the first currency in reserve to support market interest in equities. By 2024, even politicians seem to be scoring PR points by showing their commitment to Bitcoin.
Bitcoin is trading at nearly $92K. A break above the 13th’s highs of $93.3K would signal an entry into a growth extension with a target of $110K after a corrective pullback to 76.4% of the initial momentum. Such shallow corrections are typical of strong bull markets when buyers quickly return.
News Background
According to CoinShares, global crypto fund investments rose by $2.193 billion last week, following inflows of $1.978 billion the week before. Investments in Bitcoin rose by $1.481 billion, Ethereum by a significant $646 million, and Solana by $24 million. Investments in funds that allow bitcoin shorts rose sharply by $49 million. Investments in funds with multiple crypto assets fell by $19 million.
BCA Research noted that the value of one of the fractal analysis metrics signals a possible rise in Bitcoin above $200K in the current cycle.
Bernstein expects key catalysts in 2025 to push Bitcoin towards the $200K target level. These include the appointment of a new SEC chairman and treasury secretary, regulatory easing, progress on creating a US strategic bitcoin reserve, creating a powerhouse for BTC mining in the US, and creating a regulatory framework for stablecoins. Another driver will be coin purchases in ETFs, as well as by miners and companies such as MicroStrategy.
From the 11th to the 17th of November, MicroStrategy purchased an additional 51,780 BTC (~$4.6 billion) using proceeds from the issuance and sale of shares. The average purchase price was approximately $88,627. MicroStrategy now reserves 331,200 BTC at an average price of $49,874 per coin.
Record daily fees pushed Solana to a peak of over $245 in December 2021. The return of meme coin hype fuelled high network activity.
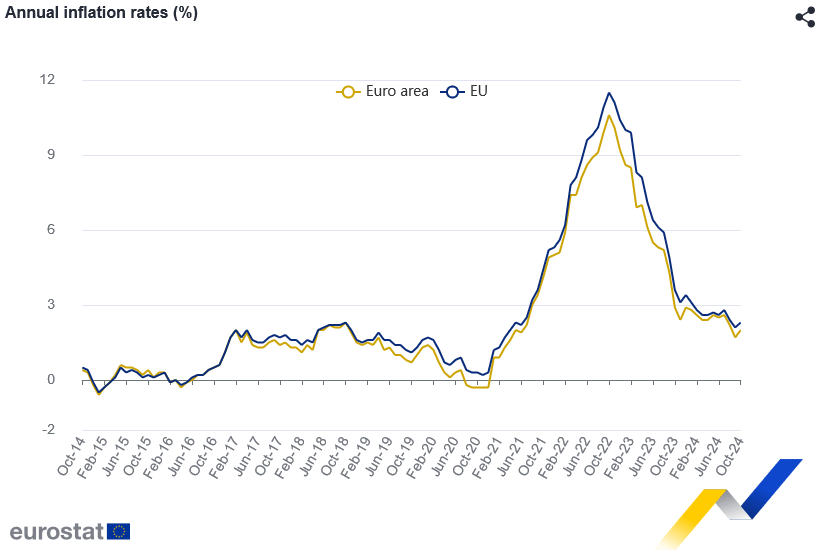
Eurozone CPI finalized at 2% in Oct, core CPI at 2.7%
Eurozone inflation was finalized at 2.0% yoy in October, a rise from September's 1.7% yoy. Core CPI, excluding volatile components such as energy, food, alcohol, and tobacco, held steady at 2.7% yoy. Among contributors, services had the largest impact, adding +1.77 percentage points to the overall rate, followed by food, alcohol, and tobacco (+0.56 pp) and non-energy industrial goods (+0.13 pp). Energy, on the other hand, exerted downward pressure, subtracting -0.45 pp from the headline figure.
Inflation across the broader EU came in at 2.3% yoy, up slightly from September's 2.1%. Member states showed a wide divergence in inflation rates. Slovenia recorded no inflation at 0.0%, while Lithuania and Ireland posted modest increases of 0.1%. At the other end of the spectrum, Romania led with the highest annual rate of 5.0%, followed by Belgium and Estonia at 4.5% each. Compared to September, inflation rose in 19 member states, remained stable in six, and declined in two.
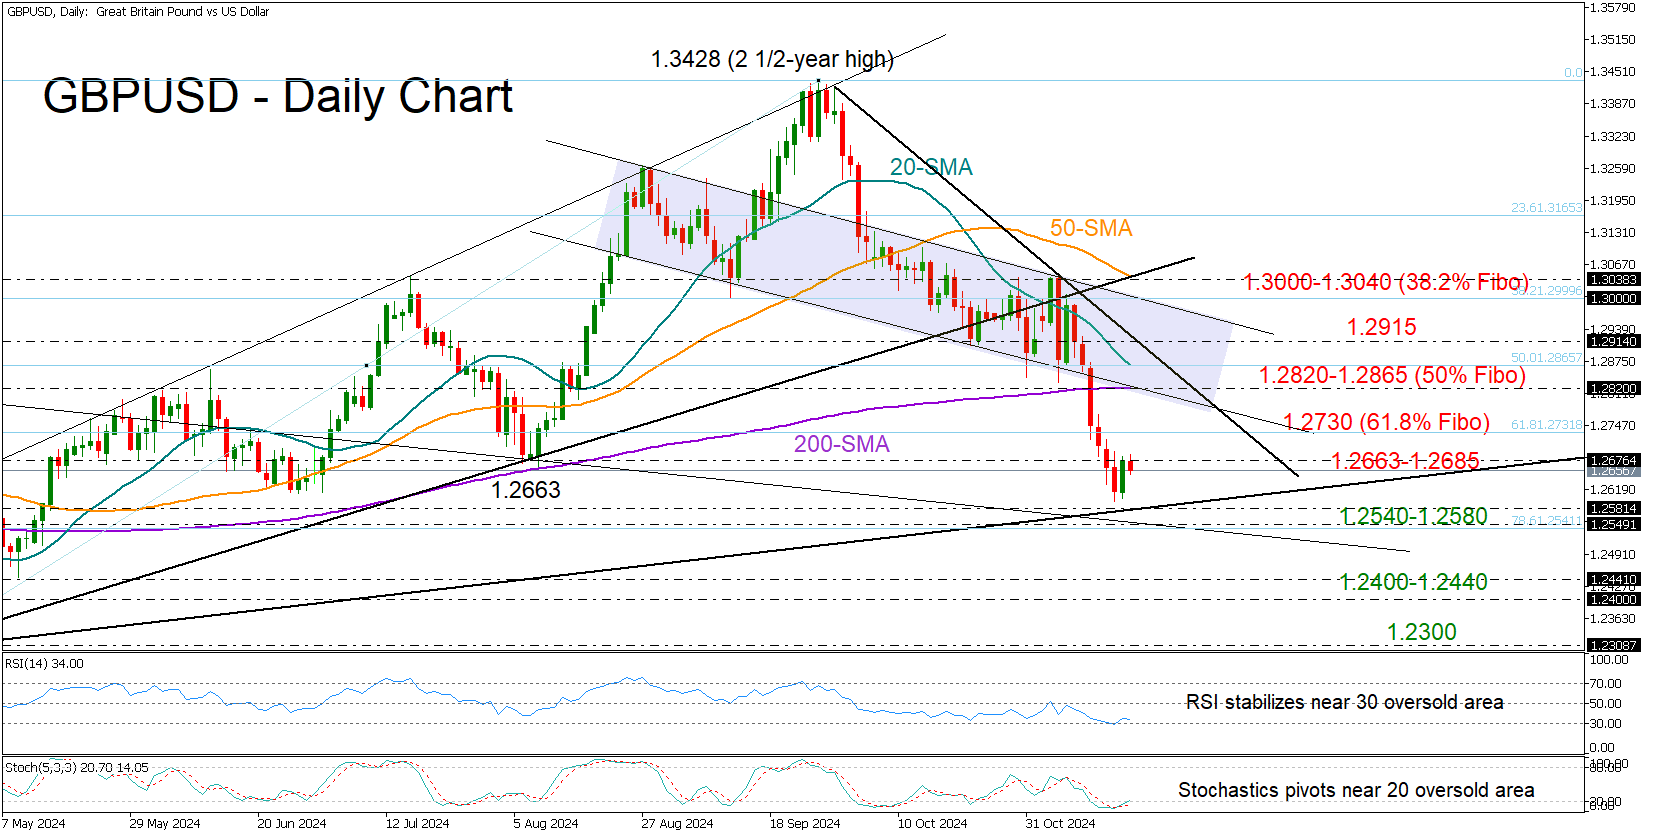
GBPUSD Gains Traction Near Familiar Support Area
- GBPUSD bulls step in after six-month low near 1.2600
- Price near oversold area, but bullish area is above 1.3000
GBPUSD returned to gains after a six-day decline squeezed it to a six-month low of 1.2595. The pair rebounded near an important trendline from October 2023, and indicators like the RSI and stochastic oscillator suggest the price is likely set for an upward move from oversold territory.
Yet, buyers may not make additional moves until the price clearly crawls back above August’s base of 1.2663-1.2685. The 1.2730 bar, which overlaps with the 61.8% Fibonacci retracement of the April-September upleg, could be another hurdle before the 200-day simple moving average (SMA) and the 50% Fibonacci mark of 1.2865 come into view. If the tentative resistance line gives way at 1.2915, the bulls could accelerate toward the critical 1.3000-1.3040 constraining zone with scope to change the trend back to positive.
In the bearish scenario where the pair slips below the 1.2540-1.2580 floor, a sharp decline could occur toward 1.2400-1.2440. The 1.2300 round number, which almost triggered April’s rally, may resume its supportive role if selling pressure intensifies.
In summary, GBPUSD seems poised for a potential recovery, but a clear break above 1.2663-1.2685 is needed to confirm additional gains.
Understanding Forex Options: Strategies for Beginners
Forex options are an increasingly popular tool among traders looking to diversify their strategies and manage risk in the foreign exchange market. While trading forex in the spot market is common, understanding forex options opens up new possibilities for traders, particularly beginners. This article will walk you through the basics of forex options and outline strategies that are ideal for those just starting out.
What Are Forex Options?
Before exploring strategies, it’s crucial to grasp what forex options entail. These financial derivatives provide traders with the option to buy or sell a currency pair at a set price (the strike price) by or before a certain expiration date. Unlike spot forex trading, where transactions happen instantly, forex options enable traders to speculate on future price movements without needing to commit to a trade unless the conditions are favorable.
The two main types of forex options are:
- Call options: Give the holder the right to buy a currency pair.
- Put options: Give the holder the right to sell a currency pair.
The flexibility offered by these options is part of why they are popular among both experienced and novice traders.
Types of Forex Options
Forex options come in various forms, each offering different levels of complexity and flexibility for traders to explore in the currency markets.
Vanilla Options
Vanilla options are the most straightforward and commonly used type of forex option. These are standard call or put options with no additional complexities or conditions. For example, a vanilla call option on the EUR/USD pair allows the trader to buy the euro at a specific price on or before the option's expiration date.
Vanilla options are a great starting point for beginners due to their simplicity and ease of understanding.
Exotic Options
For those looking to explore more complex strategies, exotic options offer a wide array of choices, including binary options and barrier options. Exotic options are often used by advanced traders due to their unique features, such as conditions that need to be met before they can be exercised.
A common exotic option in the forex market is the binary option, where traders predict whether the price of a currency pair will end up above or below a set level.
How Forex Options Work
Understanding how to trade forex options requires familiarity with a few key concepts:
- Strike Price: This is the price at which the holder of the option can buy (call) or sell (put) the currency pair.
- Expiry Date: Forex options have a limited lifespan. The expiry date is the last day the option can be exercised.
- Premium: To buy an option, you pay a premium, which is the cost of having the flexibility that options provide. The premium is non-refundable and represents the potential risk in an option trade.
The most attractive feature of forex options is that they come with limited risk. You can never lose more than the premium you pay upfront, making them appealing to beginners. You can view more about how to get started and how to make informed decisions.
Benefits of Trading Forex Options for Beginners
With forex options, your maximum loss is capped at the premium you pay for the option. This makes them an excellent tool for risk management, especially if you are not ready to take on the full risk of trading forex in the spot market.
Forex options allow for more flexible strategies. Unlike spot forex trading, where you are fully committed to the trade once it’s executed, with options, you can choose not to exercise them if market conditions don’t favor you. This makes them ideal for new traders still learning the market’s intricacies.
You can profit from both bullish and bearish market conditions. For instance, if you expect the euro to strengthen against the US dollar, you could buy a call option on the EUR/USD pair. On the other hand, if you expect the euro to weaken, you might buy a put option.
Key Strategies for Beginners
When starting with forex options, beginners need to use simple, risk-controlled strategies to build confidence and minimize potential losses.
- Protective Put Strategy: One of the simplest and most effective strategies for new traders is the protective put strategy. It involves holding a position in the spot forex market while buying a put option as a form of insurance. If the market moves against your spot position, the gains from the put option can help offset your losses.
- Covered Call Strategy: This strategy is another beginner-friendly option. It involves holding a currency position in the spot market and simultaneously selling a call option. This strategy allows traders to earn a premium while potentially profiting from modest price movements in the underlying currency.
- Long Straddle Strategy: This strategy involves buying both a call and a put option with identical strike prices and expiration dates. This method is useful when you expect significant price fluctuations in a currency pair but are unsure of the market’s direction.
Conclusion
Forex options provide a unique and flexible way to participate in the currency markets. For beginners, they offer a controlled risk environment with the potential for significant rewards. By starting with simple strategies like protective puts and covered calls, you can learn how to trade forex options effectively while managing your risk. As you gain more experience, more advanced strategies like long straddles can be introduced to your trading portfolio.
Gold Rebounds Amid USD Weakness and Geopolitical Uncertainties
Gold prices rebounded, crossing 2,620 USD per troy ounce on Tuesday, as the US dollar weakened, and investors sought clarity on the Federal Reserve’s monetary policy direction. The likelihood of a Fed rate cut in December currently stands at 59%, reflecting a slight decline from previous days.
Market participants also closely monitor potential cabinet picks by US President-elect Donald Trump, whose protectionist policies could influence gold prices. Anticipating critical appointments that may shape Trump’s economic policies adds to market sensitivity.
Growing geopolitical tensions worldwide heighten demand for safe-haven assets, boosting gold’s appeal. After recent declines, the fundamental factors supporting gold’s longer-term ascent are prompting investors to engage at current levels they perceive as attractive.
Technical analysis of XAU/USD
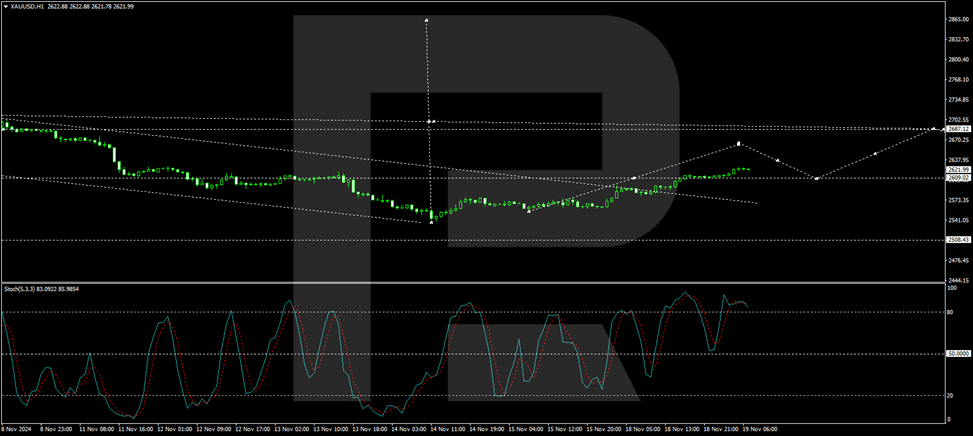
H4 chart: The market has completed a correction to 2,537 on the H4 chart and is now poised for a growth wave aiming for 2,688. If this target is reached, a potential retracement to 2,610 may occur before a further push towards 2,790. This bullish scenario is supported by the MACD indicator, whose signal line is gearing upwards from below zero.
H1 chart: On the H1 chart, gold is progressing through the initial phase of a growth wave to 2,688. The price has currently stabilised around 2,609, forming a tight consolidation range. An upward break from this range is anticipated to target 2,660. Once this is achieved, a brief pullback to 2,609 might unfold before continuing the ascent towards 2,688. The Stochastic oscillator supports this view, indicating strong upward momentum with its signal line heading towards 80 from above 50.