
Sample Category Title
Dollar Up, Oil Down – Eyes on US CPI
The US yields pushed higher and the dollar rally gained further momentum yesterday, as investors continued to surf on the idea that Donald Trump’s pro-growth policies and tariffs would boost inflation in the US and limit the Federal Reserve’s (Fed) capacity to ease the monetary policy as much as previously anticipated. Yesterday’s data showed an improved economic optimism in the US in November. The US 2-year yield, for example, which best captures the rate expectations, is up by 85bp since the September dip, we could see a similar jump in the US 10-year yield. Minneapolis Fed President Neel Kashkari said that he’ll be looking at the inflation data to decide whether he would back another rate cut in December. And activity on Fed funds futures gives no more than 62% for another 25bp in December, before the release of the latest US CPI update today.
Inflation regains importance
The CPI data has regained importance since Donald Trump was re-elected President of the US. Jobs data remains crucial for the Fed’s policy path, as the last thing the Fed wants is to panic and lose control of the situation, but the Fed’s victory over inflation looks more vulnerable today than it did a month ago. And that’s supportive of the US dollar.
Of course, October figures won’t tell much about the Trump effect on consumer prices. We must wait a few months before we start seeing the impact of Trump on numbers. But the higher the numbers, the lower the December cut expectations. And I sense that today’s numbers may not sooth the doves’ nerves: the US headline inflation is expected to have climbed from 2.4% to 2.6%, while core inflation is seen steady near 3.3% - still significantly above the Fed’s 2% policy target. Any upside pressure in figures should continue to drive capital into the US dollar. But the US dollar has hit the overbought market conditions following a 6% rebound since the beginning of October. Therefore, any weakness in the data could help tame demand in the short-run, trigger a minor correction and give the US dollar bulls opportunity to strengthen their bullish positions for the year end. Voices calling for a further slide of EURUSD toward parity are growing.
But wait! The US dollar’s strength will likely hit a speed bump, and the initial rally will probably continue at a lower speed, because the USD appreciation, and other currencies’ depreciation, will boost inflation expectations in the rest of the world and lead to a slower-than-otherwise easing in other central bank rate policies.
Still, the US dollar outlook is comfortably bullish at the moment as there is room for a further retreat in dovish Fed expectations.
Oil under pressure
The barrel of US crude is testing the $68pb offers to the downside on sluggish Chinese, global demand, ample supply from non-OPEC countries, and the absence of fresh tensions from the Middle East. Add to that the fact that OPEC cut its oil demand forecast for fourth consecutive month this week, and you have a comfortably bearish picture in crude oil.
In numbers, OPEC expects the global oil consumption to increase by 1.8 mbpd in 2024 – just under 2%. And it’s more optimistic than many bank forecasts, Aramco’s own forecasts and roughly the double of the IEA’s estimation. The latter will release their latest report on Thursday.
Under these circumstances, the oil bears keep control in their hands. Trend and momentum indicators remain comfortably bearish, the RSI indicator isn’t close to overbought market conditions – meaning that there is room for the selloff the extend in the short run, and the $70/71pb range – that shelters the minor 23.% Fibonacci retracement and the 50-DMA – is crowded with offers. The major upside risk (besides geopolitical risks) is another delay to the end of OPEC production restriction plans. I see that coming big as a mountain. But that decision will certainly not come before the 1st of December, at OPEC’s next scheduled meeting, unless we see an accelerated meltdown in oil prices that would necessitate an early announcement from the cartel. For now, price rallies are interesting top selling opportunities. Solid resistance is seen into $70/71 range and the key resistance to the actual negative trend stands at the 72.85pb level, the major 38.2% Fibonacci retracement on the summer to now selloff.
The downside pressure in oil prices weigh on oil company valuations, but the downside in oil companies’ share prices remain limited by optimism that Donald Trump loves oil companies and will want them to pump and sell as much as possible to lower energy prices. Exxon for example is trading near $120 per share, a few dollars below an ATH level defying weaker oil prices.
But note that, even though oil giants are happy to see oil-friendly Donald Trump take the reins of the US, they prefer price over volume and Exxon’s CEO even said that Trump shouldn't bail on the Paris climate deal and doesn't see a big near-term boost in US oil output.
All Eyes on US CPI
In focus today
Today's most important data release will be the US October CPI, where we expect inflation to slow down in both headline (+0.1% m/m SA, from +0.2%) and core (+0.2% m/m SA, from +0.3%) terms. In annual terms, headline inflation could still appear to accelerate due to base effects stemming from a low reading a year ago (headline forecast 2.5% y/y, from 2.4%).
In the euro area, focus turns to industrial production data for September, which will show how actual production fared. The data is interesting as hard data has been better compared to PMIs in the manufacturing sector.
In Sweden, Riksbank minutes will be released at 09.30 CET. Since the decision to cut by 50bp was unanimous, all board members appear to stand behind the message in the monetary policy update that indicated a weaker real economy that led to the jumbo cut. Still, we look for any cracks in the façade and expect Riksbank to move more slowly going forward.
Economic and market news
What happened yesterday
In the US, the NFIB's small business optimism index showed a slight improvement in overall sentiment in October, increasing to 93.7 from 91.5. General uncertainty reached an all-time-high ahead of the election, but we have seen similar movements ahead of previous elections as well. Labour market indicators were little changed, while job openings and hiring plans remained slightly below pre-pandemic levels. Similarly, inflation indicators saw only minor changes, with firms' "price plans"-index staying just slightly above pre-covid levels. Overall, US businesses remain in good shape especially now that political uncertainty is set to gradually ease.
In politics, the Republicans moved closer to clinching the House, with Edison Research projecting another race win, bringing them to at least 216 seats - just two seats short of the 218-majority threshold. Winning the House would complete a Republican sweep, giving Trump full leverage to proceed with his agenda. As noted earlier this week, this scenario could widen the budget deficit, public debt, and potentially lead to renewed inflationary pressures.
In the euro area, Olli Rehn, Finnish central bank chief, said that the ECB is likely to continue cutting rates, potentially reaching the neutral level in H1 2025. While the direction is clear, Rehn highlighted that the pace and size of cuts will depend on the inflation outlook, the dynamics of underlying inflation and monetary policy transmission. We believe that November PMIs will weigh more heavily than usual on the size of the December ECB rate cut, where we project a 25bp cut.
In Germany, the ZEW indicator declined in November, with the downtick being broad-based. The assessment of the current situation declined further to -91.4 (cons: -85.0, prior: -86.9), its lowest level since May 2020. Similarly, the expectations component fell to 7.4 (cons: 13.2, prior: 13.1), indicating that last month's uptick was temporary. It shall be very interesting to see whether PMIs and Ifo for November mirror this development as was the case in October when all measures improved. Overall, we remain negative on the economic outlook for Germany as the manufacturing sector continues to record falling activity. A clear risk for the growth outlook is a significant deterioration in the labour market, which is weakening as visible in Q3 where employment declined for the first time since Covid, and an increasing number of companies are using short-term working schemes.
On the political front, the leaders of Germany's major parties have agreed to host the snap elections on 23 February 2025. Later today, German Chancellor Scholz is expected to announce the date of a vote of confidence in the government, which likely could happen on 16 December. For more details regarding the political disarray in Germany, please see Research euro area: Fiscal policy to slow growth in 2025 - but mind the RFF, 7 November.
In the UK, BoE Chief Economist Huw Pill (hawk) emphasized that the central bank's efforts to tame inflation are not over, given persistent underlying inflation momentum. Pill highlighted Tuesday's labour market data, which showed continued sticky wage growth, underscoring that BoE still has work to do on inflation. The labour market report also showed the unemployment rate ticking higher to 4.3% in the most recent three-month period, slightly above consensus of 4.1% and the previous figure of 4.0%. However, this is related to the very low June figure of 3.7% dropping out in September. Given that the measure is also based on the low-quality LFS data, focus should be on wage growth. Looking ahead, next week's October inflation release is key, where we will likely see a slight increase due to energy price adjustments. We remain positive on GBP, targeting EUR/GBP at 0.81 in 6M.
In commodities space, OPEC lowered its forecast for global oil demand growth for 2024, while also trimming its 2025 projections, owing to weaker activity in China and other Asian markets. The cut marks the cartel's fourth consecutive downward revision in the 2024 outlook. For the remainder of 2024 we expect the oil price to climb higher towards USD80/bbl.
Equities: Global equities declined yesterday, led by significant selloffs in Europe and Asia. Some of the "Trump trades" are still ongoing, but as mentioned previously, also some China-related rotations are going on, with materials sectors experiencing the most significant losses across indices. Notably, despite the downturn in global equities, yields were higher, cyclicals outperformed, and the VIX moved slightly lower. This suggests that the market is not fearful of the growth outlook but is instead adjusting to a new reality. In the US yesterday: Dow -0.9%, S&P 500 -0.3%, Nasdaq -0.1%, and Russell 2000 -1.8%. Most Asian markets are lower this morning, as are most European and US futures.
FI: The US-German yield divergence continued to 206bp on the 10y point, which is 6bp wider than on Monday. European real rates rose markedly with e.g. the 5y5y EUR real swap rate up 6bp on the day.
FX: US yields continued to climb, diverging substantially from euro area rates and pushed EUR/USD temporarily below 1.06 for a new year-low. Scandies showed resilience versus the euro but lost out against the greenback. The Chinese yuan also weakened against the USD as an reflection of the anticipation of new US tariffs hitting China over the next year.
USD/CAD Daily Outlook
Daily Pivots: (S1) 1.3918; (P) 1.3943; (R1) 1.3969; More...
USD/CAD breached 1.3958 briefly but upside is capped below 1.3976 key resistance. Intraday bias stays neutral first. Further rise is is expected as long as 1.3822 support holds. On the upside, decisive break of 1.3976 key resistance will confirm larger up trend resumption. On the downside break of 1.3822 support will bring deeper pullback towards 55 D EMA (now at 1.3762).
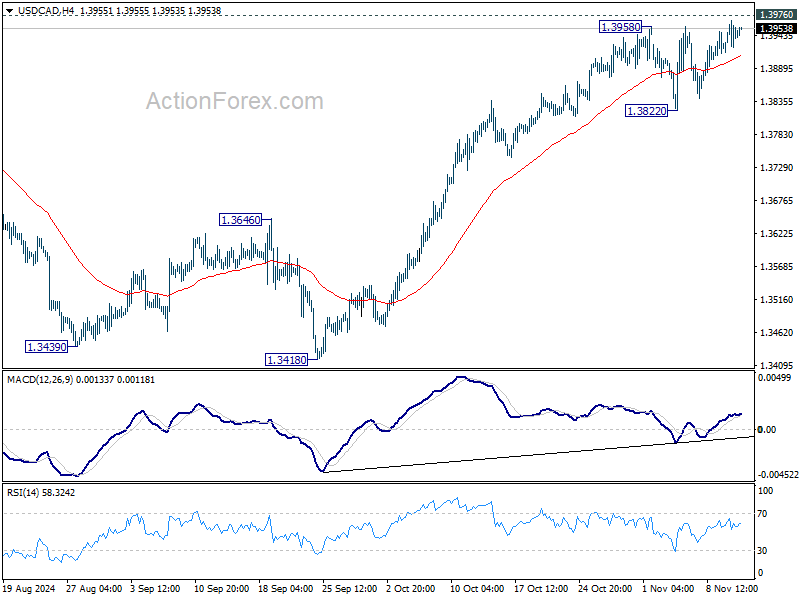
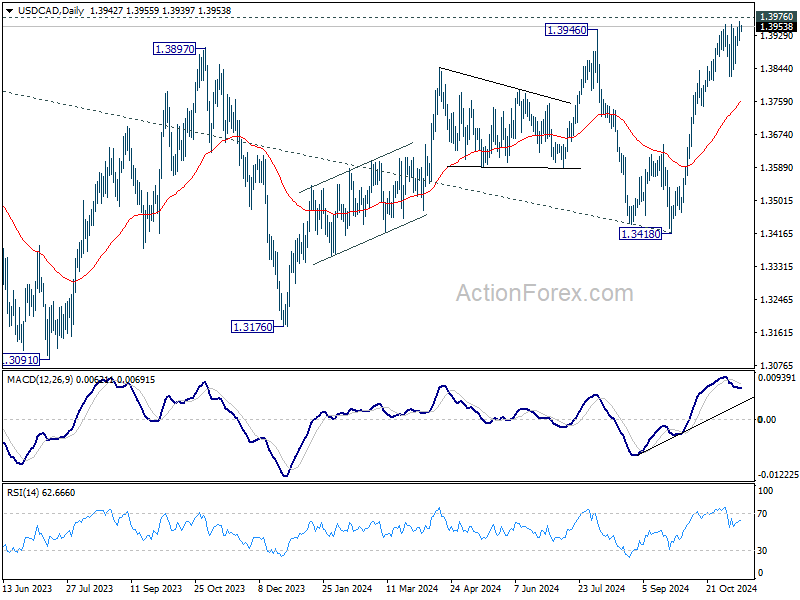
In the bigger picture, sideway consolidation pattern from 1.3976 (2022 high) might still extend further. While another decline cannot be ruled out, strong support should emerge above 1.2947 resistance turned support to bring rebound. Rise from 1.2005 (2021 low) is still in favor to resume at a later stage. Decisive break of 1.3976 will target 61.8% projection of 1.2401 to 1.3976 from 1.3418 at 1.4391.
Dollar Firm as CPI Likely to Confirm Disinflation Stalemate
The financial markets are intently focused today on US inflation data. Expectations are that both the headline CPI and core CPI remained unchanged in October from the previous month's readings of 2.4% and 3.3%, respectively.
This stagnation in disinflation supports the notion that bringing inflation back to Fed's 2% target may prove increasingly challenging in its final stages.
Adding to inflationary concerns are fiscal and trade policies from President-elect Donald Trump, which could create further upward pressure on prices in the coming year.
Such an outlook would likely prompt Fed to maintain cautious and gradual pace in lowering interest rates.
In currency markets, the Dollar has shown strength this week, holding its position as the top performer. However, it remains contained below last week’s highs against commodity currencies. In contrast, Yen is lagging, followed by Sterling and Euro, while Swiss Franc positions around the middle.
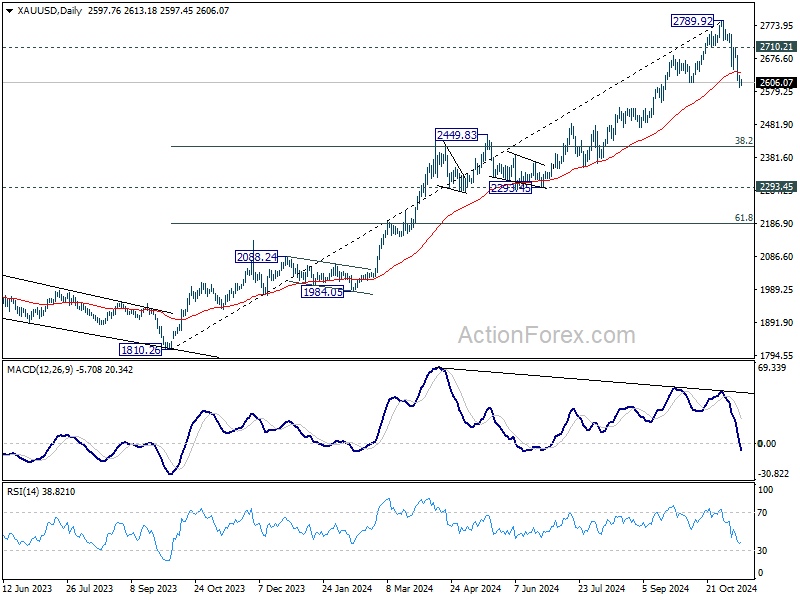
Technically, Gold's break of 55 D EMA strengthens the case that fall from 2789.92 is corrective the whole five-wave rally from 1810.26. Further decline is now expected as long as 2710.21 minor resistance holds. Next target is 38.2% retracement of 1810.26 to 2789.92 at 2415.68, which sits inside 2293.45/2449.83 support zone.
In Asia, at the time of writing, Nikkei is down -1.73%. Hong Kong HSI is down -0.99%. China Shanghai SSE is down -0.23%. Singapore Strait Times is up 0.14%. Overnight, DOW fell -0.86%. S&P 500 fell -0.29%. NASDAQ fell -0.09%. 10-year yield rose 0.125 to 4.432.
Barkin says Fed well-positioned to respond to economic changes
Richmond Fed President Thomas Barkin noted that the economy is "in a good place" and that Fed is now positioned to react flexibly to evolving economic conditions.
Speaking at an event overnight, Barkin highlighted that interest rates are balanced—elevated from recent lows but no longer at peak levels—providing Fed with room to adjust policy as needed.
Barkin observed that more price-sensitive consumer base is contributing to moderating inflation pressures, suggesting that demand adjustments are naturally aiding Fed's inflation objectives.
Additionally, he pointed to the resilience of the labor market, with companies retaining employees and maintaining lower turnover rates, which has provided stability and boosted productivity.
Fed's Kashkari highlights inflation as key factor for December rate decision
Minneapolis Fed President Neel Kashkari pointed to inflation as the primary driver that could influence Fed’s policy direction at its next meeting. He stated that any decision to pause rate cut would require an "inflation surprise" before then.
“If we saw inflation surprises to the upside between now and then, that might give us pause,” Kashkari said at an event, noting that significant changes in the labor market are less likely given the limited time before the December meeting.
Kashkari reiterated that while the US economy remains strong, inflation has yet to fully return to the 2% target. He emphasized that it could still take a year or two to achieve this target, particularly given the lingering effects of housing inflation, though he noted recent cooling in that area as “encouraging.”
On the broader outlook for monetary policy, Kashkari described the current stance as "modestly restrictive," suggesting that it is just slightly contractionary in effect. He acknowledged that the neutral rate remains uncertain but expected more clarity over the coming year as the Fed monitors the economy’s response to rate changes.
Japan’s PPI rises 3.4% yoy in Oct, highest since mid-2023
Japan’s PPI rose from 3.1% yoy to 3.4% yoy in October, surpassing market expectations of 3.0% and marking the highest annual increase since July 2023. On a monthly basis, PPI advanced by 0.2%, reflecting sustained inflationary pressure within Japan’s production sector.
The data also revealed a less pronounced decline in Yen-based import prices, down -2.2% yoy compared to a -2.5% drop in September, signaling that import costs may be stabilizing. This relative improvement aligns with a 4.3% mom increase in Yen's exchange rate. However, on a monthly scale, import prices saw a notable 3.0% rise after a -2.8% decrease in September.
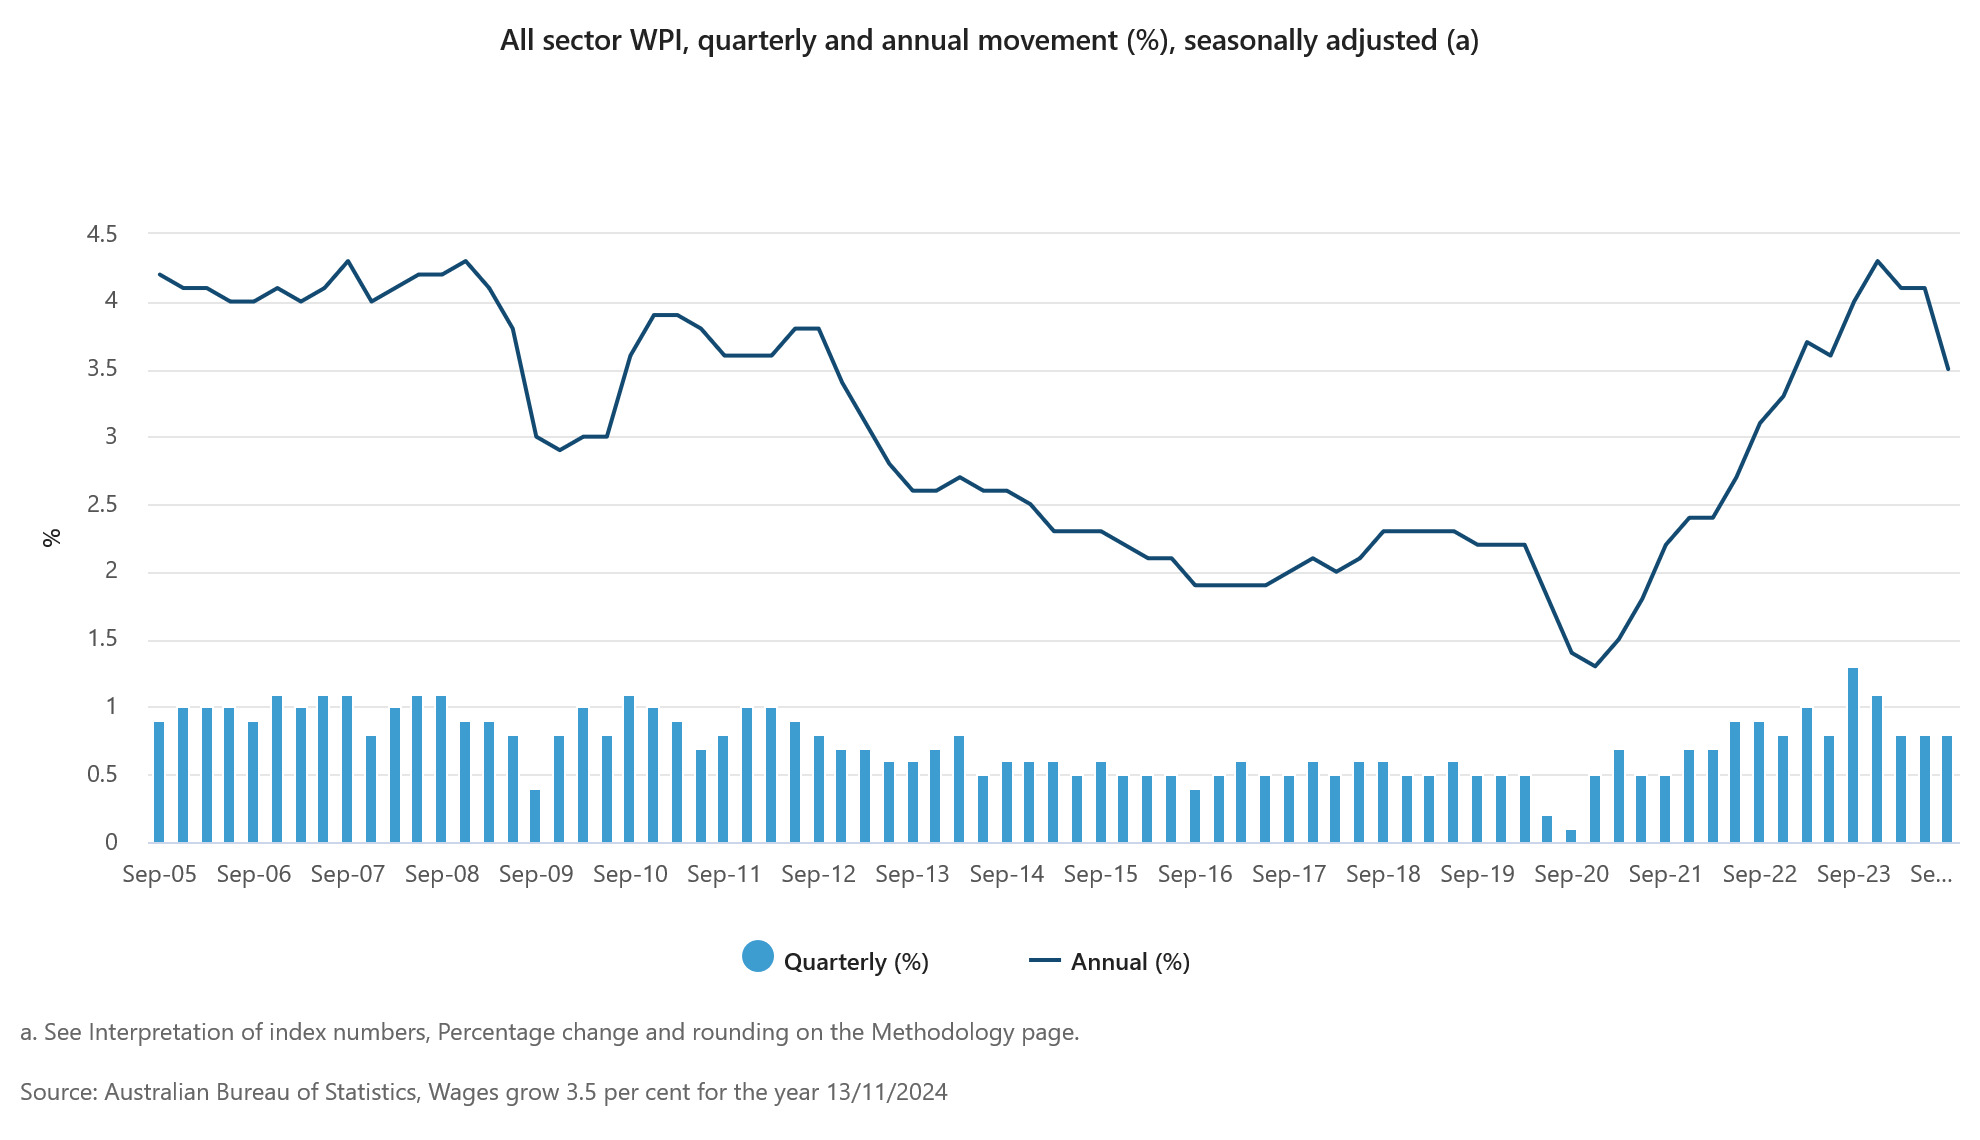
Australia's wage growth slows as public sector outpaces private for first time since 2020
Australia's wage growth softened in Q3, with the Wage Price Index rising by 0.8% qoq, slightly missing the forecast of 0.9%. On an annual basis, wage growth slowed from 4.1% yoy to 3.5% yoy, falling short of the expected 3.6% yoy and marking the lowest annual increase since Q4 2022. This deceleration follows four consecutive quarters of 4% or higher wage growth, pointing to easing in wage-driven inflation pressures.
For the first time since late 2020, public sector wage growth surpassed that of the private sector. Public sector wages rose by 3.7% yoy, higher than the 3.5% yoy recorded in the same quarter last year but down from the recent high of 4.2% yoy in Q4 2023, lowest since Q3 2022.
USD/CAD Daily Outlook
Daily Pivots: (S1) 1.3918; (P) 1.3943; (R1) 1.3969; More...
USD/CAD breached 1.3958 briefly but upside is capped below 1.3976 key resistance. Intraday bias stays neutral first. Further rise is is expected as long as 1.3822 support holds. On the upside, decisive break of 1.3976 key resistance will confirm larger up trend resumption. On the downside break of 1.3822 support will bring deeper pullback towards 55 D EMA (now at 1.3762).
In the bigger picture, sideway consolidation pattern from 1.3976 (2022 high) might still extend further. While another decline cannot be ruled out, strong support should emerge above 1.2947 resistance turned support to bring rebound. Rise from 1.2005 (2021 low) is still in favor to resume at a later stage. Decisive break of 1.3976 will target 61.8% projection of 1.2401 to 1.3976 from 1.3418 at 1.4391.
Gold Faces a Setback: Can It Rebound Soon?
Key Highlights
- Gold started a sharp downside correction below the $2,665 support.
- A connecting bearish trend line is forming with resistance at $2,670 on the 4-hour chart.
- Bitcoin traded to a new high at $89,998 on TitanFX before it saw a pullback.
- The US CPI could rise 2.6% in Oct 2024 (YoY), up from 2.4%.
Gold Price Technical Analysis
Gold prices struggled above $2,775 against the US Dollar. The price started a fresh decline and traded below the $2,720 and $2,700 support levels.
The 4-hour chart of XAU/USD indicates that the price declined below the $2,665 support, the 100 Simple Moving Average (red, 4 hours), and the 200 Simple Moving Average (green, 4 hours).
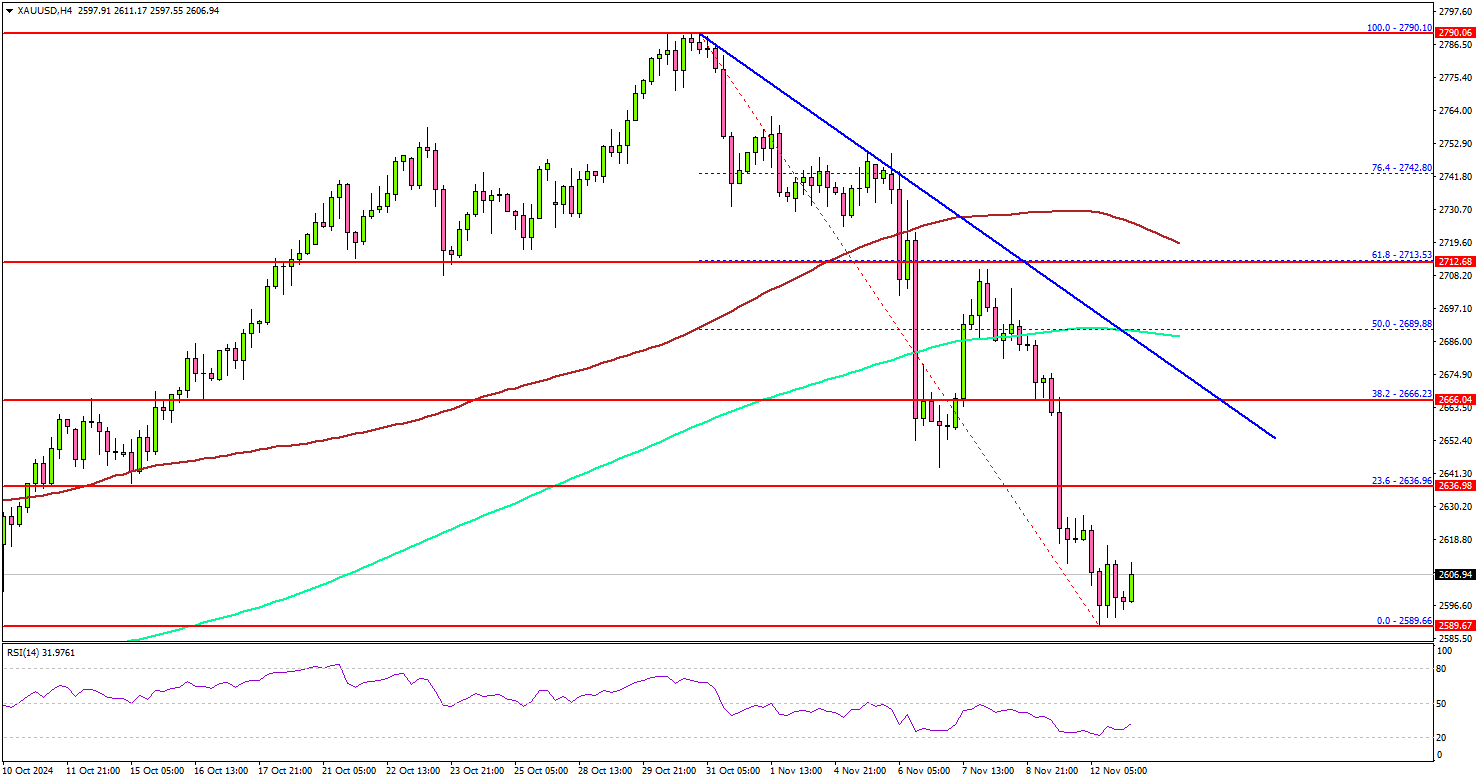
The decline even gained pace below $2,620. Finally, the price tested the $2,590 zone before it started a consolidation phase. On the downside, initial support is near the $2,590. The first major support is near the $2,580 level.
The main support is now $2,550. A downside break below the $2,550 support might call for more downsides. The next major support is near the $2,525 level.
On the upside, immediate resistance is near the $2,635 level or the 23.6% Fib retracement level of the downward move from the $2,790 swing high to the $2,589 low. The first major resistance sits near the $2,665 level.
There is also a connecting bearish trend line forming with resistance at $2,670 on the same chart. A clear move above the $2,670 resistance could open the doors for more upsides. The next major resistance could be $2,700, above which the price could rally toward the $2,720 level.
Looking at Bitcoin, the price gained pace for a move above the $88,500 level before it saw a short-term rejection near $90,000.
Economic Releases to Watch Today
- US Consumer Price Index for Oct 2024 (MoM) – Forecast +0.2%, versus +0.2% previous.
- US Consumer Price Index for Oct 2024 (YoY) – Forecast +2.6%, versus +2.4% previous.
- US Consumer Price Index Ex Food & Energy for Oct 2024 (YoY) – Forecast +3.3%, versus +3.3% previous.
Australia’s wage growth slows as public sector outpaces private for first time since 2020
Australia's wage growth softened in Q3, with the Wage Price Index rising by 0.8% qoq, slightly missing the forecast of 0.9%. On an annual basis, wage growth slowed from 4.1% yoy to 3.5% yoy, falling short of the expected 3.6% yoy and marking the lowest annual increase since Q4 2022. This deceleration follows four consecutive quarters of 4% or higher wage growth, pointing to easing in wage-driven inflation pressures.
For the first time since late 2020, public sector wage growth surpassed that of the private sector. Public sector wages rose by 3.7% yoy, higher than the 3.5% yoy recorded in the same quarter last year but down from the recent high of 4.2% yoy in Q4 2023, lowest since Q3 2022.
Japan’s PPI rises 3.4% yoy in Oct, highest since mid-2023
Japan’s PPI rose from 3.1% yoy to 3.4% yoy in October, surpassing market expectations of 3.0% and marking the highest annual increase since July 2023. On a monthly basis, PPI advanced by 0.2%, reflecting sustained inflationary pressure within Japan’s production sector.
The data also revealed a less pronounced decline in Yen-based import prices, down -2.2% yoy compared to a -2.5% drop in September, signaling that import costs may be stabilizing. This relative improvement aligns with a 4.3% mom increase in Yen's exchange rate. However, on a monthly scale, import prices saw a notable 3.0% rise after a -2.8% decrease in September.
Fed’s Kashkari highlights inflation as key factor for December rate decision
Minneapolis Fed President Neel Kashkari pointed to inflation as the primary driver that could influence Fed’s policy direction at its next meeting. He stated that any decision to pause rate cut would require an "inflation surprise" before then.
“If we saw inflation surprises to the upside between now and then, that might give us pause,” Kashkari said at an event, noting that significant changes in the labor market are less likely given the limited time before the December meeting.
Kashkari reiterated that while the US economy remains strong, inflation has yet to fully return to the 2% target. He emphasized that it could still take a year or two to achieve this target, particularly given the lingering effects of housing inflation, though he noted recent cooling in that area as “encouraging.”
On the broader outlook for monetary policy, Kashkari described the current stance as "modestly restrictive," suggesting that it is just slightly contractionary in effect. He acknowledged that the neutral rate remains uncertain but expected more clarity over the coming year as the Fed monitors the economy’s response to rate changes.
Barkin says Fed well-positioned to respond to economic changes
Richmond Fed President Thomas Barkin noted that the economy is "in a good place" and that Fed is now positioned to react flexibly to evolving economic conditions.
Speaking at an event overnight, Barkin highlighted that interest rates are balanced—elevated from recent lows but no longer at peak levels—providing Fed with room to adjust policy as needed.
Barkin observed that more price-sensitive consumer base is contributing to moderating inflation pressures, suggesting that demand adjustments are naturally aiding Fed's inflation objectives.
Additionally, he pointed to the resilience of the labor market, with companies retaining employees and maintaining lower turnover rates, which has provided stability and boosted productivity.
Australia: Wage Inflation Moderating as Expected
First Impressions: The WPI rose 0.8% in the September quarter, on par with Westpac’s forecast and below the market consensus of 0.9%. The market range was from 0.8% to 1.0%. On an annual basis, wages are up 3.5%yr, down from 4.1%yr in June and the peak of 4.2%yr in December 2023. Wage inflation has continued to moderate through 2024, with the six-month annualised pace holding at 3.2%yr compared to 4.9%yr in December 2023. There are no changes to Westpac’s wage forecasts.
In the September quarter, the Wage Price Index (WPI) rose 0.8% (3.5%yr), on par with Westpac’s forecast but a touch softer than the market consensus of 0.9%. It is also below the RBA’s expectation which pointed to a 0.9%qtr rise in both the September and December quarters of 2024. Wage inflation peaked at 4.3%yr in December 2023 and has been drifting lower through 2024, with the six-month annualised pace dropping from 4.9%yr in December 2023 to 3.2%yr in September 2024.
The more critical private sector wages rose 0.8% and this time, was also matched by a 0.8% increase in public sector wages.
The ABS provides (in non-seasonally adjusted terms) the contributions to the quarterly increase in the WPI from Awards, Enterprise Bargaining and Individual Arrangements. Comparing September 2024 to September 2023, the contribution from Enterprise Bargaining has softened to a contribution of 0.46ppt compared to 0.66ppt a year earlier. Individual Arrangements continue their downtrend, contributing 0.59ppt compared to a September 2023 print of 0.74ppt. Meanwhile, the Awards/Minimum Wage contribution was just 0.36ppt compared to 0.63ppt a year earlier.
As the Wage Price Index came in just as Westpac expected, we see no reason to change our end 2024 forecast of 3.2%yr and the June 2025 forecast of 2.9%yr. The RBA is currently forecasting annual wages growth to print 3.4%yr for end 2024 and hold at that rate through to June 2025.