Sample Category Title
ECB’s Wunsch: Soft landing likely, no immediate need to accelerate rate cuts
In an interview with Reuters, Belgian ECB Governing Council member Pierre Wunsch emphasized the importance of patience regarding monetary policy adjustments, pointing to strong employment figures and rising real wages as signals of economic resilience.
Wunsch remarked that with the economy likely headed for a "soft landing," there is “no urgency in further accelerating the easing of monetary policy.”
Wunsch downplayed temporary inflation undershooting, and warned against "overdramatize such an event". He added, "Being a bit below 2% is not a big event if the medium term continues to point to 2%," especially if driven by a favorable terms of trade shock.
Wunsch further cautioned against making premature decisions ahead of December’s ECB meeting, noting that several high-stakes developments are expected in the coming weeks.
"We’ll have so much information until then, including two more inflation readings and new staff projections," he said. "There will be a U.S. election, and we also need to see how the conflict in the Middle East develops, so discussing precise levels is premature."
EUR/USD Weakens Amid Global Economic Uncertainty and Strong US Dollar
The EUR/USD pair began the week around 1.0789, reflecting heightened global economic uncertainties and a strong inclination towards safe-haven assets. The appeal of the US dollar is bolstered by rising US government bond yields and positive consumer confidence indicators from the University of Michigan, which reported a rise to 70.5 points in October, surpassing expectations.
The preference for the US dollar as a safe haven was notably evident over the weekend during Japan's general election, underscoring the currency's reliability in times of political and economic uncertainty.
Looking ahead, the EUR/USD pair faces a critical week with upcoming releases of October's labor market data from the US. These figures are crucial as they could influence the Federal Reserve's cautious stance on interest rate adjustments. Current market expectations lean towards two rate cuts by the end of the year, each by 25 basis points. However, upcoming employment data could potentially recalibrate these expectations, impacting the EUR/USD trajectory.
Technical Analysis of EUR/USD
H4 Chart Analysis: The EUR/USD has recently completed an upward wave reaching towards 1.0838 and is now undergoing a correction towards 1.0780. Should this correction complete, anticipation for a new growth wave towards 1.0850 will increase, potentially leading to the formation of a consolidation range around this level. A break above this range could extend the upward momentum towards 1.0944. The MACD indicator supports this potential, with its signal line positioned below zero but pointing upwards, suggesting an impending positive shift in momentum.
H1 Chart Analysis: On the hourly chart, the EUR/USD has stretched a growth structure to 1.0838 and is currently correcting towards 1.0780. Once this correction target is met, a new upward movement is expected to commence towards 1.0815, with potential to continue towards 1.0850. This forecast is backed by the Stochastic oscillator, whose signal line is rising from above 20 towards 80, indicating the likelihood of continued upward price action.
EUR/USD Daily Outlook
Daily Pivots: (S1) 1.0780; (P) 1.0809; (R1) 1.0826; More...
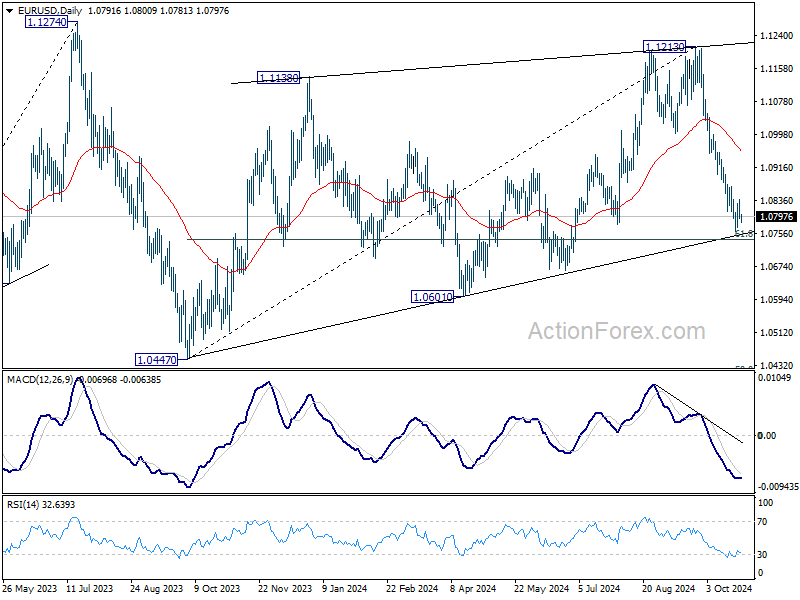
Intraday bias in EUR/USD remains neutral and more consolidations could be seen above 1.0760 temporary low. Further decline is expected as long as 1.0871 resistance holds. Below 1.0760 will target 61.8% retracement of 1.0447 to 1.1213 at 1.0740. Firm break there will target 1.0601 support next. However, considering bullish convergence condition in 4H MACD, break of 1.0871 will indicate short term bottoming, and turn bias back to the upside for 55 D EMA (now at 1.0956).
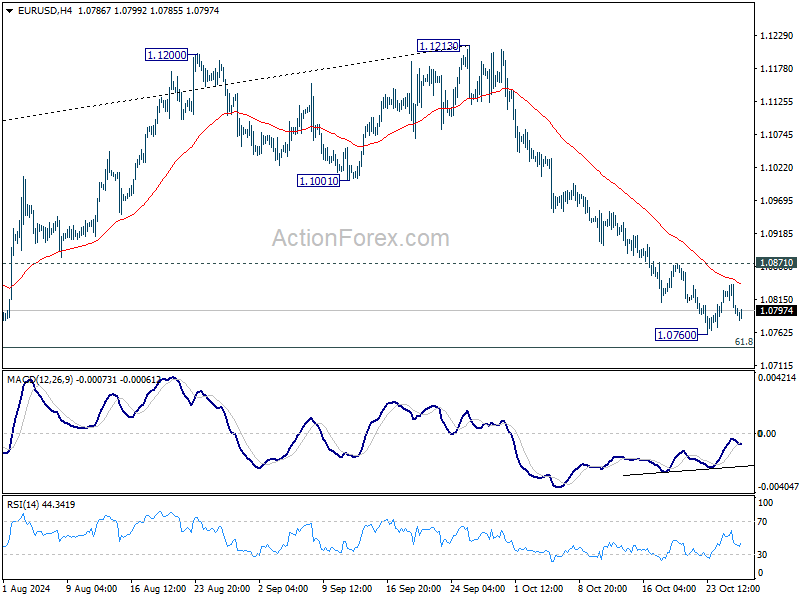
In the bigger picture, price actions from 1.1274 (2023 high) are seen as a consolidation pattern to up trend from 0.9534 (2022 low), with fall from 1.1213 as the third leg. Downside should be contained by 50% retracement of 0.9534 (2022 low) to 1.1274 at 1.0404, to bring up trend resumption at a later stage.
USD/JPY Daily Outlook
Daily Pivots: (S1) 151.68; (P) 152.03; (R1) 152.62; More...
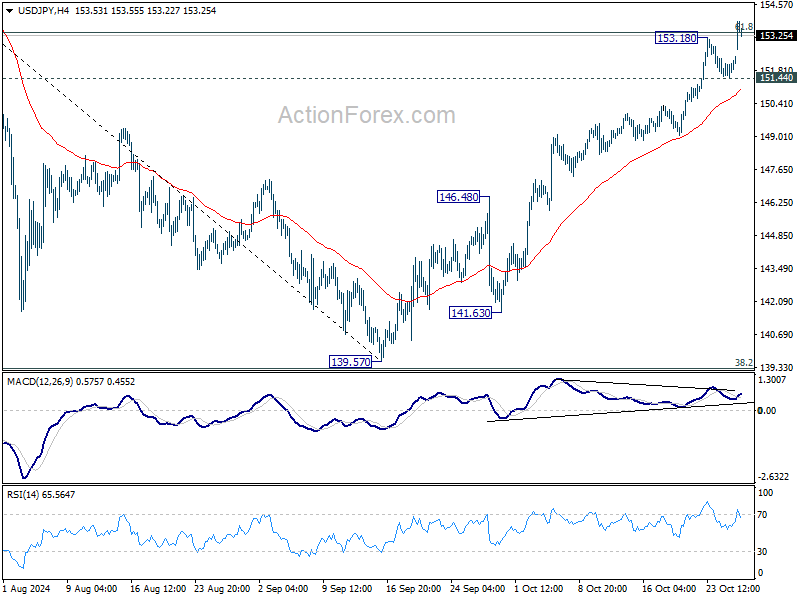
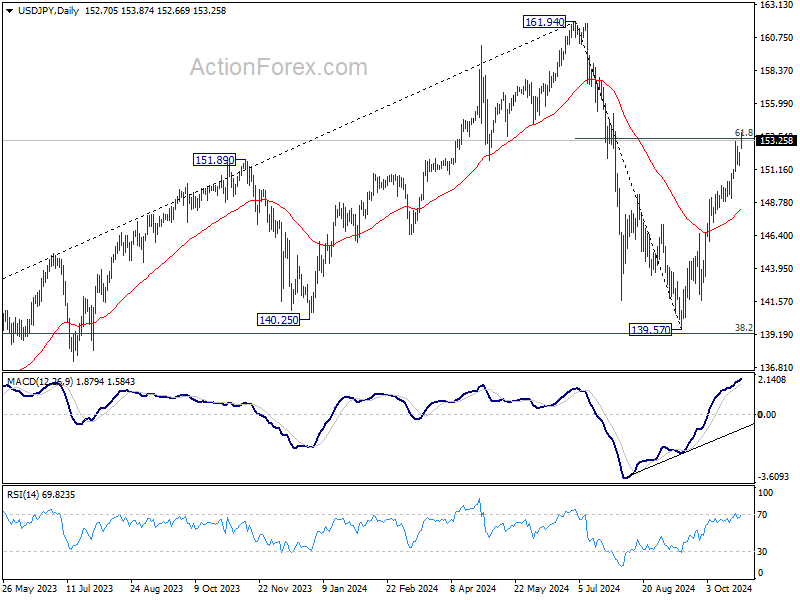
USD/JPY's rally from 139.57 resumed after brief consolidations and intraday bias is back on the upside. Sustained trading above 61.8% retracement of 161.94 to 139.57 at 153.39 will pave the way to retest 161.94 high. On the downside, below 151.44 minor support will turn intraday bias neutral again first.
In the bigger picture, price actions from 161.94 are seen as a corrective pattern to rise from 102.58 (2021 low). The range of medium term consolidation should be set between 38.2% retracement of 102.58 to 161.94 at 139.26 and 161.94. Nevertheless, sustained break of 139.26 would open up deeper medium term decline to 61.8% retracement at 125.25.
GBP/USD Daily Outlook
Daily Pivots: (S1) 1.2946; (P) 1.2972; (R1) 1.2989; More...
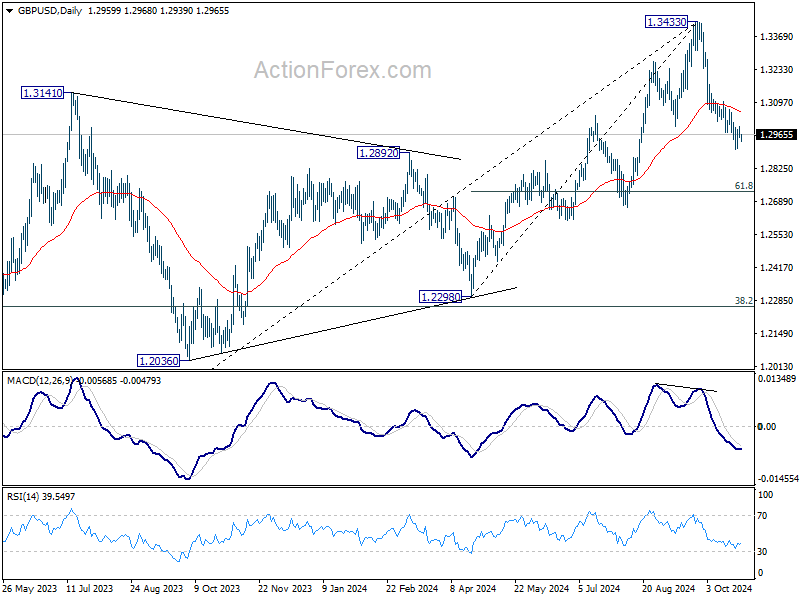
Intraday bias in GBP/USD remains neutral for the moment and some more consolidations could be seen above 1.2906 temporary low. Further decline is expected as long as 1.3070 minor resistance holds. Below 1.2906 will target 61.8% retracement of 1.2298 to 1.3433 at 1.2732. However, considering bearish divergence condition in 4H MACD, firm break 1.3070 resistance will indicate short term bottoming, and turn bias back to the upside for stronger rebound.
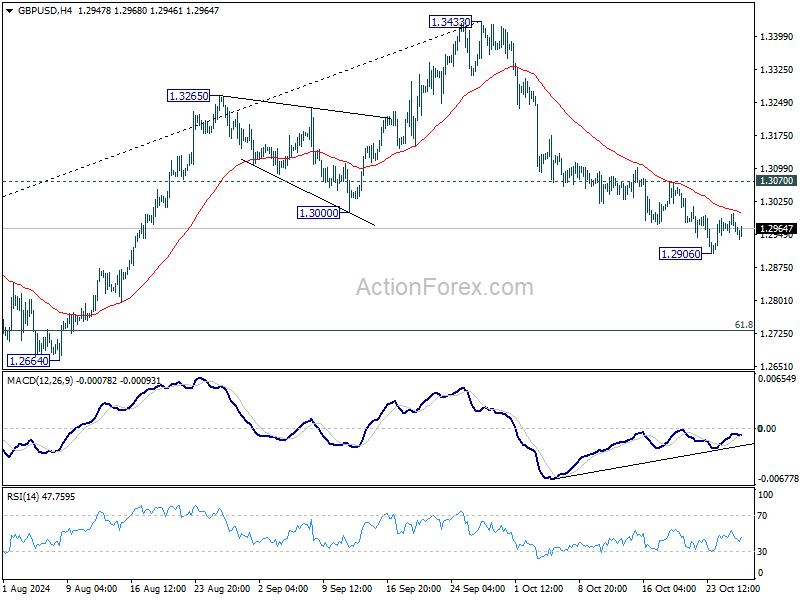
In the bigger picture, considering mildly bearish divergence condition in D MACD, a medium term top is likely in place at 1.3433 already. Price actions from there are seen as correction to whole up trend from 1.0351 (2022 low). Deeper decline would be seen to 38.2% retracement of 1.0351 to 1.3433 at 1.2256, which is close to 1.2298 structural support. Strong support should be seen there to bring rebound.
USD/CHF Daily Outlook
Daily Pivots: (S1) 0.8652; (P) 0.8664; (R1) 0.8679; More…
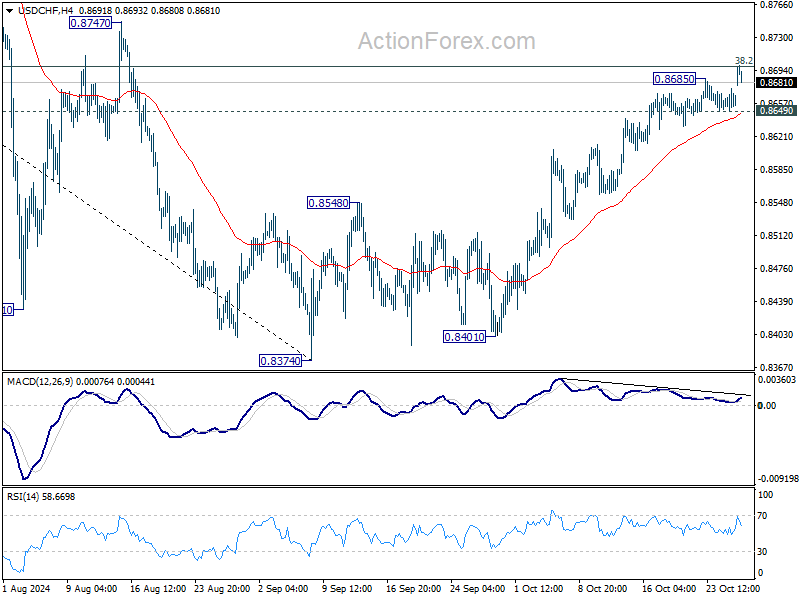
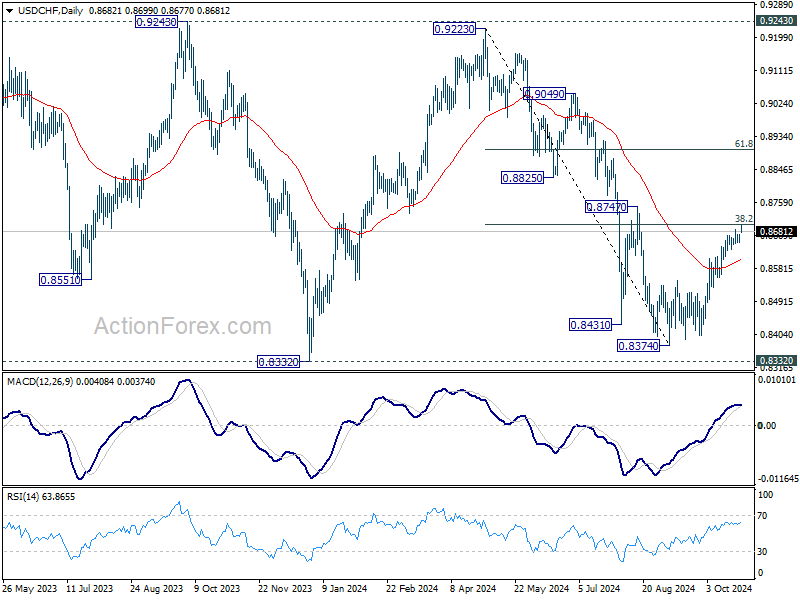
USD/CHF's rally from 0.8374 resumed after brief consolidations, and intraday bias is back on the upside. Decisive break of 38.2% retracement of 0.9223 to 0.8374 at 0.8698 will argue that fall from 0.9223 has completed after defending 0.8332 low. Further rally should then be seen to 61.8% retracement at 0.8899 next. On the downside, below 0.8649 minor support will turn intraday bias neutral again first.
In the bigger picture, price actions from 0.8332 (2023 low) are currently seen as a medium term corrective pattern, with fall from 0.9223 as the second leg. Strong support could be seen from 0.8332 to bring rebound. Yet, overall outlook will continue to stay bearish as long as 0.9243 resistance holds. Firm break of 0.8332, however, will resume larger down trend from 1.0146 (2022 high).
Yen Extends Losses This Morning
Markets
Core bond yields ended the week higher. German bond yields added between 1.2 (30-yr) and 4 bps (2-yr). Bunds initially underperformed US Treasuries before the latter suffered from a late-session swoon. US yields swapped earlier losses for gains varying between 2.6 and 3.2 bps across the curve. The US dollar held the upper hand against all G10 peers. EUR/USD tried but failed to extend Thursday’s gains. European PMI’s not delivering a September-like disappointment was a weak base to rally on anyway. The couple returned from intraday highs around 1.084 to back below 1.08. The trade-weighted dollar index finished north of 104 after all. A nervous JPY going into the Sunday elections prevented USD/JPY from dropping below the 200dMA around 151.45. The yen extends losses this morning after the ruling LDP and its much smaller coalition party lost their majority in what is considered a bigger blow than expected to premier Ishiba’s party. Ishiba and the LDP will be exploring their options, potentially teaming up with a party that’s pursuing expansionary fiscal policies - in coming weeks. Not that it needed one, but the extra layer of political uncertainty is an additional argument for the Bank of Japan to stand pat at Thursday’s policy meeting. That’s just one of the key events featuring the massive eco calendar this week though. Today starts off quiet, paving the way for a technical extension to the so-called Trump trade (higher USD, US rates) as the odds increasingly turn into the favour of the former president. The US publishes the first estimate of third-quarter GDP growth as well as quarterly PCE inflation numbers on Wednesday. Estimates are for a solid Q2-matching 3% q/q (annualized). Key US labour market data include JOLTS job numbers on Tuesday and (hurricane-affected) October payrolls on Friday. Spotlights are also on Europe with GDP growth released on Wednesday. The economy may have fared better than the dire Q3 PMI readings suggested (0.2% vs flat). Hard data lately often deviated from soft indicators. October inflation most likely picked up again in the EMU. Base effects will make it clear that the current 2% undershoot is temporary at least through the end of the year. UK Chancellor Reeves will present the Budget to parliament on Wednesday. Investors are on high alert after she altered the definition of “debt” to create additional budgetary headroom. The earnings season meanwhile also gains traction: Apple, Amazon, Intel, Microsoft, Meta Platforms, Alphabet and many others report.
News & Views
Rating agency S&P affirmed the Belgian AA rating with a stable outlook last Friday after market close. The stable outlook balances risks from comparatively large budget deficits and increasing general government debt against the potential for stronger economic growth and improvement in Belgium's already-solid external position. S&P is on the optimistic side of the aisle in forecasting that the budget deficit will gradually narrow to 3.4% of GDP in 2027 from 4.2% last year. The government debt ratio stays slightly below a high 100% of GDP through 2027 in such scenario. They add the disclaimer that failure to reduce these larges deficits and debt ratio could prompt a rating downgrade. Political fragmentation will likely complicate the next government’s implementation of economic and budgetary reforms. S&P forecasts Belgium's annual real economic growth to average 1.3% in 2024-2027 on robust consumption and investment activity, and faster European economic growth from 2025. Earlier this month, rating agency Moody’s switched the outlook on the Belgian Aa3 rating from stable to negative. Fitch is expected to resolve its negative outlook on Belgium’s AA- rating (in place since early 2023) at the beginning of next year with a significant risk of a first ever downgrade from the AA into the A category.
The Bulgarian centre-right Gerb party of former PM Borissov remains the biggest in the nations seventh parliamentary election since 2021. The party gained again around 25% of the vote and needs at least two coalition partners to form a government. This risks again being complicated as number two in the polls ran on an anti-corruption platform (anti-Gerb) and number three is the only party Borissov specifically rules out to work together with (pro-Russia, anti-Nato). Borissov was firmly in power in the decade running up to anti-graft protests against him and his party which kickstarted the political stalemate of the past three years resulting in delays to euro-adoption plans and freezing billions of EU aid.
US Jobs Report and Inflation in Focus This Week
In focus this week
Today will be quiet on the data front, with no major releases scheduled
This week is expected to be calm before the storm of the US election. On Tuesday we will have the JOLTs report and the consumer confidence from the US Conference Board. On Wednesday, we receive preliminary estimate of GDP growth for Q3 for both the US and euro area. Thursday, we will receive euro area HICP inflation for October and September unemployment rate. Friday, we will receive job market reports from the US including non-farm payrolls for October. We also get the Swiss CPI.
Economic and market news
What happened during the weekend
In Japan, the ruling coalition lost its Lower House majority at an election yesterday as it lost 64 of its 279 seats in the 465 large House and thus comes 18 seats short. There are no real grounds for a government not including the Liberal Democratic party. That said, the election result implies a lot of political uncertainty, which is also reflected in financial markets. USD/JPY has traded back to the highest levels since July and long-dated JGB yields have increased a couple of basis points. It is also worth noting that the Democratic Party for The People and the Innovation Party, who could now be key to form a government, have both been critical of BoJ hikes. We will keep a close eye on the political negotiations this week.
In the Middle East, Israel retaliated the attacked carried out by Iran on 1 October, striking military sites early Saturday. Israel said it achieved its objective, while Iran said that damages were limited. In early trading Monday, the Brent oil price dropped to around 72.6 USD/barrel.
What happened on Friday
In France, Moody's changed their outlook on France from stable to negative on the back of the fiscal problems. There is a clear risk of the downgrade if the country were to announce a "medium-term fiscal strategy that fails to reverse adverse fiscal trends or lacks credibility about its effective implementation." France has a minority government and the budget for 2025 has not yet been approved.
In Germany, the Ifo index rose more than expected in October like the PMIs yesterday. The assessment of the current situation rose to 85.7 (cons: 84.4) from 84.4 while the expectations component to rose 87.3 (cons:86.9) from 86.4. While the overall level of the index is still low it gives some relief to the German outlook as the PMI survey showed the same development yesterday. The October data gives tentative hopes of a bottoming in activity, but we remain cautious of becoming too optimistic as it is just one month of data.
In the euro area, credit growth continued to rebound with lending to companies up by 1.1% in September, which is the highest rate since mid-2023. Lending to households was up by 0.7% which is the highest level since October 2023. Money supply as measured by M3 increased more than expected to 3.2% (cons: 3%, prior: 2.9%).
Equities: Global equities were lower on Friday and declined last week by more than 1% (down 4 out of 5 days). More notably, cyclicals continued to outperform and the VIX drifted higher, ending north of 20. The primary drivers last week were micro data, particularly the results from Tesla, which propelled the auto sector to the top of the performance table in the US. It is important to note the lack of spill-over to Europe and the very company-specific outlook in that sector. The increase in implied volatility was not so much a result of micro and macro data but rather due to the impending US election. In the US on Friday, the Dow fell by 0.6%, the S&P 500 by 0.03%, the Nasdaq rose by 0.6%, and the Russell 2000 by 0.5%. This morning, we have a mixed picture in Asia, with Japanese stocks climbing as the yen weakened following the LDP coalition defeat. US and European futures starting the week on a stronger note.
FI: The sell-off continued in the US bond market on Friday, where 2Y yields climbed some 6bp from the lows on Friday, while 10Y yields climbed 5-6bp. This morning US yields have also risen in Asian trading hours. The sell-off has mainly been driven by the possibility of a Trump victory and this week we will get the quarterly refunding statement from the US Treasury, which could add pressure to US government bonds. On top of this there is also a string of US economic data.
FX: NOK rose together with GBP, USD and EUR on Friday in an otherwise quiet end to the week. The sell-off in EUR/USD started to meet some near-term resistance around the 1.08 level. EUR/SEK rose to the highest level since September close to 11.50. EUR/NOK held steady around 11.84.
AUD/USD Daily Report
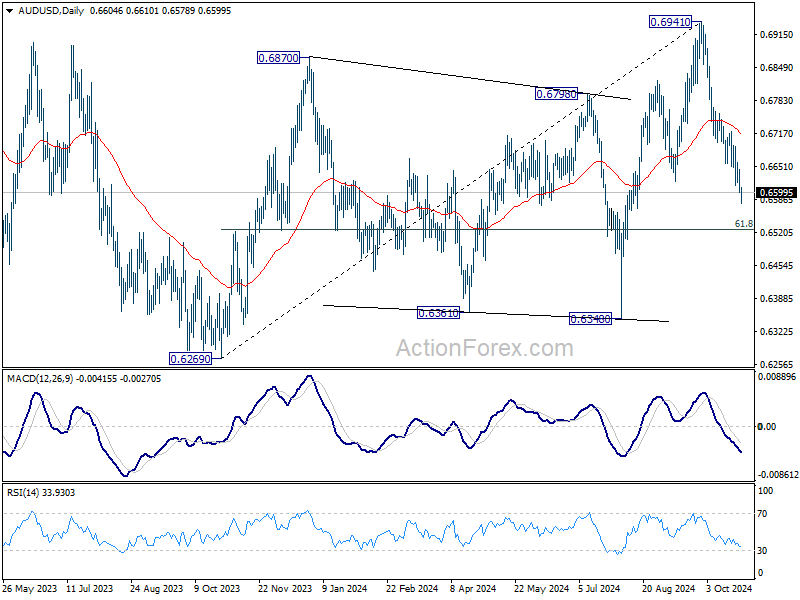
Daily Pivots: (S1) 0.6588; (P) 0.6617; (R1) 0.6634; More...
Intraday bias in AUD/USD remains on the downside for the moment. Fall from 0.6941 is in progress for 61.8% retracement of 0.6269 to 0.6941 at 0.6526. Sustained break there will target 0.6348 support next. On the upside, above 0.6660 minor resistance will turn intraday bias neutral and bring consolidations first.
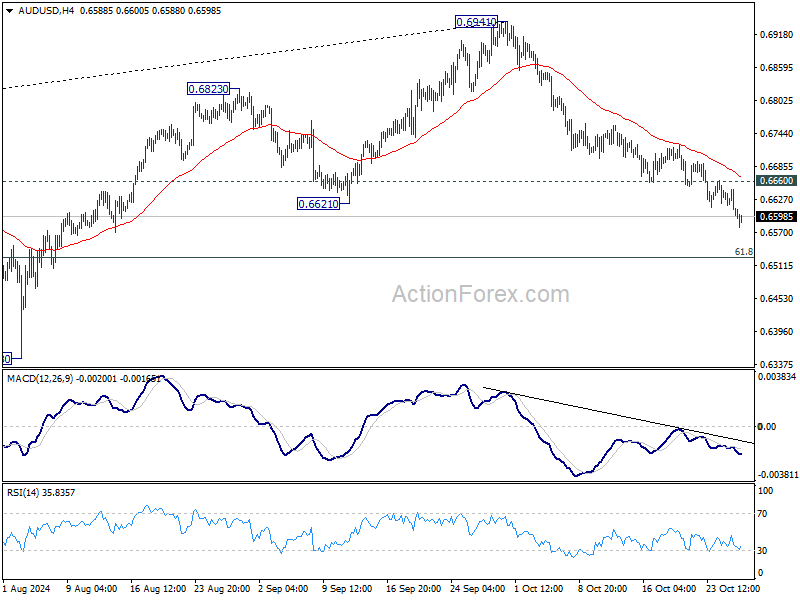
In the bigger picture, rise from 0.6269 (2023 low) should have completed with three waves up to 0.6941. Corrective pattern from 0.6169 (2022 low) is now extending with another falling leg. Deeper decline would be seen back to 0.6269 as sideway trading extends.
USD/CAD Daily Outlook
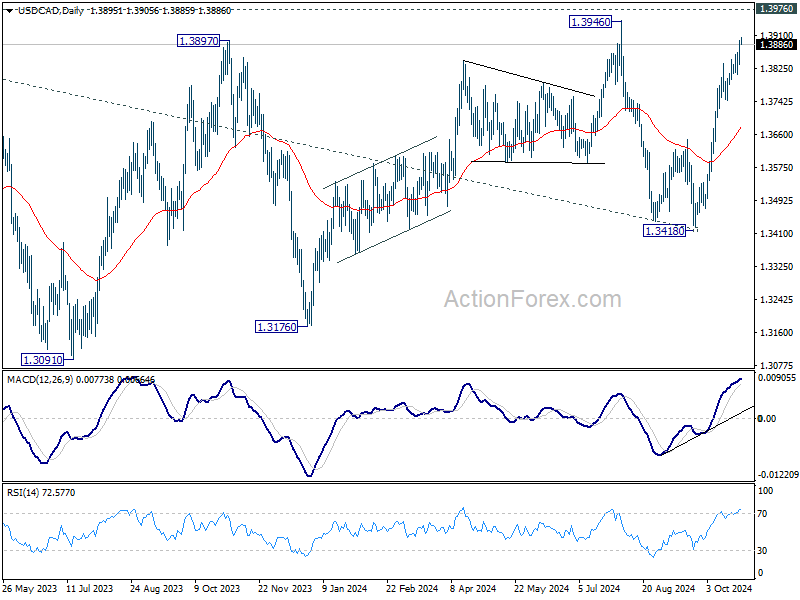
Daily Pivots: (S1) 1.3854; (P) 1.3876; (R1) 1.3914; More...
USD/CAD's rise from 1.3418 is in progress and intraday bias stays on the upside for retesting 1.3946/76 resistance zone. Decisive break there will confirm larger up trend resumption. On the downside, below 1.3837 minor support will turn intraday bias and bring consolidations first.
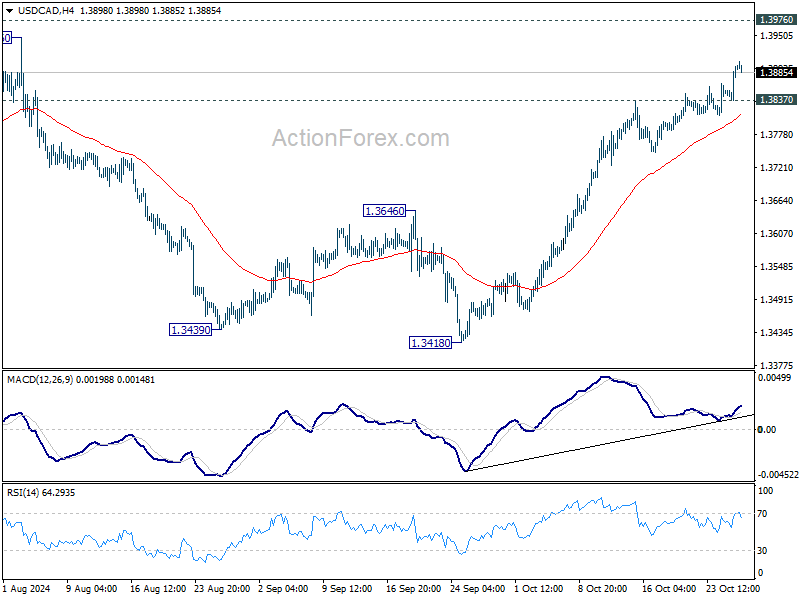
In the bigger picture, sideway consolidation pattern from 1.3976 (2022 high) might still extend further. While another decline cannot be ruled out, strong support should emerge above 1.2947 resistance turned support to bring rebound. Rise from 1.2005 (2021 low) is still in favor to resume at a later stage. Decisive break of 1.3976 will target 61.8% projection of 1.2401 to 1.3976 from 1.3418 at 1.4391.