
Sample Category Title
GBP/JPY Weekly Outlook
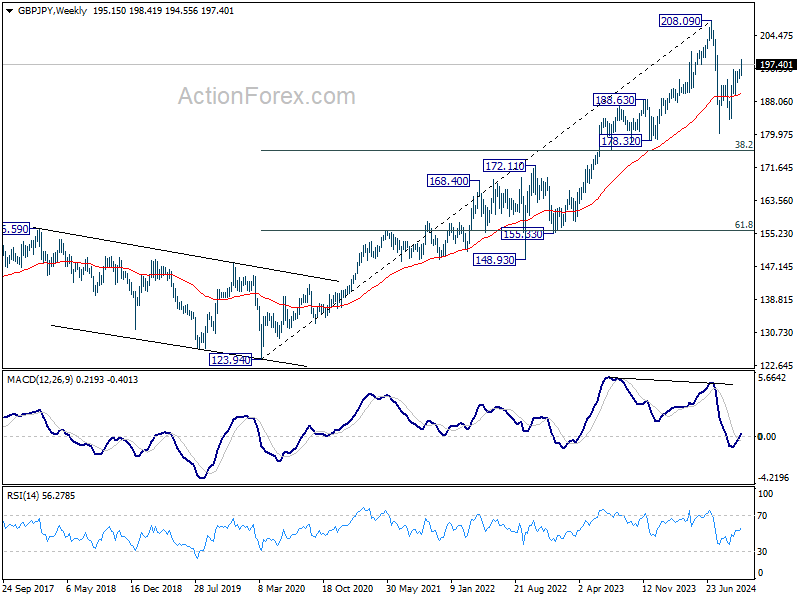
GBP/JPY's rise from 180.00 resumed last week but formed a temporary top at 198.41. Initial bias remains neutral this week for consolidations first. Further rally is expected as long as 193.69 support holds. On the upside, sustained trading above 61.8% retracement of 208.09 to 180.00 at 197.35 will target 208.09 high next.

In the bigger picture, price actions from 208.09 are seen as a correction to whole rally from 123.94 (2020 low). The range of consolidation should be set between 38.2% retracement of 123.94 to 208.09 at 175.94 and 208.09. However, decisive break of 175.94 will argue that deeper correction is underway.
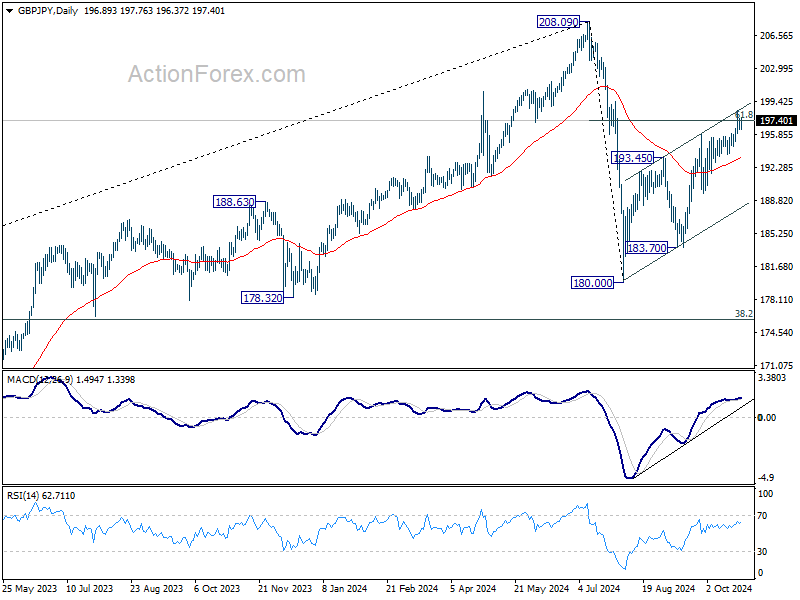
In the longer term picture, considering bearish divergence condition in W MACD, 208.09 is at least a medium term top. It's still early to conclude that the up trend from 122.75 (2016 low) has completed. But it's at least in a medium term corrective phase, with risk of correction to 55 M EMA (now at 171.17).

EUR/JPY Weekly Outlook
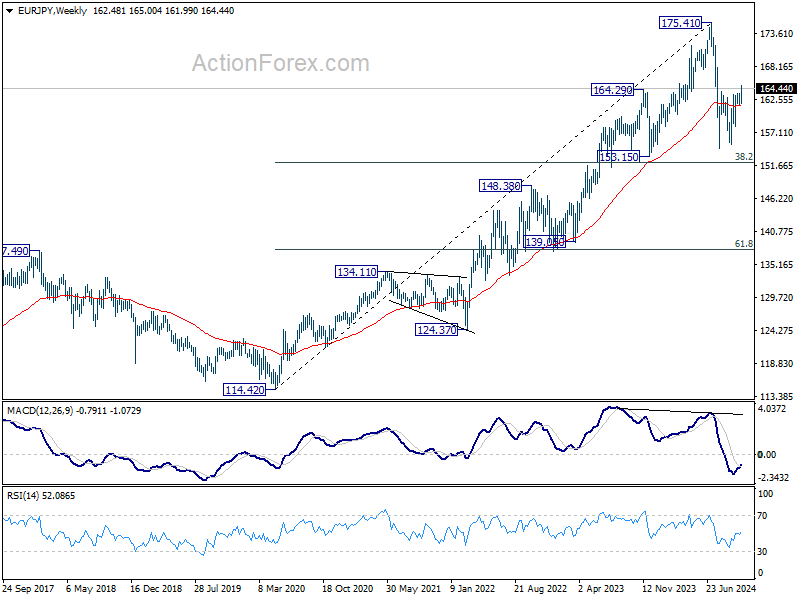
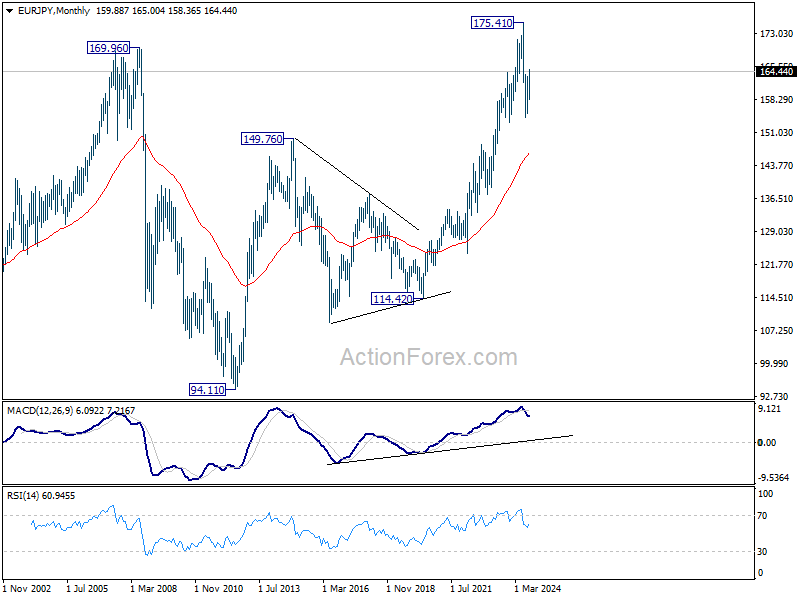
EUR/JPY's rise from 154.40 resumed last week but a temporary top was then formed at 165.00. Initial bias remains neutral this week for consolidations first. Further rally is expected as long as 161.83 support holds. Above 165.50 will target 61.8% retracement of 175.41 to 154.40 at 167.38. Sustained break there will pave the way to retest 175.41 high.
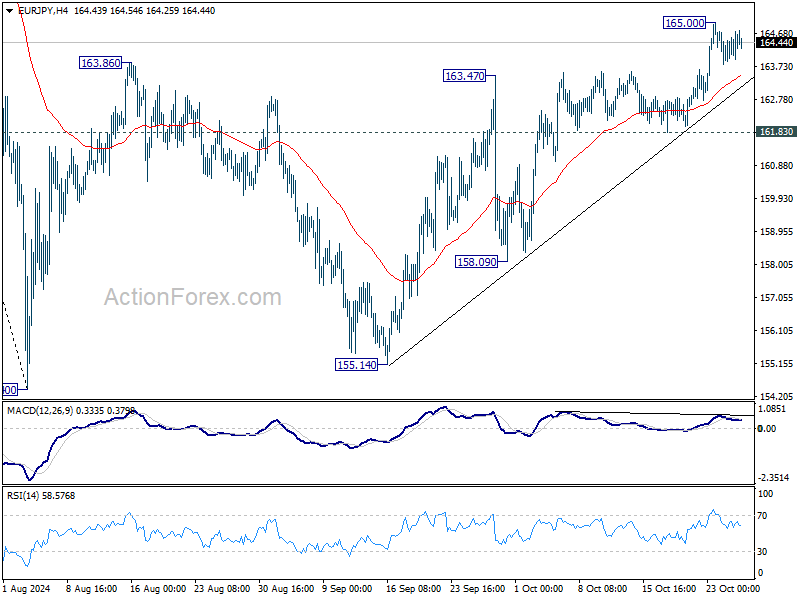
In the bigger picture, price actions from 175.41 are seen as correction to rally from 114.42 (2020 low). The range of consolidation should have been set between 38.2% retracement of 114.42 to 175.41 at 152.11 and 175.41 high. However, decisive break of 152.11 would argue that deeper correction is underway.
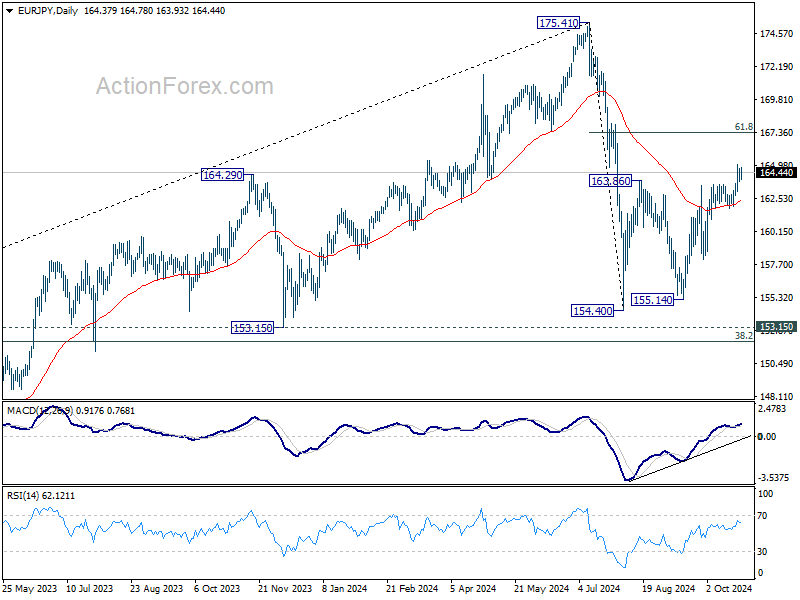
In the long term picture, considering bearish divergence condition in W MACD, 175.41 is at least a medium term top. It's still early to conclude that up trend from 94.11 (2012 low) has completed. But a medium term corrective phase is in progress with risk of deeper fall back to 55 M EMA (now at 146.64).
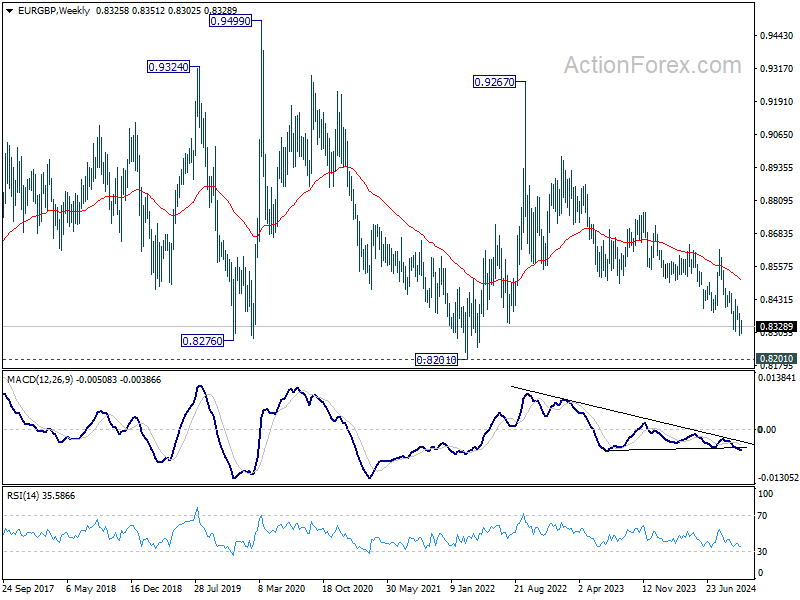
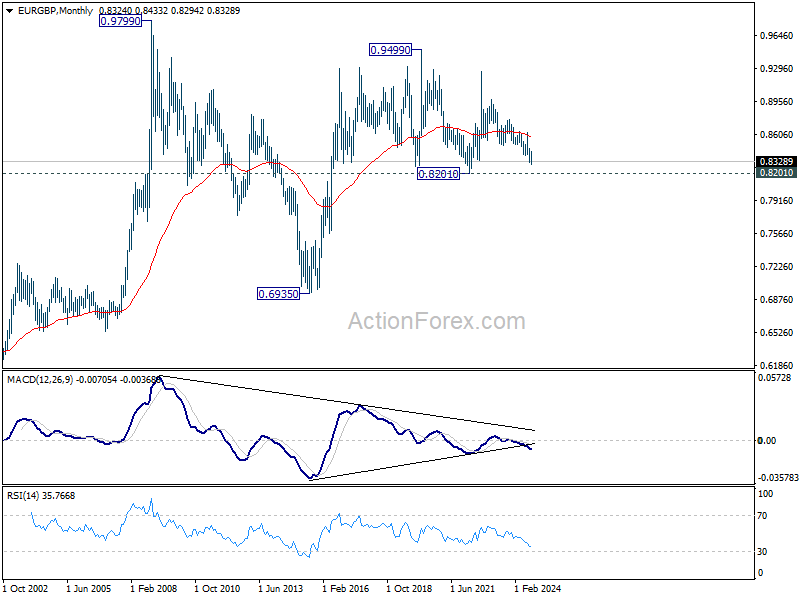
EUR/GBP Weekly Outlook
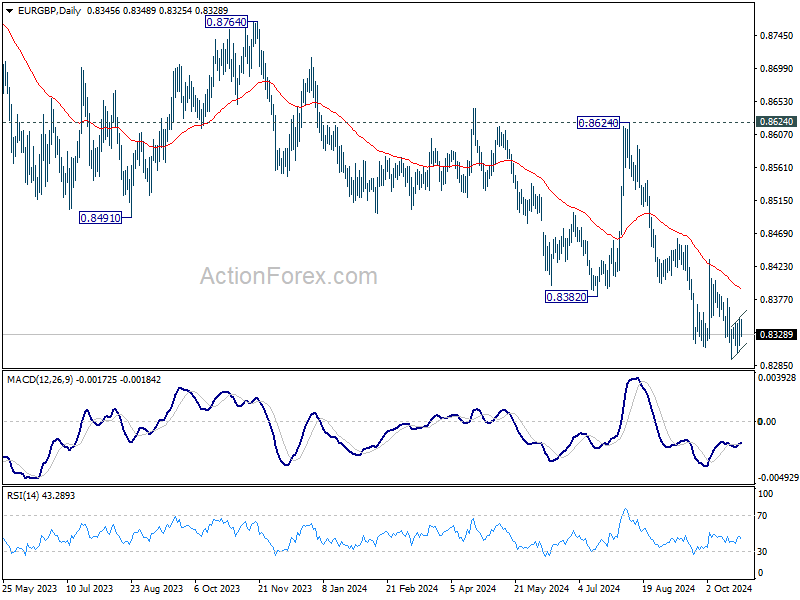
EUR/GBP stayed in consolidation above 0.8294 last week and outlook is unchanged. Initial bias remains neutral this week first. Further decline is expected as long as 0.8433 resistance holds. Break of 0.8294 will resume larger down trend to 0.8201 key support next. Strong support could be seen from there to bring rebound.
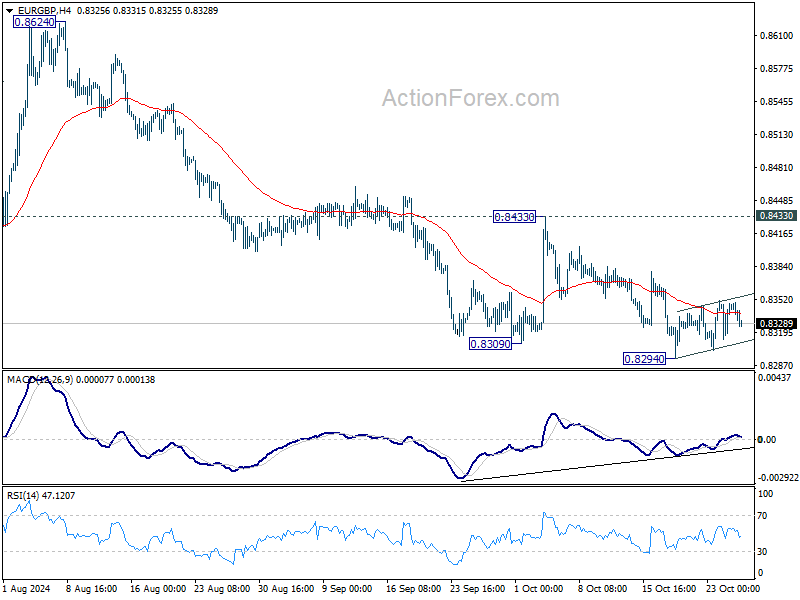
In the bigger picture, down trend from 0.9267 (2022 high) is in progress. Next target is 0.8201 (2022 low), but strong support should be seen there to bring rebound. However, outlook will remain bearish as long as 0.8624 resistance holds even in case of strong rebound. Decisive break of 0.8201 will indicate long term bearish reversal.
In the long term picture, price action from 0.9499 (2020 high) is seen as part of the long term range pattern from 0.9799 (2008 high). Range trading should continue between 0.8201 and 0.9499, until there is clear signal of imminent breakout.
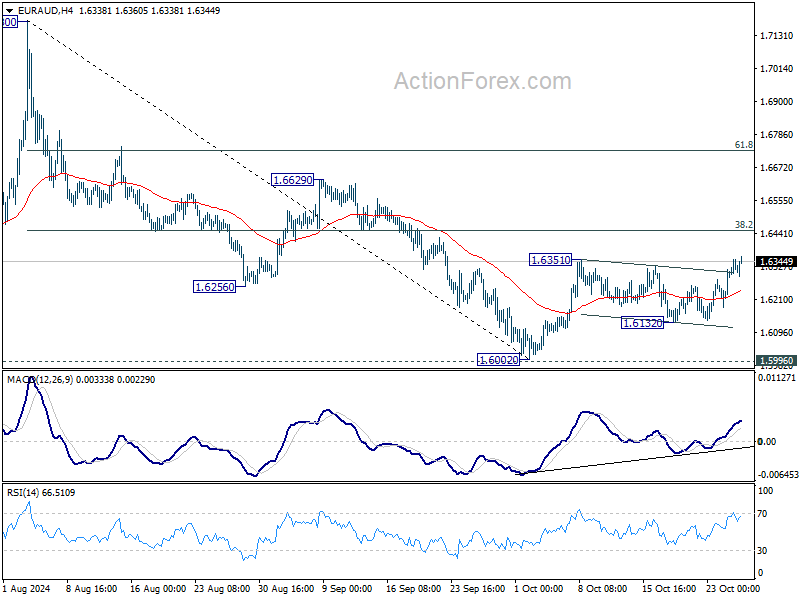
EUR/AUD Weekly Outlook
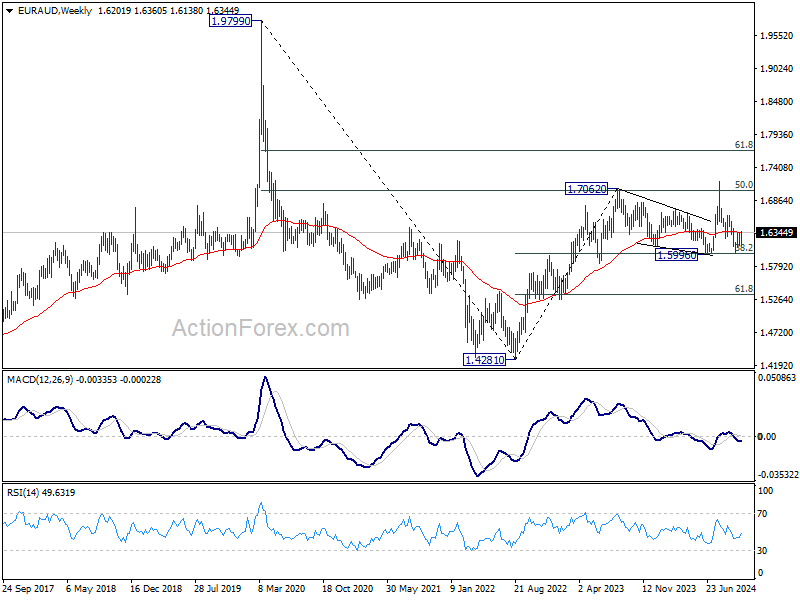
EUR/AUD's last break of 1.6351 resistance last week suggests that rebound from 1.6002 is resuming. Initial bias is now on the upside this week for 38.2% of 1.7180 to 1.6002 at 1.6452. Decisive break there should confirm that whole fall from 1.7180 has completed with three waves down to 1.6002, after being supported by 1.5996. On the downside, though, break of 1.6132 will bring retest of 1.6002 instead.
In the bigger picture, as long as 1.5996 cluster support holds (38.2% retracement of 1.4281 to 1.7062 (2023 high) at 1.6000), up trend from 1.4281 (2022 low) is still expected to resume at a later stage. However, decisive break of 1.5996 will argue that the medium term trend has reversed and turn outlook bearish.
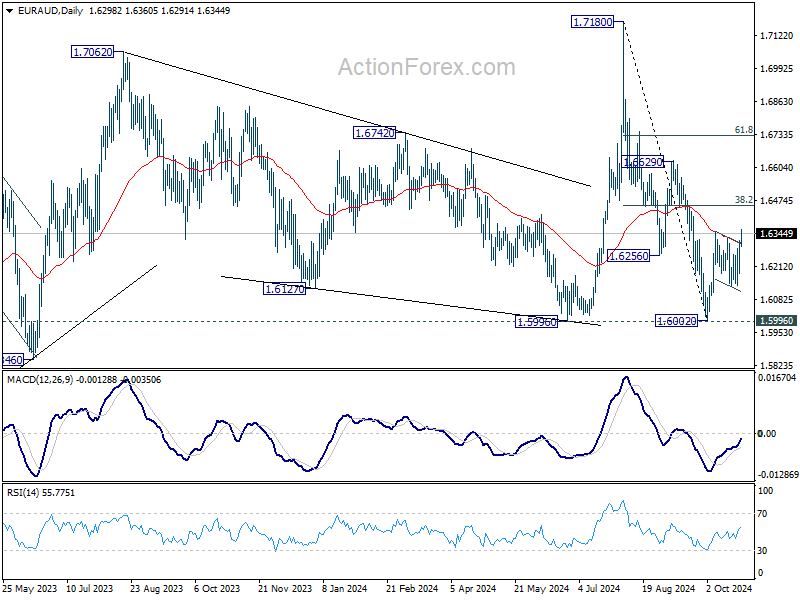
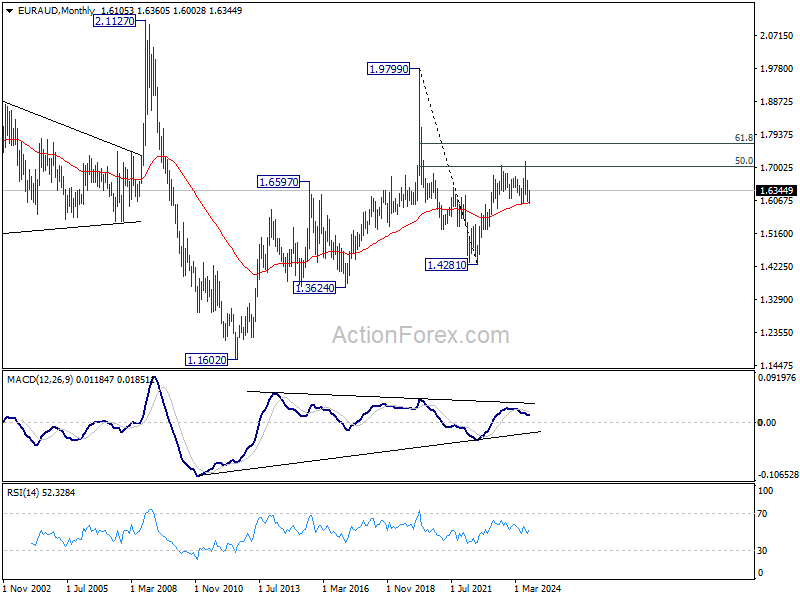
In the longer term picture, rise from 1.4281 is seen as the second leg of the pattern from 1.9799 (2020 high), which is part of the pattern from 2.1127 (2008 high). As long as 55 M EMA (now at 1.6015) holds, this second leg could still extend higher. However, sustained trading below 55 M EMA will open up the bearish case for extending the decline through 1.4281 low.
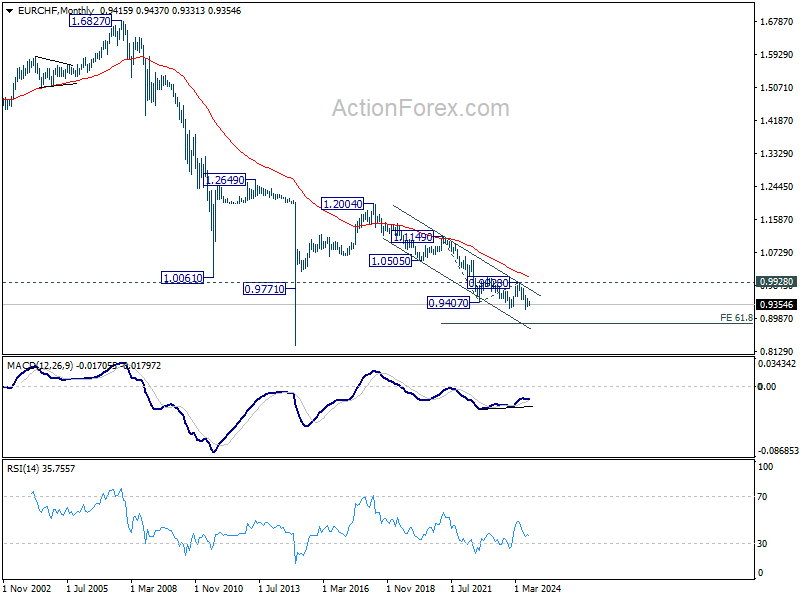
EUR/CHF Weekly Outlook
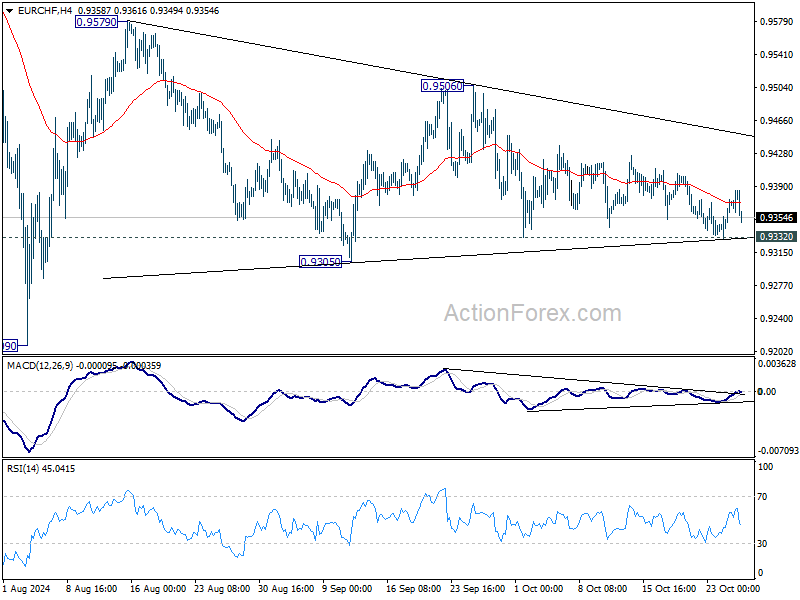
EUR/CHF gyrated lower last week but failed to break through 0.9332 support. Initial bias remains neutral this week first. On the downside, break of 0.9332 will resume the fall from 0.9579 towards 0.9209 low. On the upside, break of 0.9506 will turn intraday bias to the upside for 0.9579 resistance and above.
In the bigger picture, fall from 0.9928 is seen as part of the long term down trend. Repeated rejection by 55 D EMA (now at 0.9427) keeps outlook bearish for breaking through 0.9209 low at a later stage. Nevertheless, sustained trading above 55 D EMA will confirm medium term bottoming and bring stronger rebound back towards 0.9928 key resistance.
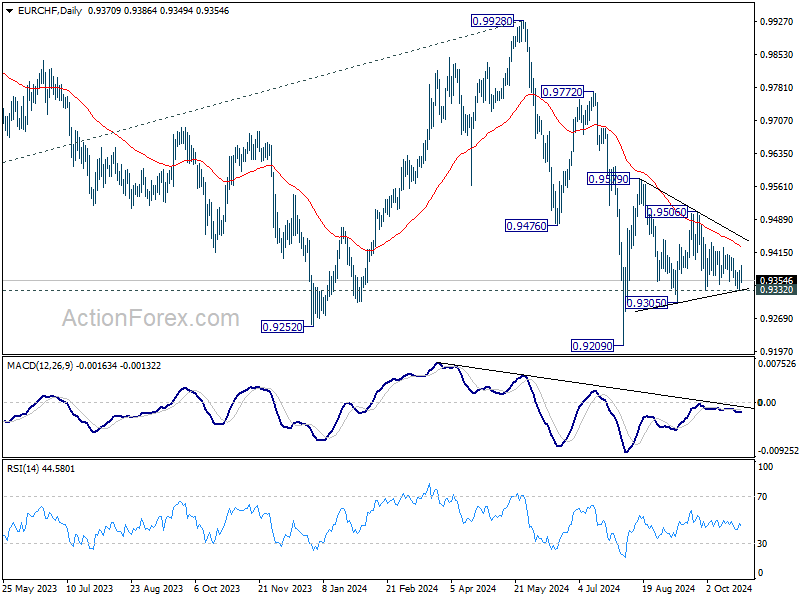
In the long term picture, fall from 1.2004 (2018 high) is part of the multi-decade down trend. Corrective pattern from 0.9407 (2022 low) might have completed with three waves to 0.9928. Decisive break of 0.9252 (2023 low) will confirm long term down trend resumption to 61.8% projection of 1.1149 to 0.9407 from 0.9928 at 0.8851. For now, outlook will stay bearish as long as 0.9928 resistance holds, even in case of strong rebound.

Summary 10/28 – 11/1
Monday, Oct 28, 2024
| GMT | Ccy | Events | Consensus | Previous |
|---|---|---|---|---|
| 14:30 | USD | Dallas Fed Manufacturing Business Index Oct | -9 | |
| 17:30 | CAD | BoC's Governor Macklem speech | ||
| 23:30 | JPY | Unemployment Rate Sep | 2.50% | 2.50% |
| GMT | Ccy | Events | |
|---|---|---|---|
| 14:30 | USD | Dallas Fed Manufacturing Business Index Oct | |
| Forecast: | Previous: -9 | ||
| 17:30 | CAD | BoC's Governor Macklem speech | |
| Forecast: | Previous: | ||
| 23:30 | JPY | Unemployment Rate Sep | |
| Forecast: 2.50% | Previous: 2.50% | ||
Tuesday, Oct 29, 2024
| GMT | Ccy | Events | Consensus | Previous |
|---|---|---|---|---|
| 07:00 | EUR | Germany GfK Consumer Sentiment Nov | -20.5 | -21.2 |
| 09:30 | GBP | Mortgage Approvals Sep | 64K | 65K |
| 09:30 | GBP | M4 Money Supply M/M Sep | 0.10% | -0.10% |
| 12:30 | USD | Goods Trade Balance (USD) Sep P | -96.1B | -94.3B |
| 12:30 | USD | Wholesale Inventories Sep P | 0.20% | 0.10% |
| 13:00 | USD | S&P/CS Composite-20 HPI Y/Y Aug | 6.00% | 5.90% |
| 13:00 | USD | Housing Price Index M/M Aug | 0.20% | 0.10% |
| 14:00 | USD | Consumer Confidence Oct | 98.9 | 98.7 |
| GMT | Ccy | Events | |
|---|---|---|---|
| 07:00 | EUR | Germany GfK Consumer Sentiment Nov | |
| Forecast: -20.5 | Previous: -21.2 | ||
| 09:30 | GBP | Mortgage Approvals Sep | |
| Forecast: 64K | Previous: 65K | ||
| 09:30 | GBP | M4 Money Supply M/M Sep | |
| Forecast: 0.10% | Previous: -0.10% | ||
| 12:30 | USD | Goods Trade Balance (USD) Sep P | |
| Forecast: -96.1B | Previous: -94.3B | ||
| 12:30 | USD | Wholesale Inventories Sep P | |
| Forecast: 0.20% | Previous: 0.10% | ||
| 13:00 | USD | S&P/CS Composite-20 HPI Y/Y Aug | |
| Forecast: 6.00% | Previous: 5.90% | ||
| 13:00 | USD | Housing Price Index M/M Aug | |
| Forecast: 0.20% | Previous: 0.10% | ||
| 14:00 | USD | Consumer Confidence Oct | |
| Forecast: 98.9 | Previous: 98.7 | ||
Wednesday, Oct 30 2024
| GMT | Ccy | Events | Consensus | Previous |
|---|---|---|---|---|
| 00:30 | AUD | Monthly CPI Y/Y Sep | 2.50% | 2.70% |
| 00:30 | AUD | CPI Q/Q Q3 | 0.30% | 1.00% |
| 00:30 | AUD | CPI Y/Y Q3 | 2.90% | 3.80% |
| 00:30 | AUD | RBA Trimmed Mean CPI Q/Q Q3 | 0.70% | 0.80% |
| 00:30 | AUD | RBA Trimmed Mean CPI Y/Y Q3 | 3.50% | 3.90% |
| 05:00 | JPY | Consumer Confidence Oct | 36.8 | 36.9 |
| 06:30 | EUR | France Consumer Spending M/M Sep | 0.30% | 0.20% |
| 08:00 | CHF | KOF Economic Barometer Oct | 105.0 | 105.5 |
| 08:55 | EUR | Germany Unemployment Change Oct | 18K | 17K |
| 08:55 | EUR | Germany Unemployment Rate Oct | 6.10% | 6.00% |
| 09:00 | CHF | UBS Economic Expectations Oct | -8.8 | |
| 09:00 | EUR | Italy GDP Q/Q Q3 P | 0.20% | 0.20% |
| 09:00 | EUR | Germany GDP Q/Q Q3 P | -0.10% | -0.10% |
| 10:00 | EUR | Eurozone GDP Q/Q Q3 P | 0.20% | 0.20% |
| 10:00 | EUR | Eurozone Economic Sentiment Oct | 96.4 | 96.2 |
| 10:00 | EUR | Eurozone Industrial Confidence Oct | -10.5 | -10.9 |
| 10:00 | EUR | Eurozone Services Sentiment Oct | 6.7 | |
| 10:00 | EUR | Eurozone Consumer Confidence Oct F | -12.5 | -12.5 |
| 12:15 | USD | ADP Employment Change Oct | 110K | 143K |
| 12:30 | USD | GDP Annualized Q3 P | 3.00% | 3.00% |
| 12:30 | USD | GDP Price Index Q3 P | 2.70% | 2.50% |
| 13:00 | EUR | Germany CPI M/M Oct P | 0.20% | 0.00% |
| 13:00 | EUR | Germany CPI Y/Y Oct P | 1.80% | 1.60% |
| 14:00 | USD | Pending Home Sales M/M Sep | 0.60% | |
| 14:30 | USD | Crude Oil Inventories | 5.5M | |
| 23:50 | JPY | Industrial Production M/M Sep P | 0.80% | -3.30% |
| 23:50 | JPY | Retail Trade Y/Y Sep | 2.30% | 2.80% |
| GMT | Ccy | Events | |
|---|---|---|---|
| 00:30 | AUD | Monthly CPI Y/Y Sep | |
| Forecast: 2.50% | Previous: 2.70% | ||
| 00:30 | AUD | CPI Q/Q Q3 | |
| Forecast: 0.30% | Previous: 1.00% | ||
| 00:30 | AUD | CPI Y/Y Q3 | |
| Forecast: 2.90% | Previous: 3.80% | ||
| 00:30 | AUD | RBA Trimmed Mean CPI Q/Q Q3 | |
| Forecast: 0.70% | Previous: 0.80% | ||
| 00:30 | AUD | RBA Trimmed Mean CPI Y/Y Q3 | |
| Forecast: 3.50% | Previous: 3.90% | ||
| 05:00 | JPY | Consumer Confidence Oct | |
| Forecast: 36.8 | Previous: 36.9 | ||
| 06:30 | EUR | France Consumer Spending M/M Sep | |
| Forecast: 0.30% | Previous: 0.20% | ||
| 08:00 | CHF | KOF Economic Barometer Oct | |
| Forecast: 105.0 | Previous: 105.5 | ||
| 08:55 | EUR | Germany Unemployment Change Oct | |
| Forecast: 18K | Previous: 17K | ||
| 08:55 | EUR | Germany Unemployment Rate Oct | |
| Forecast: 6.10% | Previous: 6.00% | ||
| 09:00 | CHF | UBS Economic Expectations Oct | |
| Forecast: | Previous: -8.8 | ||
| 09:00 | EUR | Italy GDP Q/Q Q3 P | |
| Forecast: 0.20% | Previous: 0.20% | ||
| 09:00 | EUR | Germany GDP Q/Q Q3 P | |
| Forecast: -0.10% | Previous: -0.10% | ||
| 10:00 | EUR | Eurozone GDP Q/Q Q3 P | |
| Forecast: 0.20% | Previous: 0.20% | ||
| 10:00 | EUR | Eurozone Economic Sentiment Oct | |
| Forecast: 96.4 | Previous: 96.2 | ||
| 10:00 | EUR | Eurozone Industrial Confidence Oct | |
| Forecast: -10.5 | Previous: -10.9 | ||
| 10:00 | EUR | Eurozone Services Sentiment Oct | |
| Forecast: | Previous: 6.7 | ||
| 10:00 | EUR | Eurozone Consumer Confidence Oct F | |
| Forecast: -12.5 | Previous: -12.5 | ||
| 12:15 | USD | ADP Employment Change Oct | |
| Forecast: 110K | Previous: 143K | ||
| 12:30 | USD | GDP Annualized Q3 P | |
| Forecast: 3.00% | Previous: 3.00% | ||
| 12:30 | USD | GDP Price Index Q3 P | |
| Forecast: 2.70% | Previous: 2.50% | ||
| 13:00 | EUR | Germany CPI M/M Oct P | |
| Forecast: 0.20% | Previous: 0.00% | ||
| 13:00 | EUR | Germany CPI Y/Y Oct P | |
| Forecast: 1.80% | Previous: 1.60% | ||
| 14:00 | USD | Pending Home Sales M/M Sep | |
| Forecast: | Previous: 0.60% | ||
| 14:30 | USD | Crude Oil Inventories | |
| Forecast: | Previous: 5.5M | ||
| 23:50 | JPY | Industrial Production M/M Sep P | |
| Forecast: 0.80% | Previous: -3.30% | ||
| 23:50 | JPY | Retail Trade Y/Y Sep | |
| Forecast: 2.30% | Previous: 2.80% | ||
Thursday, Oct 31, 2024
| GMT | Ccy | Events | Consensus | Previous |
|---|---|---|---|---|
| JPY | BoJ Interest Rate Decision | 0.25% | ||
| 00:00 | NZD | ANZ Business Confidence Oct | 60.9 | |
| 00:30 | AUD | Retail Sales M/M Sep | 0.40% | 0.70% |
| 00:30 | AUD | Private Sector Credit M/M Sep | 0.50% | 0.50% |
| 00:30 | AUD | Import Price Index Q/Q Q3 | 1% | |
| 00:30 | AUD | Building Permits M/M Sep | 2.20% | -6.10% |
| 01:30 | CNY | NBS Manufacturing PMI Oct | 50.1 | 49.8 |
| 01:30 | CNY | NBS Non-Manufacturing PMI Oct | 50.5 | 50 |
| 05:00 | JPY | Housing Starts Y/Y Sep | -4.10% | -5.10% |
| 07:00 | EUR | Germany Import Price Index M/M Sep | -0.40% | -0.40% |
| 07:00 | EUR | Germany Retail Sales M/M Sep | -0.50% | 1.60% |
| 09:00 | EUR | ECB Economic Bulletin | ||
| 10:00 | EUR | Eurozone Unemployment Rate Sep | 6.40% | 6.40% |
| 10:00 | EUR | Eurozone CPI Y/Y Oct P | 1.90% | 1.70% |
| 10:00 | EUR | Eurozone CPI Core Y/Y Oct P | 2.60% | 2.70% |
| 11:30 | USD | Challenger Job Cuts Y/Y Oct | 53.40% | |
| 12:30 | CAD | GDP M/M Aug | 0.10% | 0.20% |
| 12:30 | USD | Initial Jobless Claims (Oct 25) | 231K | 227K |
| 12:30 | USD | Personal Income M/M Sep | 0.40% | 0.20% |
| 12:30 | USD | Personal Spending Sep | 0.40% | 0.20% |
| 12:30 | USD | PCE Price Index M/M Sep | 0.10% | |
| 12:30 | USD | PCE Price Index Y/Y Sep | 2.20% | |
| 12:30 | USD | Core PCE Price Index M/M Sep | 0.30% | 0.10% |
| 12:30 | USD | Core PCE Price Index Y/Y Sep | 2.70% | |
| 12:30 | USD | Employment Cost Index Q3 | 0.90% | 0.90% |
| 13:45 | USD | Chicago PMI Oct | 48.2 | 46.6 |
| 14:30 | USD | Natural Gas Storage | 80B | |
| 21:45 | NZD | Building Permits M/M Sep | -5.30% |
| GMT | Ccy | Events | |
|---|---|---|---|
| JPY | BoJ Interest Rate Decision | ||
| Forecast: | Previous: 0.25% | ||
| 00:00 | NZD | ANZ Business Confidence Oct | |
| Forecast: | Previous: 60.9 | ||
| 00:30 | AUD | Retail Sales M/M Sep | |
| Forecast: 0.40% | Previous: 0.70% | ||
| 00:30 | AUD | Private Sector Credit M/M Sep | |
| Forecast: 0.50% | Previous: 0.50% | ||
| 00:30 | AUD | Import Price Index Q/Q Q3 | |
| Forecast: | Previous: 1% | ||
| 00:30 | AUD | Building Permits M/M Sep | |
| Forecast: 2.20% | Previous: -6.10% | ||
| 01:30 | CNY | NBS Manufacturing PMI Oct | |
| Forecast: 50.1 | Previous: 49.8 | ||
| 01:30 | CNY | NBS Non-Manufacturing PMI Oct | |
| Forecast: 50.5 | Previous: 50 | ||
| 05:00 | JPY | Housing Starts Y/Y Sep | |
| Forecast: -4.10% | Previous: -5.10% | ||
| 07:00 | EUR | Germany Import Price Index M/M Sep | |
| Forecast: -0.40% | Previous: -0.40% | ||
| 07:00 | EUR | Germany Retail Sales M/M Sep | |
| Forecast: -0.50% | Previous: 1.60% | ||
| 09:00 | EUR | ECB Economic Bulletin | |
| Forecast: | Previous: | ||
| 10:00 | EUR | Eurozone Unemployment Rate Sep | |
| Forecast: 6.40% | Previous: 6.40% | ||
| 10:00 | EUR | Eurozone CPI Y/Y Oct P | |
| Forecast: 1.90% | Previous: 1.70% | ||
| 10:00 | EUR | Eurozone CPI Core Y/Y Oct P | |
| Forecast: 2.60% | Previous: 2.70% | ||
| 11:30 | USD | Challenger Job Cuts Y/Y Oct | |
| Forecast: | Previous: 53.40% | ||
| 12:30 | CAD | GDP M/M Aug | |
| Forecast: 0.10% | Previous: 0.20% | ||
| 12:30 | USD | Initial Jobless Claims (Oct 25) | |
| Forecast: 231K | Previous: 227K | ||
| 12:30 | USD | Personal Income M/M Sep | |
| Forecast: 0.40% | Previous: 0.20% | ||
| 12:30 | USD | Personal Spending Sep | |
| Forecast: 0.40% | Previous: 0.20% | ||
| 12:30 | USD | PCE Price Index M/M Sep | |
| Forecast: | Previous: 0.10% | ||
| 12:30 | USD | PCE Price Index Y/Y Sep | |
| Forecast: | Previous: 2.20% | ||
| 12:30 | USD | Core PCE Price Index M/M Sep | |
| Forecast: 0.30% | Previous: 0.10% | ||
| 12:30 | USD | Core PCE Price Index Y/Y Sep | |
| Forecast: | Previous: 2.70% | ||
| 12:30 | USD | Employment Cost Index Q3 | |
| Forecast: 0.90% | Previous: 0.90% | ||
| 13:45 | USD | Chicago PMI Oct | |
| Forecast: 48.2 | Previous: 46.6 | ||
| 14:30 | USD | Natural Gas Storage | |
| Forecast: | Previous: 80B | ||
| 21:45 | NZD | Building Permits M/M Sep | |
| Forecast: | Previous: -5.30% | ||
Friday, Nov 1, 2024
| GMT | Ccy | Events | Consensus | Previous |
|---|---|---|---|---|
| 00:30 | AUD | PPI Q/Q Q3 | 0.70% | 1.00% |
| 00:30 | AUD | PPI Y/Y Q3 | 4.80% | |
| 00:30 | JPY | Manufacturing PMI Oct F | 49.0 | 49.0 |
| 01:45 | CNY | Caixin Manufacturing PMI Oct | 49.5 | 49.3 |
| 07:30 | CHF | Real Retail Sales Y/Y Sep | 2.50% | 3.20% |
| 07:30 | CHF | CPI M/M Oct | 0.00% | -0.30% |
| 07:30 | CHF | CPI Y/Y Oct | 0.80% | |
| 08:30 | CHF | Manufacturing PMI Oct | 49.5 | 49.9 |
| 09:30 | GBP | Manufacturing PMI Oct F | 50.3 | 50.3 |
| 12:30 | USD | Nonfarm Payrolls Oct | 125K | 254K |
| 12:30 | USD | Unemployment Rate Oct | 4.10% | 4.10% |
| 12:30 | USD | Average Hourly Earnings M/M Oct | 0.30% | 0.40% |
| 13:30 | CAD | Manufacturing PMI Oct | 50.4 | |
| 13:45 | USD | Manufacturing PMI Oct F | 47.8 | 47.8 |
| 14:00 | USD | ISM Manufacturing PMI Oct | 47.6 | 47.2 |
| 14:00 | USD | ISM Manufacturing Prices Paid Oct | 48.3 | |
| 14:00 | USD | ISM Manufacturing Employment Index Oct | 43.9 | |
| 14:00 | USD | Construction Spending M/M Sep | 0.00% | -0.10% |
| GMT | Ccy | Events | |
|---|---|---|---|
| 00:30 | AUD | PPI Q/Q Q3 | |
| Forecast: 0.70% | Previous: 1.00% | ||
| 00:30 | AUD | PPI Y/Y Q3 | |
| Forecast: | Previous: 4.80% | ||
| 00:30 | JPY | Manufacturing PMI Oct F | |
| Forecast: 49.0 | Previous: 49.0 | ||
| 01:45 | CNY | Caixin Manufacturing PMI Oct | |
| Forecast: 49.5 | Previous: 49.3 | ||
| 07:30 | CHF | Real Retail Sales Y/Y Sep | |
| Forecast: 2.50% | Previous: 3.20% | ||
| 07:30 | CHF | CPI M/M Oct | |
| Forecast: 0.00% | Previous: -0.30% | ||
| 07:30 | CHF | CPI Y/Y Oct | |
| Forecast: | Previous: 0.80% | ||
| 08:30 | CHF | Manufacturing PMI Oct | |
| Forecast: 49.5 | Previous: 49.9 | ||
| 09:30 | GBP | Manufacturing PMI Oct F | |
| Forecast: 50.3 | Previous: 50.3 | ||
| 12:30 | USD | Nonfarm Payrolls Oct | |
| Forecast: 125K | Previous: 254K | ||
| 12:30 | USD | Unemployment Rate Oct | |
| Forecast: 4.10% | Previous: 4.10% | ||
| 12:30 | USD | Average Hourly Earnings M/M Oct | |
| Forecast: 0.30% | Previous: 0.40% | ||
| 13:30 | CAD | Manufacturing PMI Oct | |
| Forecast: | Previous: 50.4 | ||
| 13:45 | USD | Manufacturing PMI Oct F | |
| Forecast: 47.8 | Previous: 47.8 | ||
| 14:00 | USD | ISM Manufacturing PMI Oct | |
| Forecast: 47.6 | Previous: 47.2 | ||
| 14:00 | USD | ISM Manufacturing Prices Paid Oct | |
| Forecast: | Previous: 48.3 | ||
| 14:00 | USD | ISM Manufacturing Employment Index Oct | |
| Forecast: | Previous: 43.9 | ||
| 14:00 | USD | Construction Spending M/M Sep | |
| Forecast: 0.00% | Previous: -0.10% | ||
Markets Weekly Outlook – ‘Magnificent 7’ Earnings, BoJ Meeting and US Jobs Data
- Markets are in a holding pattern as investors weigh risks and uncertainties ahead of a busy week filled with key events.
- The US election is drawing closer, and markets may react to the possibility of a Trump victory, which could lead to a rise in the US Dollar and inflation expectations.
- The Bank of Japan (BoJ) meeting is a highlight in Asia, with market expectations leaning towards no rate hike.
- In the UK, the first budget by the Labor Party under Chancellor Rachel Reeves is highly anticipated.
Week in Review: Markets Appear to be in Holding Pattern as Uncertainties Pile Up
A mixed week comes to a close as markets appear to be balancing their risks ahead of a blockbuster week. Wall Street Indexes suffered early in the week before the Nasdaq and S&P 500 rallied late Thursday and into Friday on the back of a rise in Tesla stock. A good start with the rest of the ‘magnificent 7’ due to report next week.
The IMF conference in Washington will continue into the weekend with no significant developments coming thus far. A few speeches by Central Bank policymakers also throwing up nothing of note has left markets in a state of wait and see as risk and uncertainty begin to pile up.
Market attention will start to turn toward the US election which draws closer. If markets begin to price in a Trump victory the US Dollar could continue to rise. Markets may see a potential rise in inflation and thus less rate cuts should Trump emerge victorious.
There appears to be mixed polling thus far with betting markets pricing in a sizable Donald Trump lead, while a recent Reuters/IPSOS Poll saw a 3% lead in favor of Kamala Harris. The uncertainty is keeping markets on edge and could result in some wild swings as the election draws closer.
The UK saw some weakening PMI data and cooling price pressures this week which adds to the possibility of a BoE rate cut on November 7. However, the week ahead will focus on the first budget by the Labor Party and Chancellor Rachel Reeves. There have been mixed comments with the new Chancellor stating only yesterday that ‘debt will be redefined in the upcoming budget as a % of GDP’. There are also questions around tax hikes etc which makes this a key event for the UK economy.
British government bond yields rose sharply with the GB10YT=RR on Thursday after finance minister Rachel Reeves said she would change the fiscal rules to allow her to borrow more to invest. This has left the risk premium on British bonds at a one-year high.
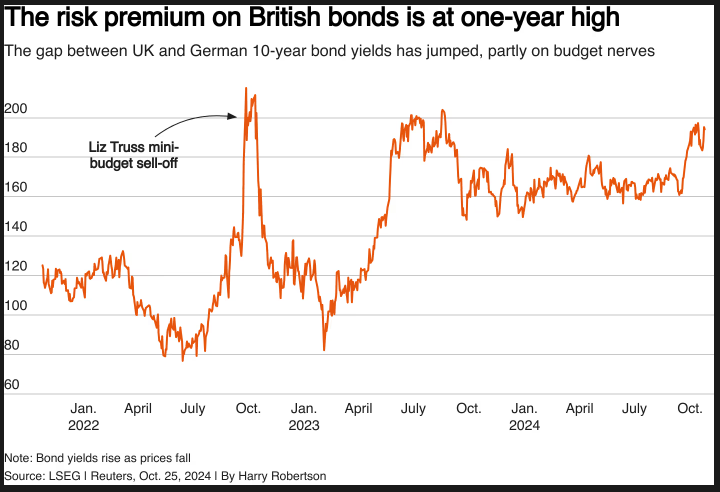
Source: LSEG
Tokyo inflation data released on Friday have complicated matters for the BoJ, just as market optimism had been growing for further rate hikes. Tokyo Core CPI, a leading indicator of inflation trends in Japan, fell to 1.8% y/y in October, down from 2% in September and just above the market estimate of 1.7%.
Commodity markets continue to rise with Gold and Silver in particular continuing their stellar performance. Gold continues to find support as global uncertainties continue to rise. Oil prices look set for modest gains despite a turbulent week that saw some swings in price. The uncertainty in the Middle East continues to keep oil supported.
As long Middle East tensions remain in play, Oil prices will remain supported. The risk premium may continue to flow back and forth which will affect both Oil and Gold moving forward.
The Week Ahead: Magnificent 7 Earnings, NFP Data, UK Budget
The week ahead kickstarts a two week frenzy of risk events and market uncertainties which could result in wild price swings and an upsurge in volatility. Highly awaited earnings from the ‘magnificent 7’ await with indices likely to see a surge in volatility. The S&P 500 and Nasdaq 100 are both within striking distance of their respective all-time highs.
US Jobs data could see rate cut expectations repriced once more and this could have a knock on effect on the US Dollar, US Yields and wall street indexes.
Asia Pacific Markets
In Asia, the Bank of Japan (BoJ) meeting is the highlight of the week. I think the Tokyo data this week has provided a reality check for market participants who had gotten ahead of themselves hoping for a rate hike next week.
I am of the belief that we will not get a rate hike next week but rather expect the BoJ to repeat that if the economy grows as they expect, they will keep adjusting monetary policy back to normal. According to LSEG data, markets are pricing in an 84% probability that the Central Bank will keep rates on hold.
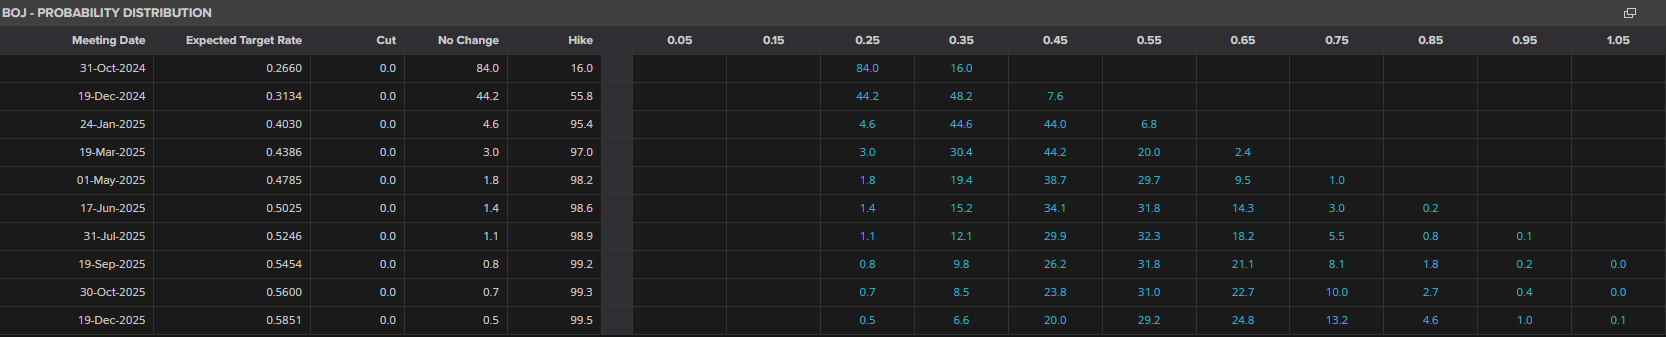
Source: LSEG Workspace
Everyone will be watching the BoJ quarterly report closely. There is a possibility that inflation for 2024 might be predicted to go higher, but no big changes are expected for next year. However, the GDP forecast for the fiscal year 2024 might be lowered because of recent drops in production in the car industry and natural disasters.
In Australia, inflation is getting closer to the target. Year-on-year inflation is expected to drop in the third quarter, reaching the 2-3% target range for the first time since mid-2021, mainly due to lower gasoline and electricity rebates. However, core inflation is likely to stay above 3% because of the tight job market, meaning the Reserve Bank of Australia probably won’t cut rates in their November meeting.
Europe + UK + US
In developed markets, the Eurozone will get the Q3 preliminary GDP numbers which may provide a better picture into the health of the economy. The question for the Euro Area appears to be one of growth now rather than a focus on inflation, much like how the US focus has shifted to the job market. A poor GDP print might increase the rate cut probabilities for the ECB and this could weigh on the Euro.
The US has a pretty busy week with earnings expected from megacap technology firms including Alphabet GOOGL.O, Apple AAPL.O and Microsoft MSFT.O are also due, along with the nonfarm payrolls report for October.
Different earnings results in various sectors and ongoing uncertainty about the U.S. election have made investors careful. However, it would appear markets have begun to consider the possibility of Donald Trump being re-elected recently as reflected in betting data.
According to historical data, US stock markets perform better under a unified government as you can see from the chart below.
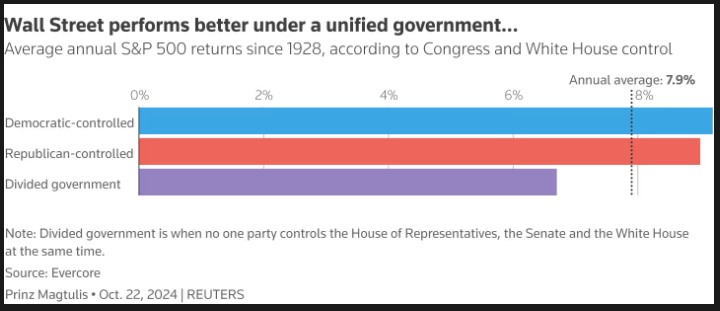
Source: LSEG, Evercore
In the UK markets wait with bated breath for the first budget of the Labor Government to be presented by Chancellor Rachel Reeves on Thursdays November 30. Chancellor Reeves will likely need to spend more on government departments each day, which means taxes might go up, especially for employers. While there will be more investment, it will probably be small because the Treasury wants to avoid borrowing too much and worrying the markets. All in all it is expected to be challenging for Reeves hence why this budget will be intriguing.
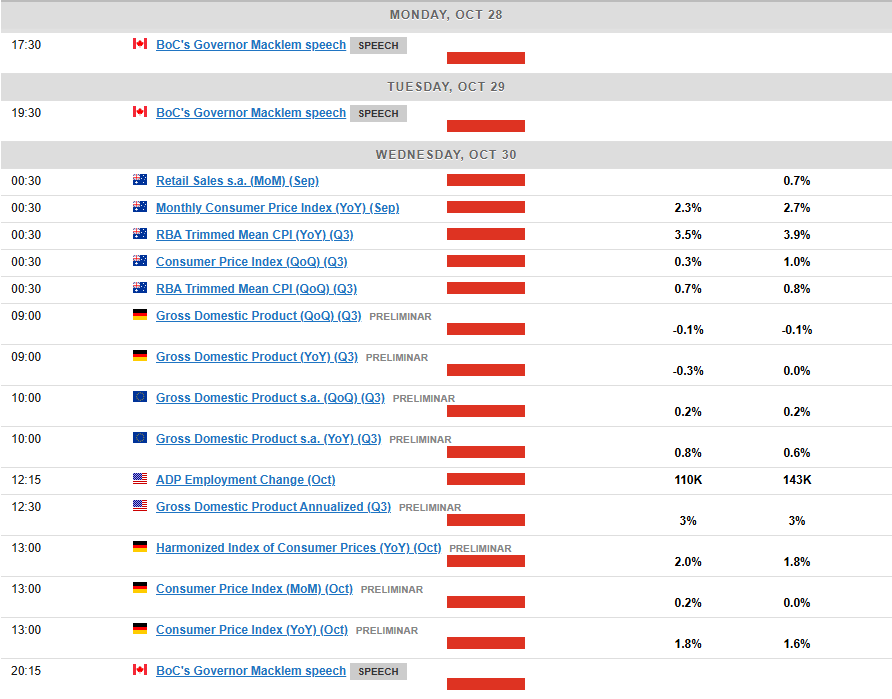
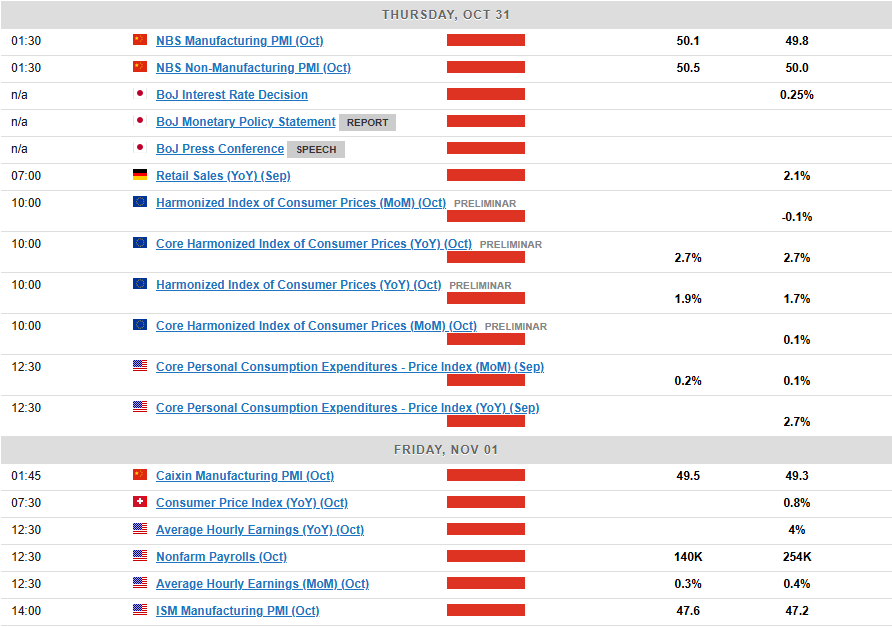
Chart of the Week
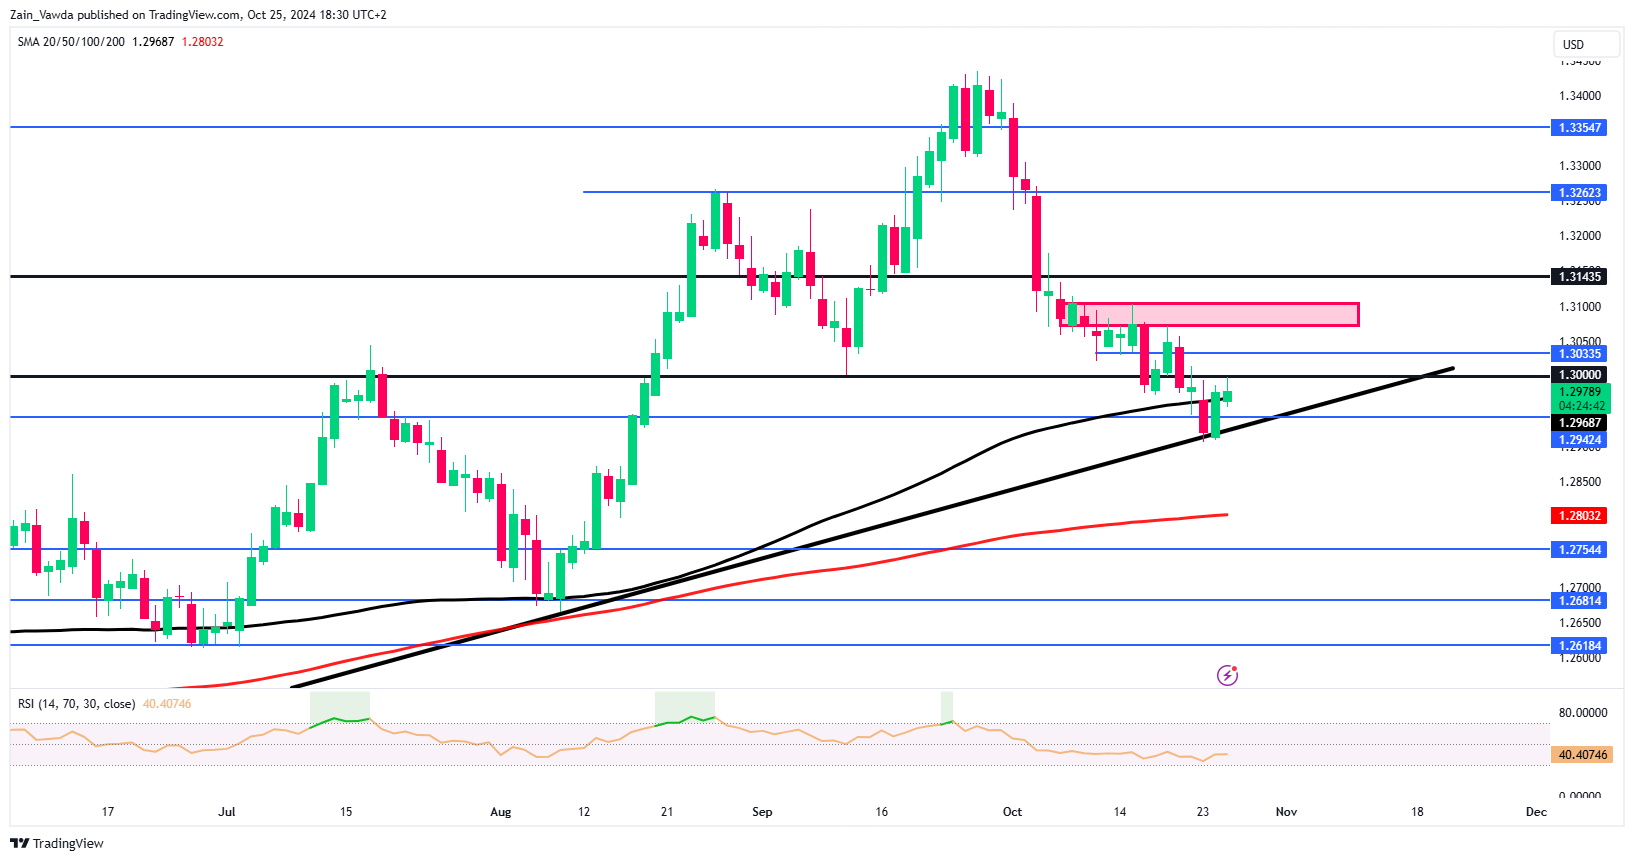
This week’s focus is on the GBP/USD which i have been monitoring for a while. There is a the possibility of a breakout in either direction and given the host of data affecting the US Dollar and the GBP, i think they could be the catalyst to facilitate a move.
Cable bounced out off a key confluence zone by recording its third touch of the ascending trendline before recording a bullish engulfing daily candle close. This saw a bounce on Friday but the pair continues to struggle to gain acceptance above the 1.3000 psychological level.
There is the possibility of a break below the trendline and retest of the 200-day MA resting lower at the 1.2800 handle. As much as the confluences support a narrative i would caution against being too biased on any setup next week. Given the fundamental risk at play we could see wild price swings which could influence potential setups.
GBP/USD Daily Chart – October 25, 2024
Source:TradingView.Com (click to enlarge)
Key Levels to Consider:
Support
- 1.2940
- 1.2800
- 1.2750
Resistance
- 1.3000
- 1.3100
- 1.3250
Weekly Economic & Financial Commentary: Beige Flags in the Beige Book
Summary
United States: Move On Up
- The housing sector was in focus this week. During September, existing homes sales remained in a slump and declined to a fresh cycle low, while new home sales bucked the trend and rose solidly. Although the move up in mortgage rates will pose some near-term challenges for housing, growth elsewhere appears sturdy.
- Next week: GDP (Wed.), Personal Income and Spending (Thu.), Employment (Fri.)
International: Bank of Canada Quickens Monetary Easing, Eurozone Economy Continues to Struggle
- It was a somewhat lighter week for international economic data and events, save for the Bank of Canada (BoC) rate decision and a mix of sentiment data from global economies. The Bank of Canada lowered its policy rate by 50 bps to 3.75% and offered generally dovish-leaning commentary. In the Eurozone, the October PMIs were somewhat mixed but overall not that encouraging.
- Next week: Eurozone CPI & GDP (Wed. & Thu.), China PMIs (Thu.), Bank of Japan Policy Rate (Thu.)
Credit Market Insights: Financial Condition Indices Hit Early 2022 Levels
- Monetary policymakers are keenly interested in quantifying financial conditions, because households and firms respond to changes in them, which in turn translates into changes in real economic activity. Somewhat surprisingly, two financial condition indices from the Federal Reserve currently indicate conditions are about as loose as they were on the eve of the Fed's hiking cycle.
Topic of the Week: Beige Flags in the Beige Book
- The latest Beige Book—which covers early September through mid-October—revealed a picture of softening economic growth. However, despite the bleak picture, contacts were overall optimistic about the longer-term outlook, though still exercised caution in their hiring and investment decisions.
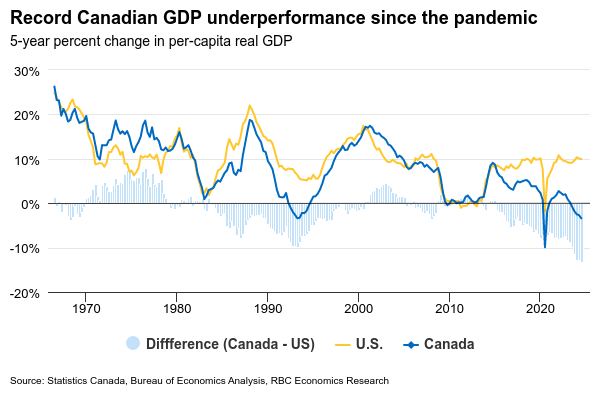
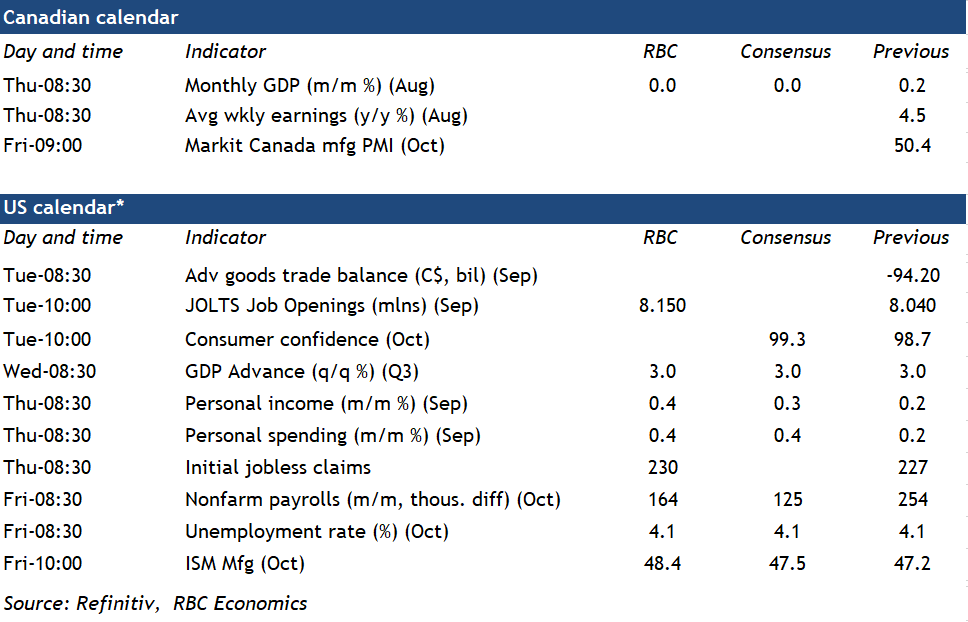
No Growth in Canadian GDP for August Extends Historic Per Capita Underperformance
The Canadian gross domestic product report for August on Thursday will likely reveal more softness in the economy with no growth in line with Statistics Canada’s preliminary estimate a month ago and down from 0.2% growth in July.
A slowdown will be seen in both goods and services. The manufacturing sector likely saw a decline in output, given that sales and volumes were down in August. But, that decline was partially offset by higher output in mining, oil and gas. Wholesale sale volumes declined by 0.7% in August and our tracking of credit card transactions is pointing to a pullback in hospitality services, but retail sales and home resales increased.
The early estimate for September GDP will also likely remain soft. Hours worked declined 0.4% in September—leaving GDP per capita tracking a sixth consecutive quarterly decline. That would extend a historically unprecedented underperformance on a per-capita basis versus the U.S. economy, where we expect Wednesday’s U.S. GDP for Q3 to show another solid 3% gain, faster than Q2. This is consistent with why we expect more interest rate cuts from the Bank of Canada than the U.S. Federal Reserve in the year ahead.
The Fed will be watching U.S. labour market data closely on Friday. U.S. unemployment has been inching higher, but the deterioration has been very gradual and more consistent with normalization in the job market from overheated conditions earlier in the recovery from the pandemic. Disruptions from strikes and hurricanes could significantly distort payroll employment estimates in October, but we look for the unemployment rate to hold at 4.1%. This should be a “cleaner” account of labour market conditions, because those temporarily off work due to bad weather will still be counted as employed for calculating the unemployment rate.
Week ahead data watch
We expect 164,000 jobs to be added to the U.S. labour market in October, slowing from 254,000 in September.
In U.S. Q3 GDP, residential investment is expected to show more weaknesses with housing starts and existing home sales both lower than in the previous quarter. For non-residential investment, equipment investment likely saw solid growth, mainly supported by the aircraft component. That will also offset the decline in structure investment. Lastly, exports likely expanded at a solid pace in Q3, outpacing import growth.
U.S. personal consumption likely grew by 0.4% given robust retail sales in September. We expect personal income to tick up 0.4% from 0.2% in July.
The August Survey of Employment, Payrolls and Hours on Thursday will be analyzed for further signs of easing in the Canadian labour market. Given slower hiring demand, we continue to look for lower job openings and slower wage growth moving forward.
The Weekly Bottom Line: Is 50 the New 25?
Canadian Highlights
- The Bank of Canada made a super-sized interest rate cut this week, taking the overnight rate to 3.75%. The Bank cited the significant decline in inflation as a key factor, but their inflation forecast was little changed from July.
- The Bank’s data dependence has made policy decisions backward looking. If they had focused on their inflation forecast rather than the data, they would have cut rates earlier in the year.
- This focus on the here and now, rather than the forecast may result in overdoing it and needing to recalibrate rates later. Resulting in a more stop-and-go path for interest rates.
U.S. Highlights
- U.S. Treasury yields continued to rise as the race for the White House tightened, leading to elevated uncertainty regarding the future path of fiscal policy.
- Federal Reserve speakers this week noted that further reductions in interest rates would be warranted, although incoming data supported a cautious approach.
- Existing home sales fell to a fourteen year low in September. Elevated interest rates, combined with expectations for lower rates moving forward, worked to keep demand subdued.
Canada – Is 50 the new 25?
No, I’m not talking about age, although I’d greatly benefit from that view! I knew I would eat crow on Wednesday’s Bank of Canada (BoC) call with the high market pricing for a 50 basis point (bp) cut. There’s no regret in having conviction that risks need to be managed when the Bank delivers a rate cut that historically aligns to emergency periods. It could condition Canadians to expect data misses to be met with large monetary responses. I was hoping this would be clearly addressed in the press conference. Unfortunately, it was not, and there was little indication on where the bar is set for another 50 bps in December.
Within the press release, oil was mentioned twice, which is not common fare. It’s been a contributor to a larger-than-expected decline in inflation, but all it would take is a supply disruption from geopolitical events to cause a spike. If so, would we assume all bets are off on future rate cuts? Of course not.
Next up were shelter prices, which were noted to be decelerating. Of course! This is highly forecastable and observable. The peak impact of the rapid escalation in mortgage rates is in the rear-view mirror. And, the act of cutting interest rates takes heat off mortgage interest costs, where there’s a “circular reference” into inflation metrics. Almost a fifth of shelter costs derives from this single input and models have correctly predicted this easing in the growth-impulse.
Next up was mention that the Bank’s preferred core measures were just under 2.5%. The memo that communicated 2.5% was a meaningful threshold, rather than the midpoint of the inflation range, must have gotten lost. The Bank also did not make significant changes to their outlook on the economy or core inflation metrics, except to mark-to-market in Q3.
Carolyn Rogers offered the clearest (and most transparent) explanation — with the benefit of time and more data, the 50 bps cut reflects greater confidence that inflation will hold near 2%. By extension, a faster normalization in rates is warranted. However, this logic automatically argues for at least one more 50 bps cut in December, absent a large miss to the upside on the Bank’s forecast. No surprise, markets have about two-thirds of that priced in.
Normalization means getting back to the BoC’s range for the neutral rate, which they estimate is between 2.25% and 3.25%. The midpoint is cited as the ideal target. Now, that range is not static. It’s regularly revised based on population and productivity trends. For instance, the government’s recently announced changes to immigration targets should result in a downshift in the range due to labour market impacts. In addition, Canada’s persistent poor productivity performance offers further rationale to lower the range. However, doing so would only mean that the BoC policy rate is even further away from neutral than originally believed, yet another argument for several 50 basis point rate cuts to achieve normalization. But as it currently stands, this requires returning to 2.75%, at a minimum. There was no discussion at the press conference on the appropriate pace, other than if the BoC’s forecast is met, interest rates will be cut again.
Let’s get back to fundamentals and pull the lens back on what’s really motivating outsized rate cuts. For decades, central banks drilled into the public mindset that the best approach in monetary policy was:
- Gradual (and transparent) adjustments
- Decisions reflect a forward-looking economic and risk landscape, generally within the 12-to-18-month range.
But that was the pre-pandemic world when central bankers had reasonable confidence in forecast models and historical relationships. Since then, the communication pivoted to focusing analysts on the here-and-now data. Confidence requires irrefutable proof, rather than being about 60% of the way there on the data trend.
Understandable given that the pandemic created a persistent inflation surge that models were not designed to predict. The shock occurred simultaneously along the demand and supply channels. Most macroeconomic models have greater sophistication in understanding the demand side of the equation, rather than the supply side. But here too there were big failures. For instance, the unemployment rate typically had a great track record in predicting household financial stress and consumer patterns. But it had no chance on accuracy during the pandemic cycle that displayed historic departures as the pause button was hit on loan repayments and household bank accounts were backfilled with massive government transfers.
Those days are long gone, and the learnings and sophistication of models has since broadened, as has the understanding of those who rely on them. With the absence of unusual or unique factors, there should be greater confidence in the predictive outcomes of models and judgement. Yet, the central bank keeps its eyes and communication trained on the immediate data to influence decisions. Effectively, decisions are based on data fluctuations largely informing one-quarter ahead rather than the medium term. This is not just a Bank of Canada phenomenon, but a global central bank trend.
What could this mean in the bigger picture? One outcome is an amplification of interest rate volatility. No longer are 50, 75 or 100 basis point moves reserved for the “oh shoot!” emergency moments where there’s high risk of a recession. Interest rate cycles have a later start, but then get compressed, creating larger jumps and tumbles, or volatility.
Is that a bad thing? Not in every aspect. As the BoC noted, they want to stick the landing. A larger interest-rate move isn’t a signal that they know something you don’t. It is an admission that they are behind the curve because that’s the natural state that occurs when the emphasis is on changes in the near-term data. By the time you see the data, observe persistence, you’ll naturally be behind the curve. The data, after all, are already backward looking. But at least once this condition is known, the adjustment is swift to try to prevent more economic weight. As the BoC Governor noted, we took a bigger step because inflation is back to the 2% target, and want to keep it there.
However, this can likewise train households to develop a “pile in” psychology. Canadians are not shy about taking on debt. And the housing market is indeed a sport, with a team fielded by population growth and insufficient supply within key segments, like the detached market. The Canadian history on housing is clear: It responds quickly to interest rate movements. And we’ve just come out of a lengthy pent-up demand cycle. In addition, the government is adding fuel to the market with recent policy changes that will stoke demand amongst first time buyers. That means there will be two big channels feeding through the housing market simultaneously, even as immigration flows get tapped down with the government’s recent announcement.
There will be those wanting to “beat the crowd” and secure “a deal” before the combination of government measures and even lower interest rates create a groundswell in demand that risks flipping various markets from balance back to a sellers’ market. But some will be forced to wait longer, in need of those new government measures. So for those with eyes trained on the here-and-now data, the next couple of months may produce housing data that might look like Canadians are not overly responding to interest rate cuts, but my money is on nature and nurture coming back into play. 2025 could display a stronger response in housing demand as monetary and government policy collide into a one-two punch to unleash pent-up demand.
If the Bank of Canada is going to prioritize the near-term data towards outsized rate cuts, we must consider that it would need to be equally responsive to risk-development. This can create an overcorrection on interest rates, going down too deep only to be fine tuned again on the upside as the household spending impulses kick in more suddenly relative to when interest rates follow more gradual cycles. Likewise, it can result in more stop-and-go monetary policy.
U.S. – Countdown to Election Day
One of the most anticipated global events of 2024 is now nearly a week away. As financial markets anxiously await the outcome of the U.S. presidential and congressional elections, we have seen U.S. Treasury yields and the U.S. dollar rise to three-month highs (Chart 1). The uptick which began earlier this month was initially incited by stronger-than-expected economic data, but recent movements have also likely been driven by the narrowing in the polls for the U.S. presidential election. Given that the election will determine the path of fiscal policy moving forward, and by extension monetary policy, uncertainty related to the outcome is likely to remain a weight on financial markets through to November 5th.
Elevated interest rates continued to dampen housing market activity in September, as existing home sales fell to their lowest level since 2010! Demand is also likely being restrained in part by consumer expectations for lower interest rates moving forward, with Federal Reserve Chair Powell indicating that rates would likely be trending lower through the coming year during his press conference last month. Existing home sales are likely to remain subdued in the near-term as mortgage rates moved back above 6½% in October. Nevertheless, the housing market is expected to thaw over the coming year as the Federal Reserve continues to reduce borrowing costs.
The Federal Reserve will be entering its pre-interest rate decision blackout period this weekend, with no further updates expected until Chair Powell’s post-meeting press conference on November 7th. The Fed officials we heard from this week stated that the strength of incoming economic data would warrant caution in future policy decisions, but all speakers noted that the trajectory of interest rates would continue to be downward. Market pricing has pulled back their expectations for rate cuts, but they are now realigned with the Federal Reserve’s median projection from the September Summary of Economic Projections (Chart 2).
Next week sees a bumper crop of data releases that will be key inputs to the Federal Reserve’s next interest rate decision. The advance estimate for real GDP growth in the third quarter is expected to show the economy continuing to grow at a strong pace of 3.0%. While employment growth remained solid in the third quarter, October’s employment report due out next Friday is expected to show a deceleration in job gains (125k vs. 254k in September). The Federal Reserve will also be monitoring the release of their preferred inflation metric next week, core PCE, which is expected to show a modest decline to 2.6% in September.
Assuming there are no surprises in the incoming data, the Federal Reserve is expected to continue to cut rates at a pace of 25 basis points per meeting through the end of the year. Chair Powell’s remarks on November 7th will be monitored closely for guidance, although they may be competing with the results of the 2024 election for the attention of financial markets. Suffice it to say, markets will not be left wanting for important developments in the coming weeks.