
Sample Category Title
Key Events for the Week Ahead
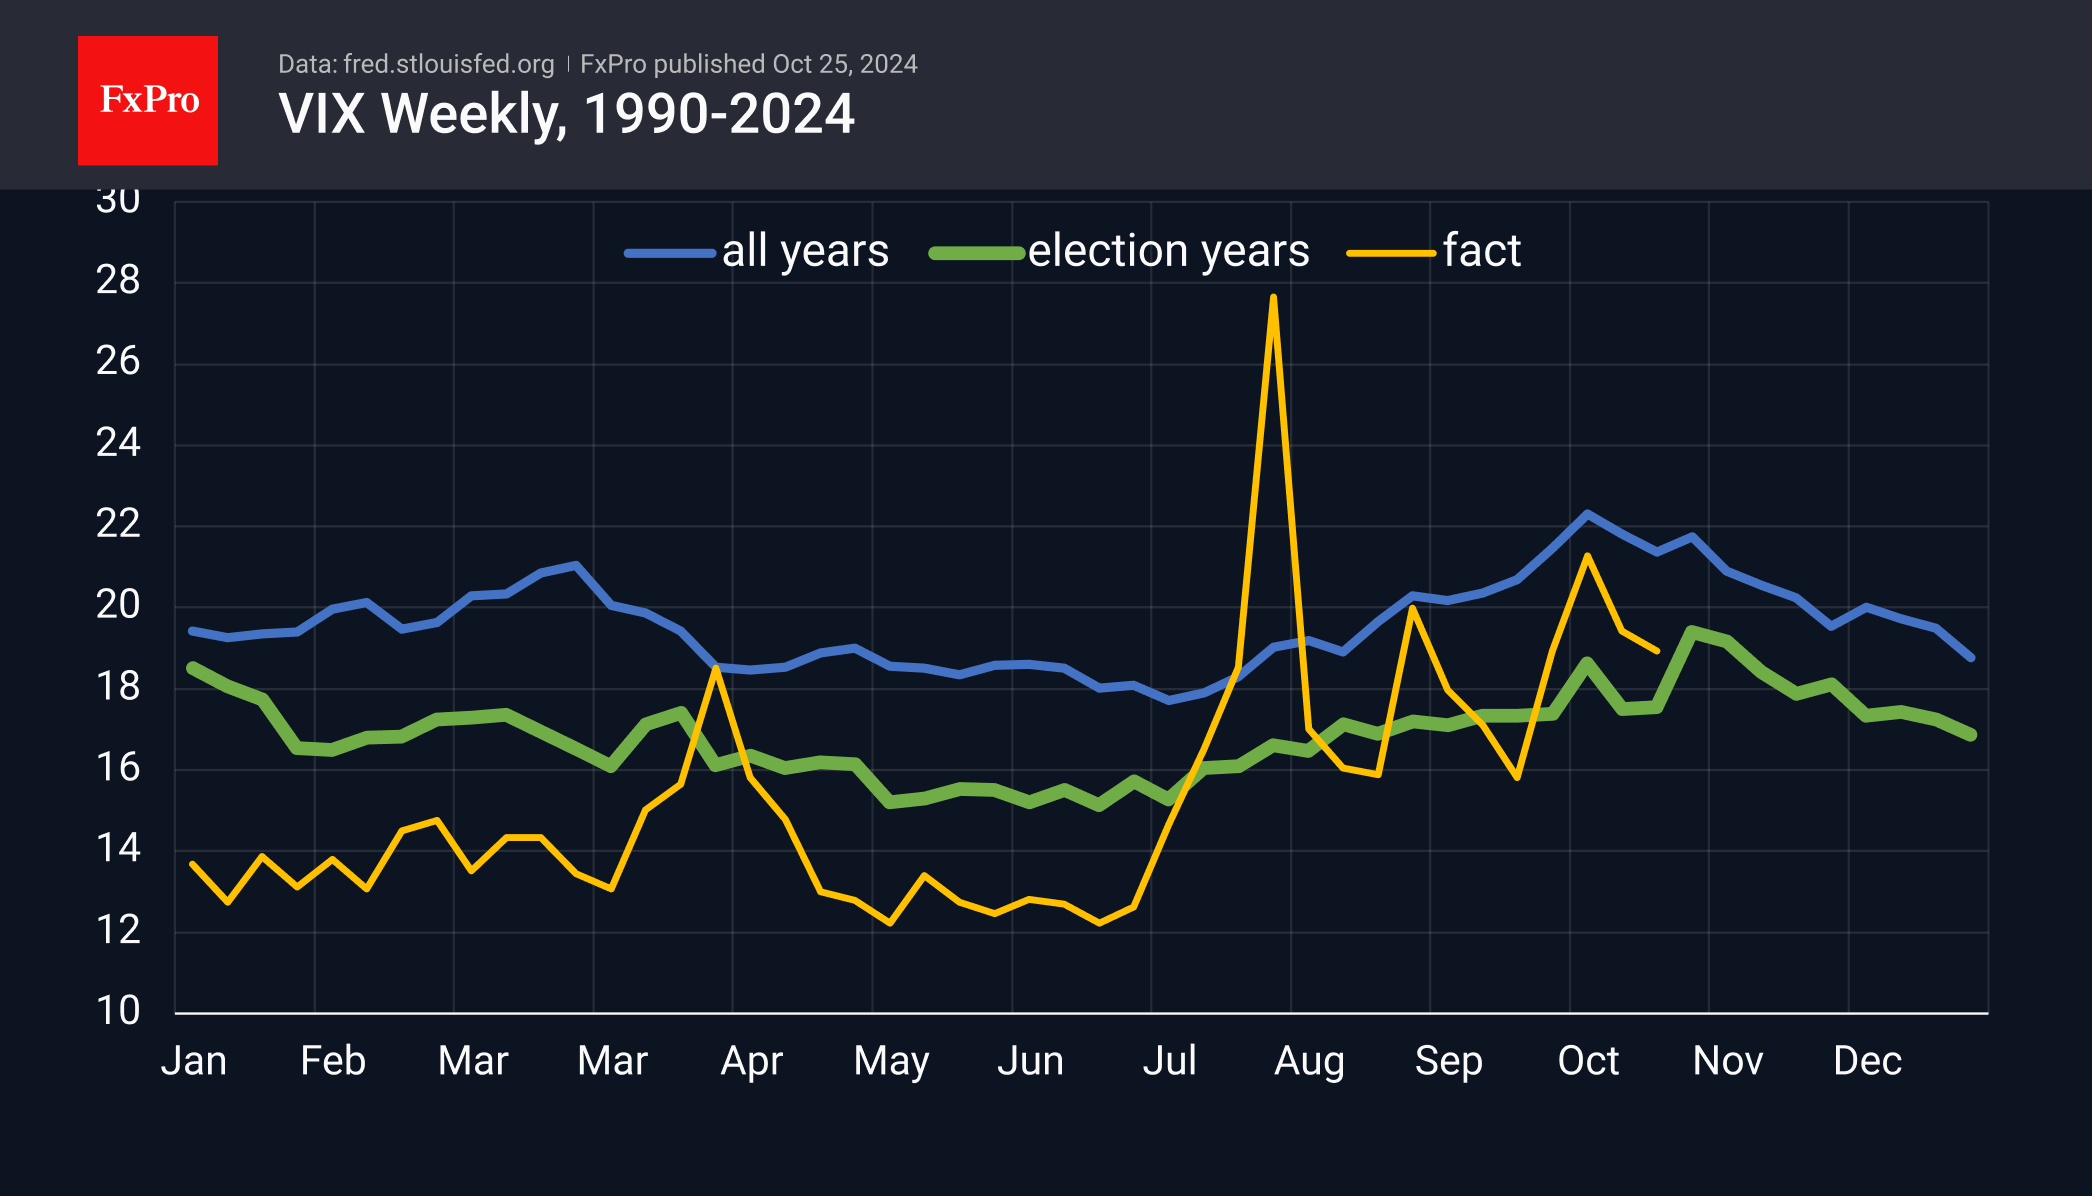
Seasonal patterns in the VIX, often referred to as the market’s fear gauge, indicate that volatility during this election year is likely to peak in the coming weeks, so be prepared for moves against established trends.
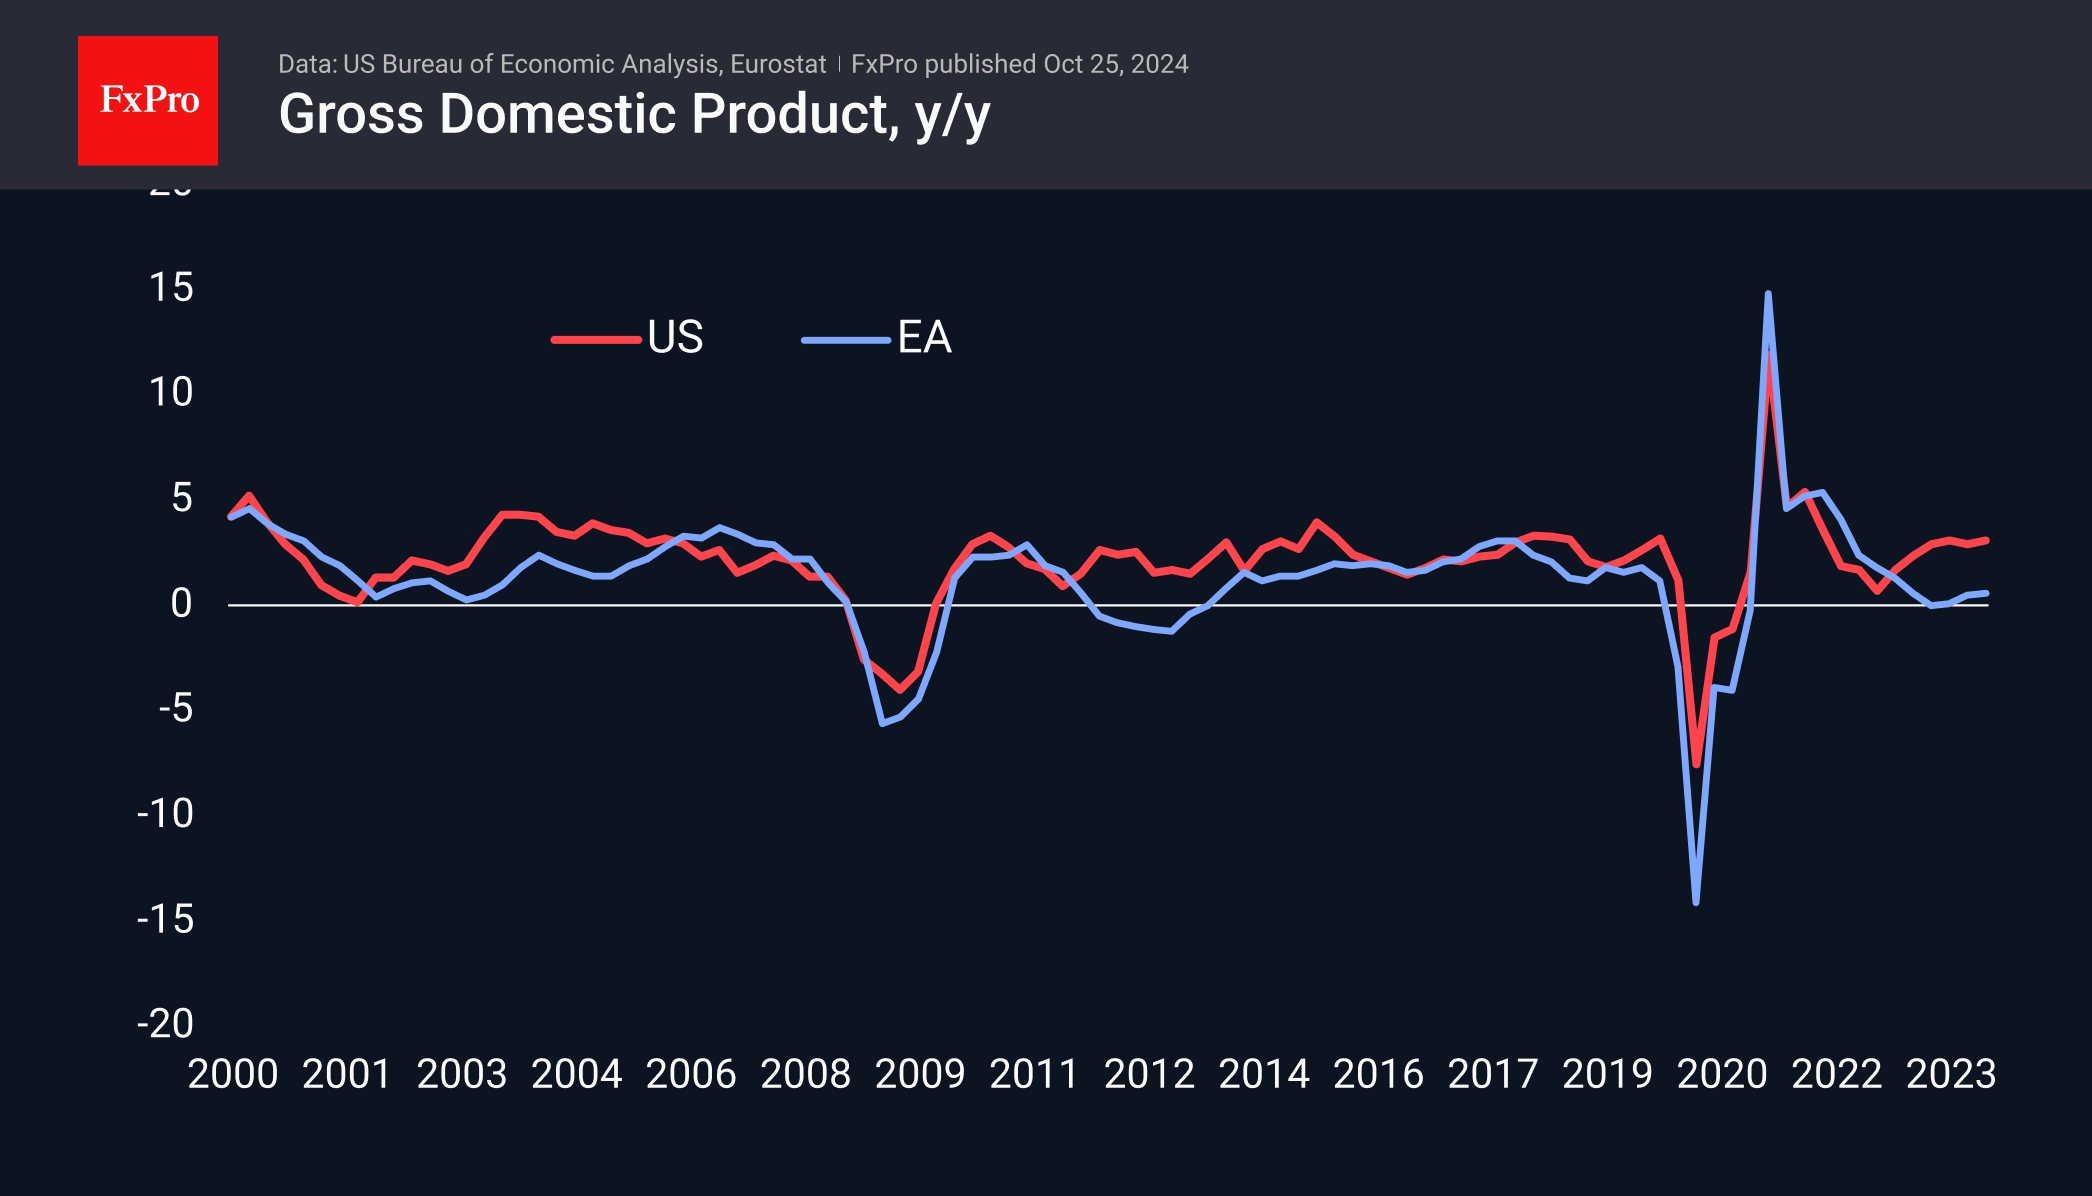
Looking ahead, consumer inflation data from Australia and Germany will be released on Wednesday. Initial estimates of third-quarter GDP for the eurozone and the US are also significant, as they could greatly influence the central bank’s views on interest rates.
The Bank of Japan will decide on interest rates on Thursday. Expectations have shifted towards ‘no change’ in recent days, putting pressure on the yen. However, the promise of further rate hikes could revive interest in the Japanese currency.

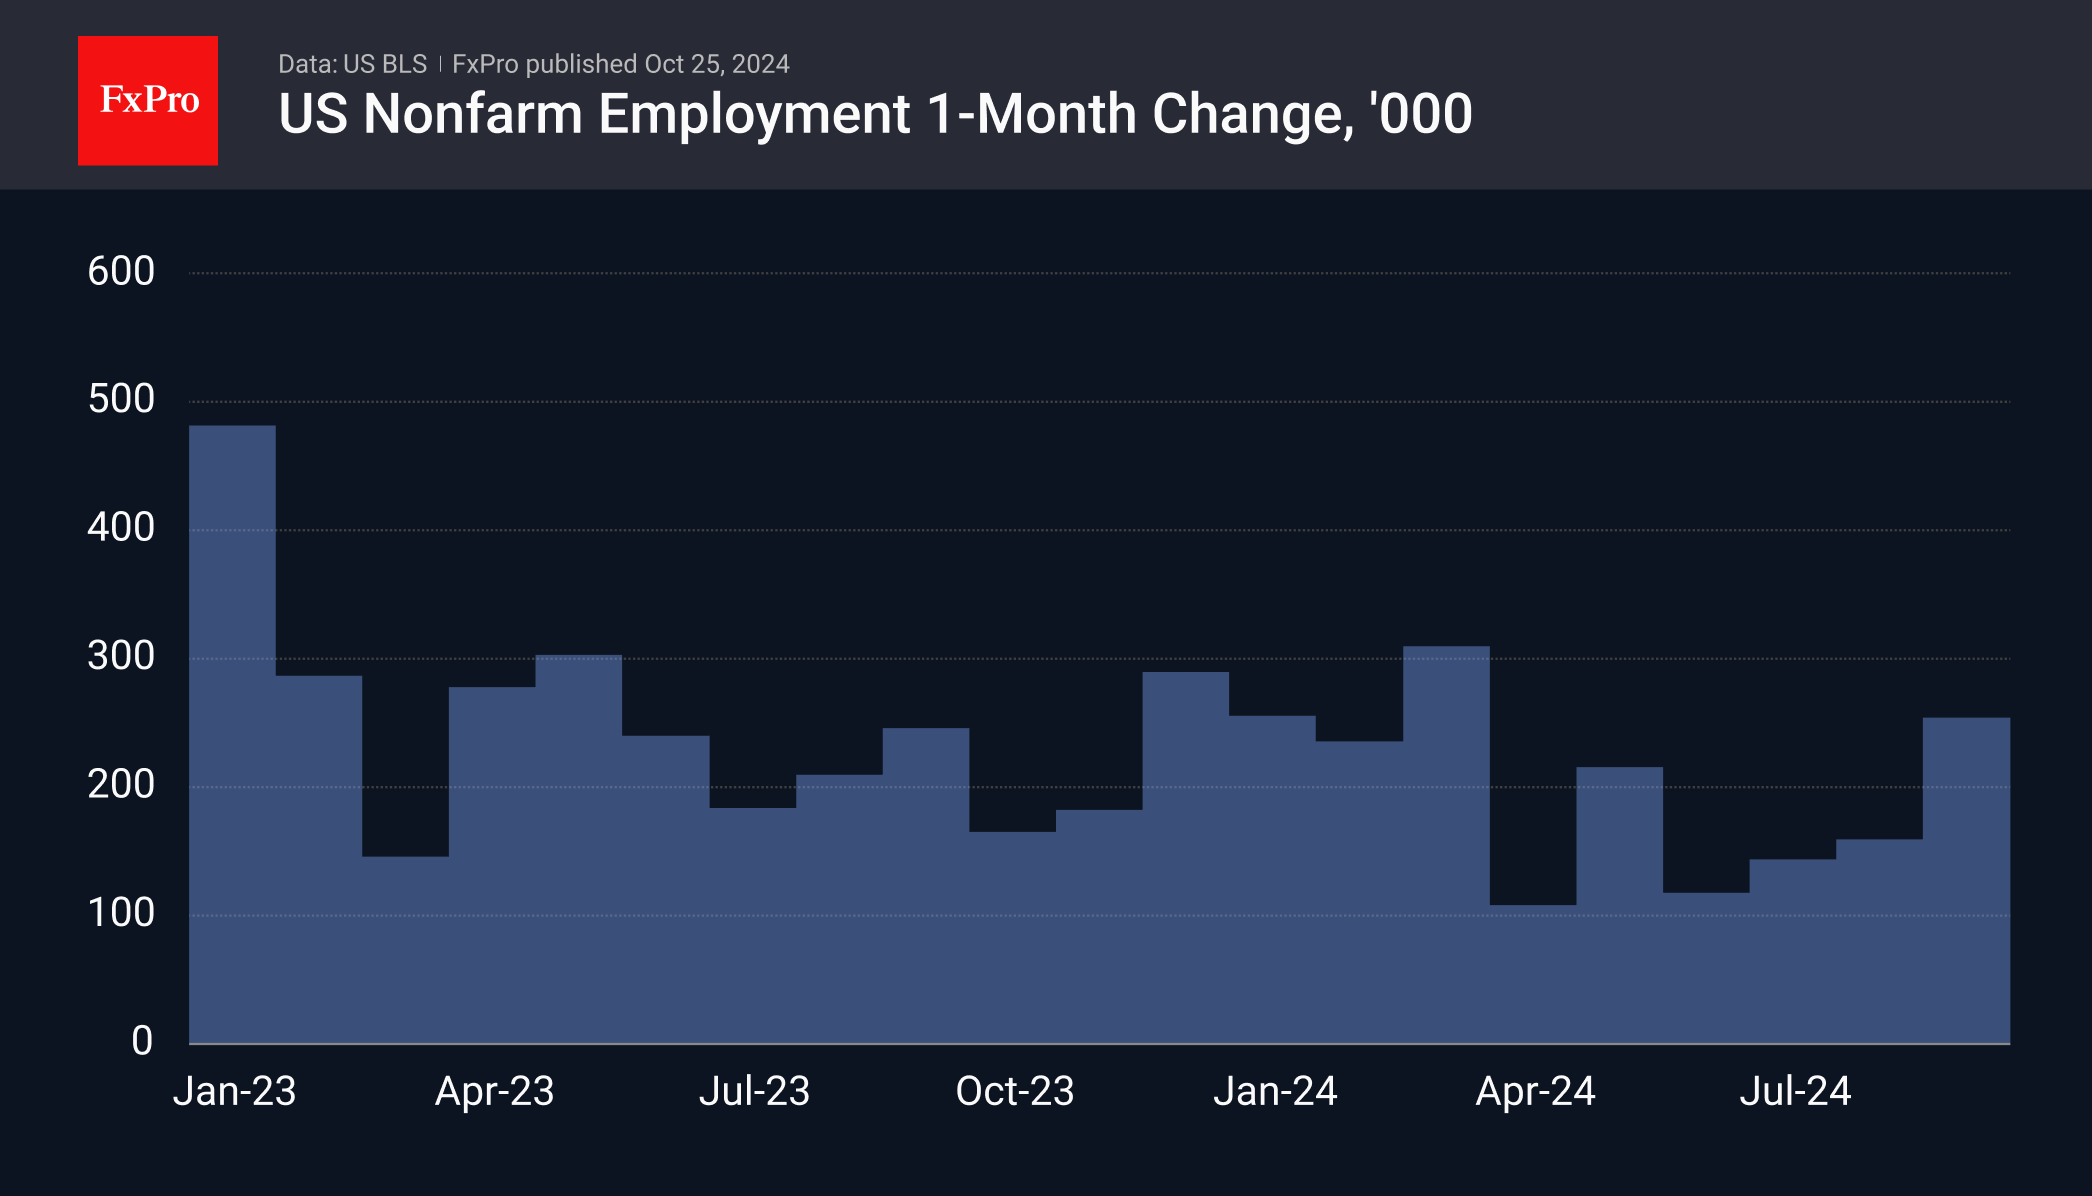
Friday will be the highlight of the week for the US markets, thanks to the October employment report. Throughout the week, the markets and we will be monitoring indirect indicators to assess the situation early.
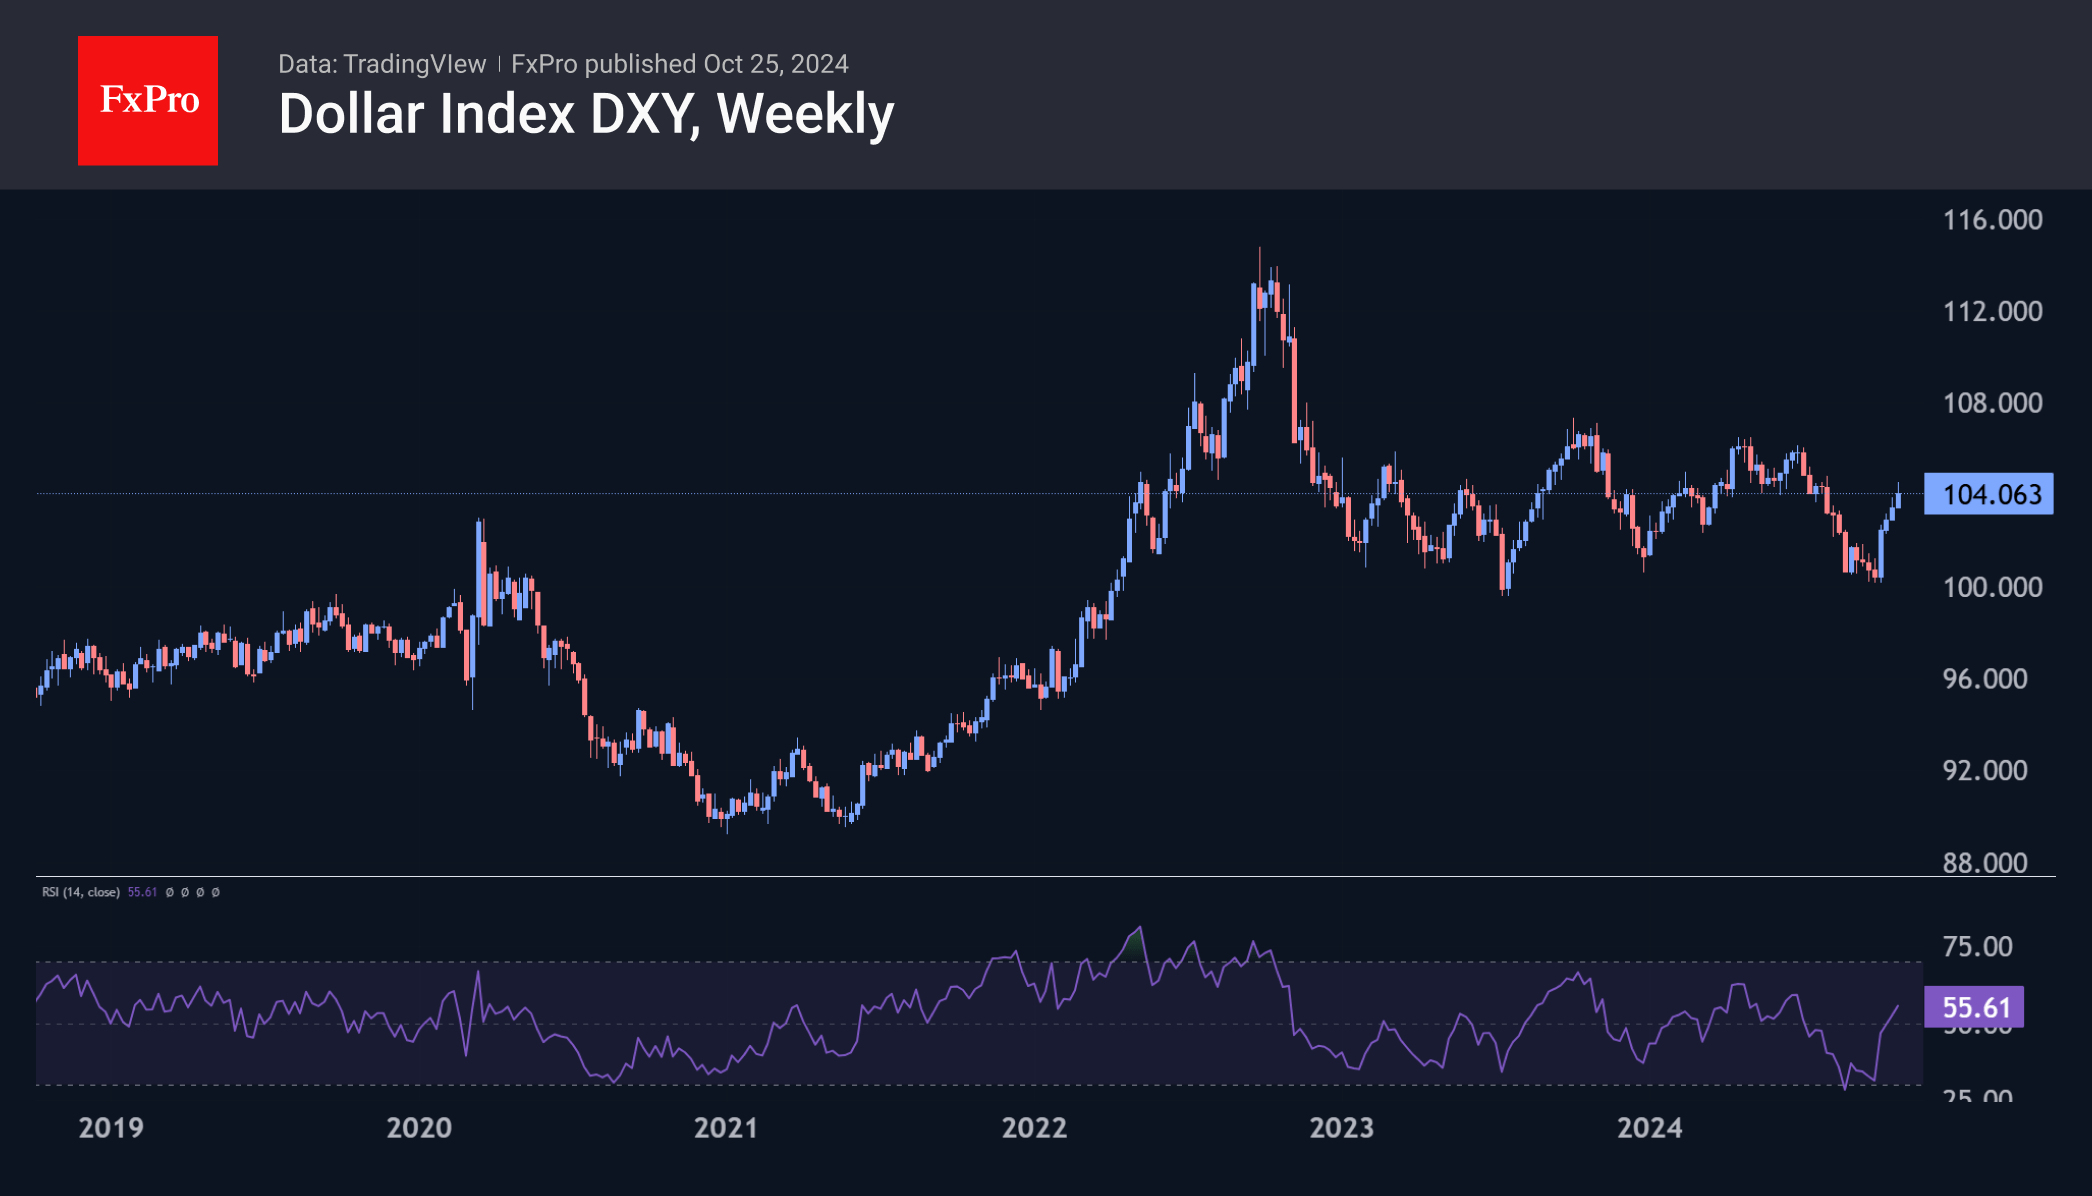
Not a Stronger Dollar, But Weaker Others
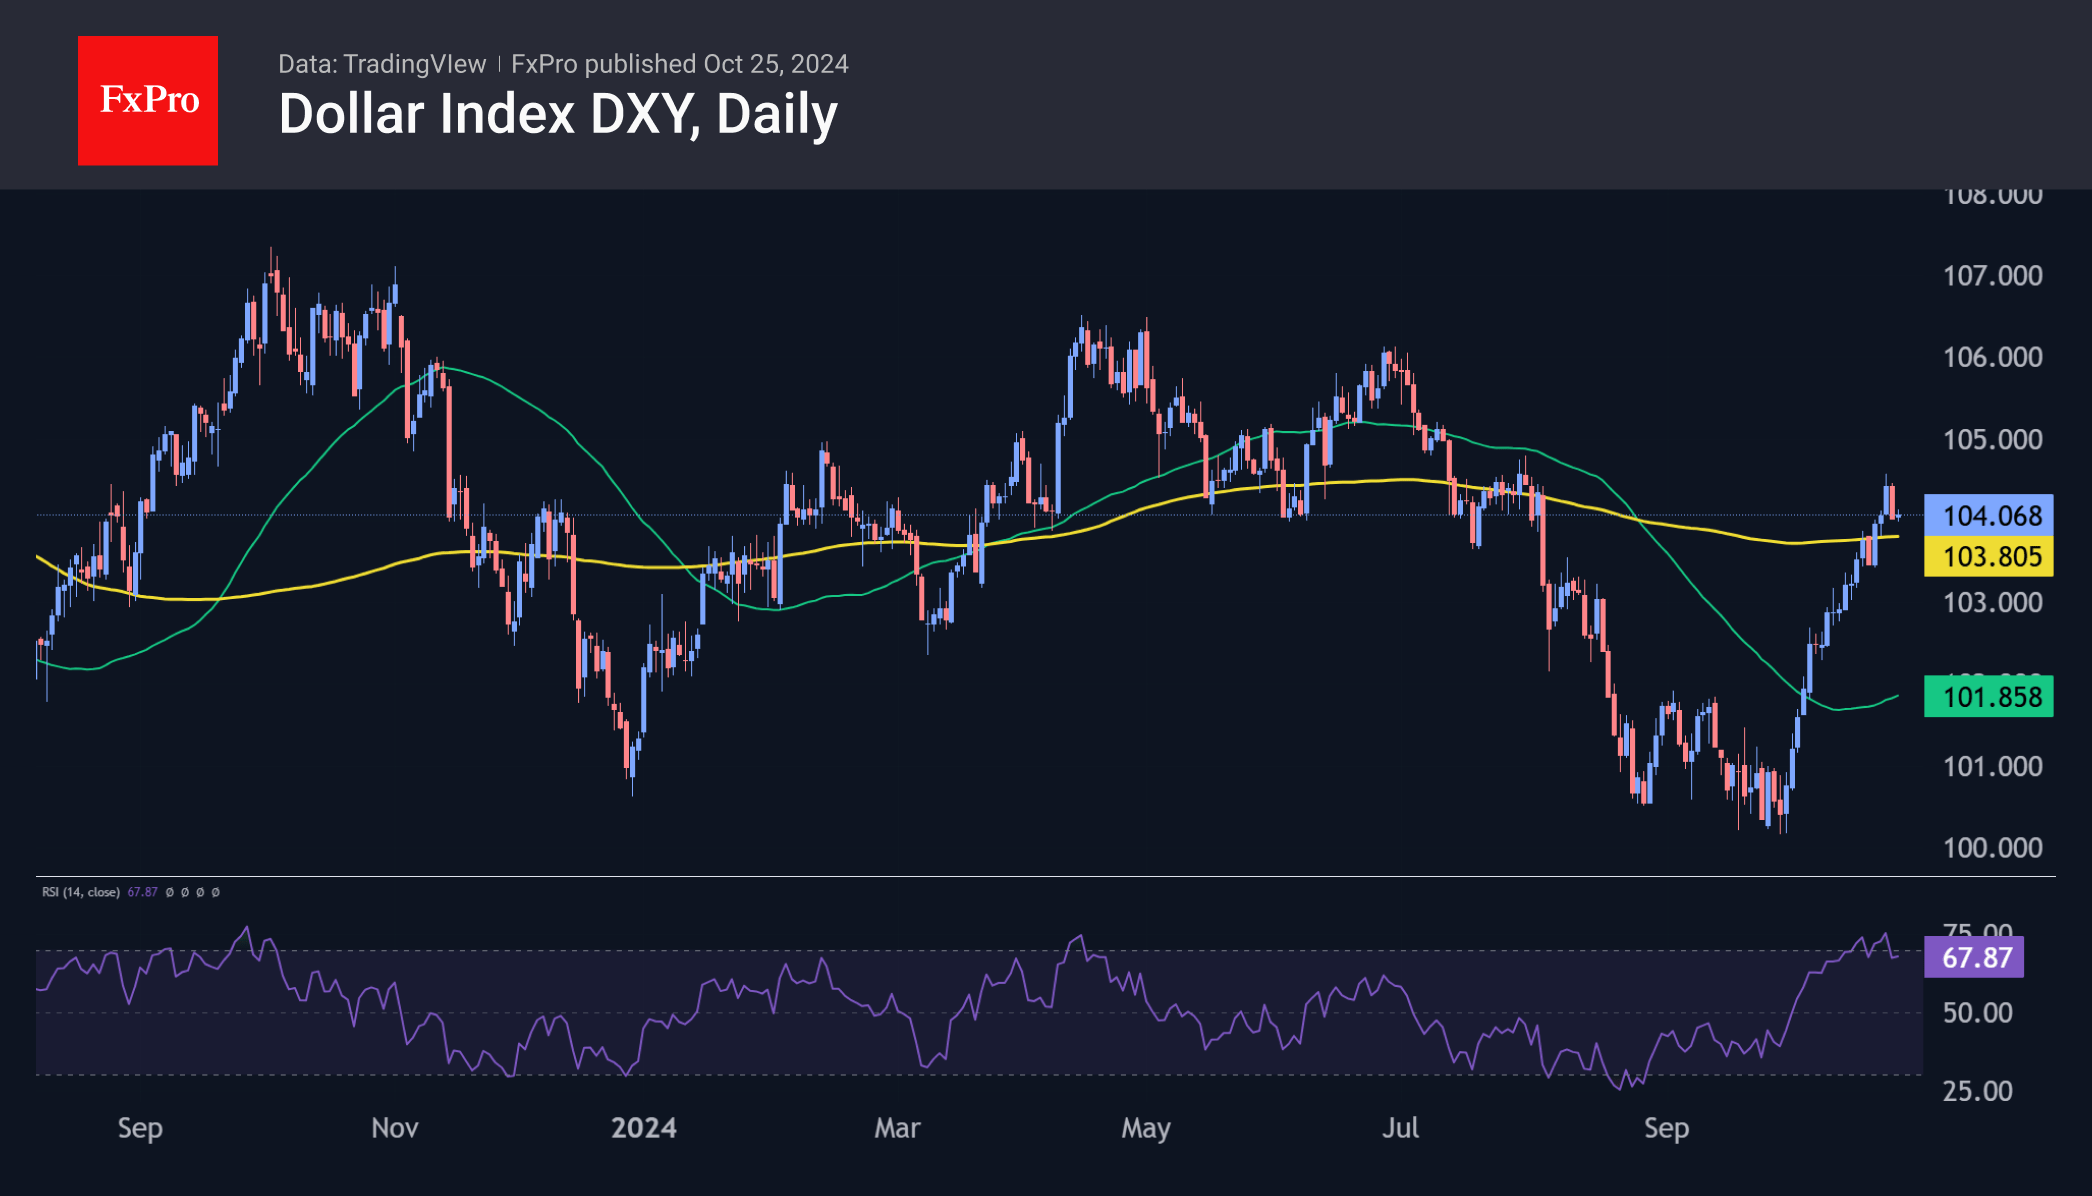
The Dollar Index has climbed 4.5% over the past four weeks, a movement that’s not unusual compared to longer and sharper rallies in recent years.
However, what stands out is that equities and gold are also on the rise alongside it. It’s probably more accurate to talk about a decline in competitors rather than a strengthening of the dollar.
The drop in U.S. bond prices (reflected in rising yields) supports the hypothesis and rejects the idea of a craving for defensive assets.
By the end of the week, this craving had abated somewhat, leading to a fall in risky assets and a correction in the dollar. Traders are de-risking and consolidating ahead of a series of important market events in early November.
There are three potential technical targets for the USD pullback from the current level of 104. The first is the 200-day moving average at 103.8. The second is the intermediate Fibonacci retracement level of 76.8% of the advance at 103.33. The third is the classic 61.8% retracement to 102.7.
Dominant Dollar Breaks Key Resistance Alongside 10-Year Yield
Dollar emerged as the unequivocal winner in the currency markets last week. Both Dollar Index and 10-year US Treasury Yield surged through their respect technically significant 55 W EMA resistance. It remains to be seen whether traders are positioning ahead of the US presidential election results, which are less than two weeks away. However, the pullback in stock markets indicates that investors are exercising caution instead. In any case, the upcoming fortnight will be pivotal for markets in determining medium-term trends.
Conversely, Japanese Yen suffered an extended selloff, ending the week as the worst-performing major currency. Verbal interventions by Japanese officials had limited effect, likely hindered by ongoing political uncertainty surrounding the snap election. This uncertainty also weighed heavily on Nikkei, which saw significant declines. Additionally, subdued performance in Hong Kong and Chinese stocks contributed to the regional weakness. Yen's weakness was mirrored by New Zealand Dollar and Australian Dollar, both of which closed near the bottom of the performance chart.
Meanwhile, European occupied middle ground. Euro displayed resilience despite intensified discussions within ECB about accelerating monetary easing measures. Canadian Dollar was among the firmer currencies last week, alongside Swiss Franc. However, their strength was modest, and neither currency matched the dominance exhibited by the greenback.
Investor Caution Grows Ahead of US Payrolls and Presidential Election
Investors are turning increasingly cautious as the global markets prepare for a high-stakes two weeks ahead, marked by the upcoming US non-farm payroll report and a tightly contested US presidential election. Last week, both DOW and S&P 500 ended their recent winning streaks, closing with significant declines. Although NASDAQ managed a record intraday high on Friday, the gains didn’t hold through to the close, reflecting an underlying cautious tone. Meanwhile, 10-year Treasury yield to stood firm above 4.23% after strong rally, supporting Dollar, which closed as the best performing currency among majors.
The non-farm payroll report next week is expected to be pivotal for shaping the Fed’s anticipated easing cycle. Futures markets currently imply a 95.1% probability of a 25bps rate cut in November and a 74.6% chance of another 25bps reduction in December. However, these odds are likely to shift depending on the strength or weakness of the payroll report.
In addition, the US presidential election looms just under two weeks away, adding another layer of uncertainty to markets. The election remains tight, with Democratic candidate Kamala Harris and Republican candidate Donald Trump running neck-and-neck. The election’s outcome could bring significant shifts to fiscal policy, bond issuance, and even broader trade and foreign relations.
Given these unknowns, market responses are likely to be unpredictable. Rather than speculating on the election results or market reactions, it may be beneficial to focus on the technical picture.
S&P 500 should have formed a short term top at 5878.46 and some consolidations could be seen in the near term. Deeper retreat might be seen to 55 D EMA (now at 5679.09). But outlook will stay bullish as long as 5669.67 resistance turned support holds. The long term up trend would still be in favor to 6000 handle, or further to 61.8% projection of 4103.78 to 5669.67 from 5119.26 at 6086.98, at a later stage.
However, considering bearish divergence condition in both D MACD and RSI, firm break of 5669.67 will confirm medium term topping, and set up deeper correction back to channel support (now at 5445) or even further to 5119.26 structural support.
NASDAQ's rise from 15708.53 is still seen as the second leg of the corrective pattern from 18671.06 high. Firm break of 17767.79 support should confirm rejection by 18671.06, and the start of the third leg back towards 15708.53 support.
Both 10-Year Yield and Dollar Index Surge Past 55 W EMA, More Bullish Momentum on the Horizon?
US 10-year yield surged sharply last through 55 W EMA last week to close at 4.232. The development further affirmed the bullish case that whole correction from 4.997 has completed with three waves down to 3.603. Near term outlook will remain bullish as long as 3.995 support holds. Next near term target is 61.8% retracement of 4.997 to 3.603 at 4.464.
From a pure technical point of view, it's plausible that the up trend from 0.398 is ready to resume through 4.997 high. However, it's premature to make definitive judgments without considering the still uncertain fundamental picture. The eventual path of yield depends on whether the next US administration would flood the markets with bond issuance for its expansive fiscal policies.
Dollar Index also broke through 55 W EMA decisively last week. Further rally is now expected as long as 55 D EMA (now at 102.66) holds. Next target is 106.13 resistance.
Meanwhile, it should be emphasized again that Dollar Index has just drawn strong support from rising 55 M EMA (now at 99.86). Current development is raising the chance that whole correction from 114.77 has already completed, at 99.57 or 100.15. Further break of 106.13/107.34 resistance will solidify this bullish case, and target 114.77 again in the medium term.
While the upcoming NFP would have huge impact on Dollar the in the near term, the medium term path would hinge on the election result, and the impact on risk sentiment as well as treasury yields.
Yen Decouples from Nikkei Amid Japan's Political Uncertainty
Yen has unexpectedly decoupled from the Nikkei index over the past week. Despite Yen weakening beyond the significant 150 level against Dollar, Nikkei 225 has suffered notable declines, unable to capitalize on the traditionally positive effect a weaker Yen has on export-oriented stocks. The primary driver behind this divergence is the heightened political uncertainty stemming from the snap election in Japan. Meanwhile, attempts by Japanese authorities to arrest Yen's decline through weak verbal interventions have been largely ineffective.
Technically, Nikkei is approaching a critical support level at 37651.07 following the two-week decline. Firm break there should confirm that entire rebound from 31156.11 has completed with three waves up to 40257.34. In this, deeper fall should be seen back to 35253.34 first, as the third leg of the corrective pattern from 42426.77 commences.
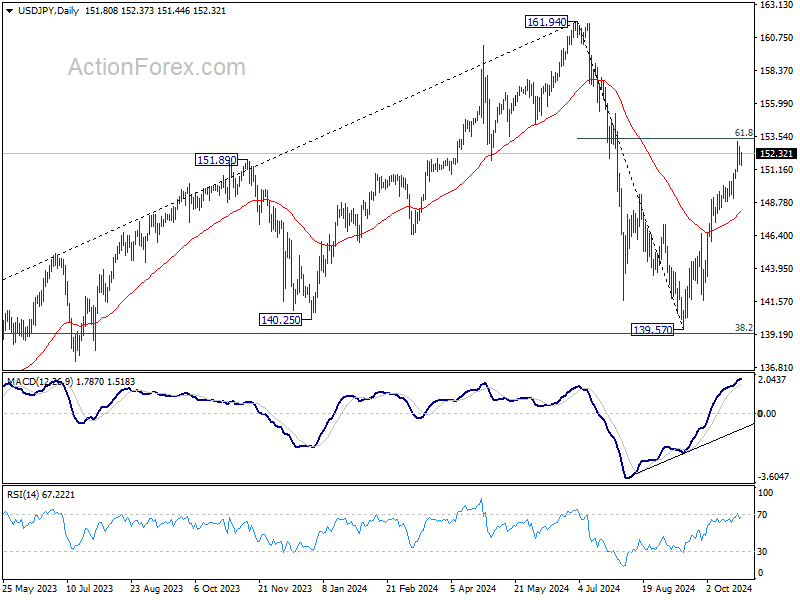
The key question is whether USD/JPY will recouple with Nikkei's movement if the index continues to slide. For now, further rise in USD/JPY would remain in favor as long as 55 D EMA (now at 148.16) holds. Decisive break of 61.8% retracement of 161.94 to 139.57 at 153.39 will extend the rally from 139.57, as the second leg of the corrective pattern from 161.94, to retest 161.94 high.
Euro Finds Support from PMI After Intense ECB Debates
It was an active week of commentary from ECB policymakers, with discussions centered on three key issues: whether to implement a 25 bps or 50 bps rate cut in December, the risk of inflation undershooting, and the need of lowering interest rates below neutral level. While dovish members pushing for more aggressive cuts are vocal, they currently remain a minority within the Governing Council.
While the debates put come pressure on Euro, the currency managed to stabilize, aided by the latest PMI data from Eurozone. The PMIs presented at worst a mixed but not wholly negative picture. While France showed signs of economic deterioration, Germany's data indicated improvement. An uptick in manufacturing activity helped offset a downtick in the services sector. Crucially, persistent inflation and wage growth are likely to keep ECB's hawkish members cautious about rapid easing, suggesting that a significant rate cut may not be imminent.
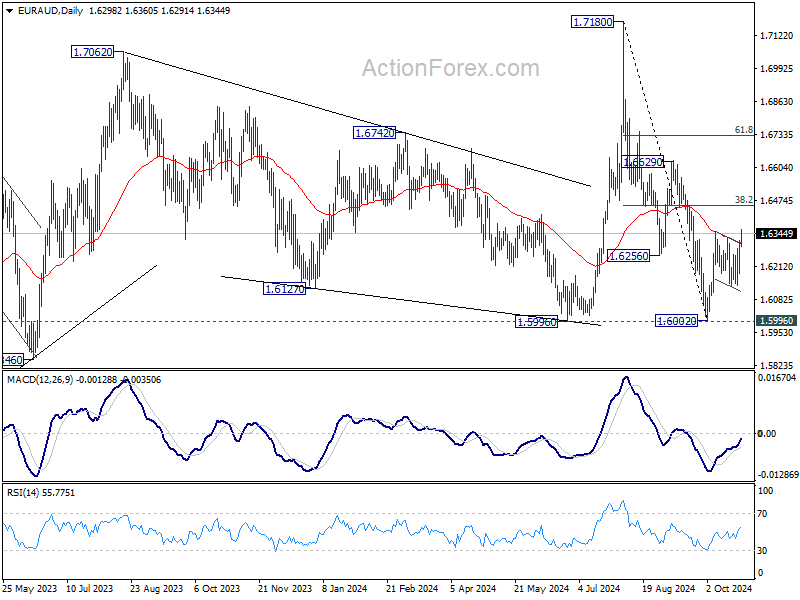
In the currency markets, Euro weakened against Dollar, influenced by Dollar's strength and expectations of divergent monetary policies. However, the selloff against British Pound has slowed, and Euro remains range-bound against Swiss Franc. Notably, EUR/AUD is showing signs of strength as the rebound from 1.6002 gains momentum.
Technically, EUR/AUD's fall from 1.7180 could have completed with three waves down to 1.6002, after defending 1.5996 key support. Further rise is now in favor to 38.2% of 1.7180 to 1.6002 at 1.6452. Sustained break there should confirm near term bullish reversal, and target 61.8% retracement at 1.6730 and above.
USD/CAD Weekly Outlook
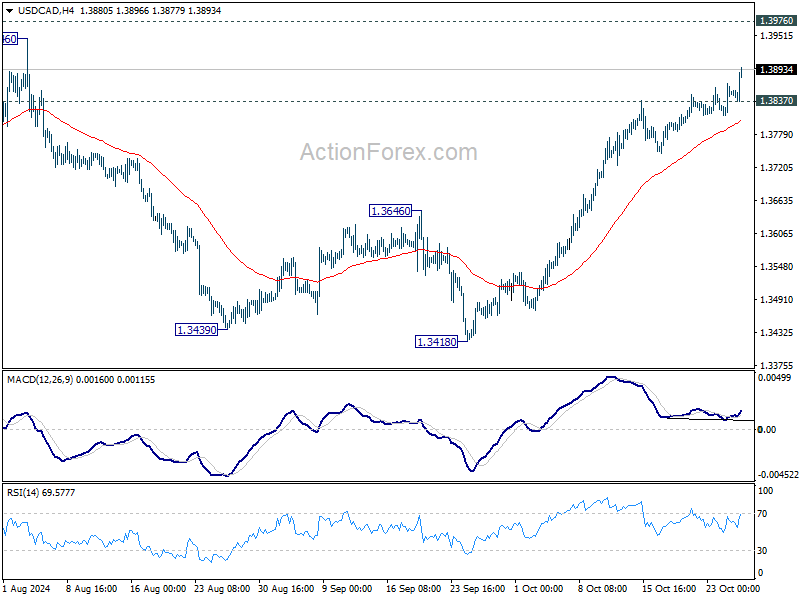
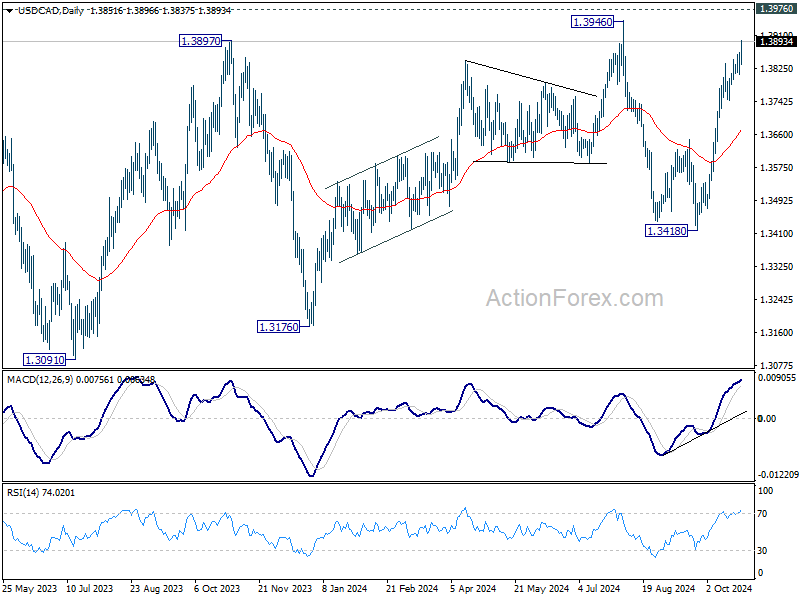
USD/CAD's rally from 1.3418 continued last week and there is no clear sign of topping yet. Initial bias stays on the upside this week for 1.3946/76 resistance zone. On the downside, below 1.3837 minor support will turn intraday bias and bring consolidations first.
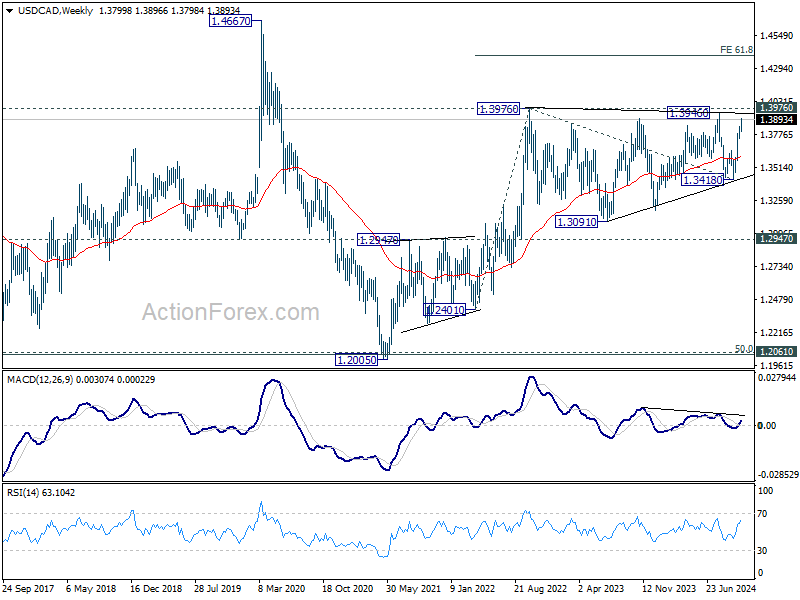
In the bigger picture, sideway consolidation pattern from 1.3976 (2022 high) might still extend further. While another decline cannot be ruled out, strong support should emerge above 1.2947 resistance turned support to bring rebound. Rise from 1.2005 (2021 low) is still in favor to resume at a later stage. Decisive break of 1.3976 will target 61.8% projection of 1.2401 to 1.3976 from 1.3418 at 1.4391.
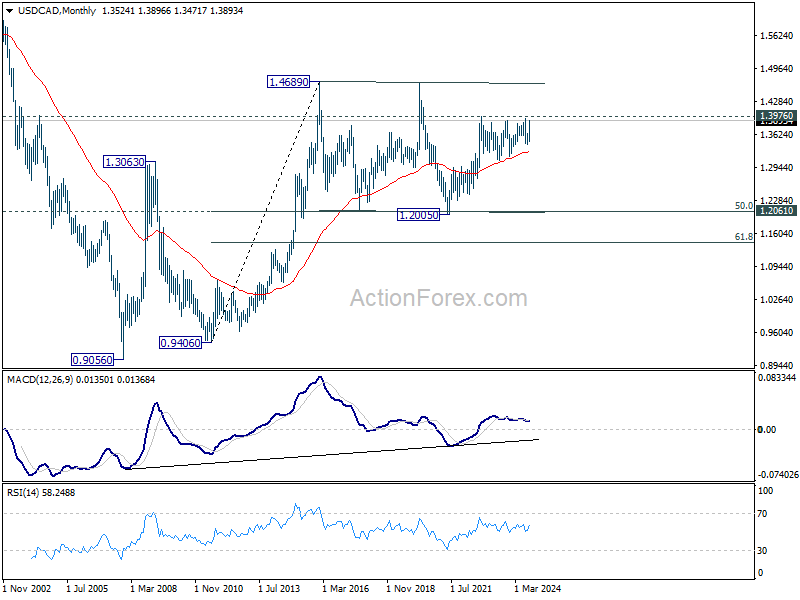
In the longer term picture, price actions from 1.4689 (2016 high) are seen as a consolidation pattern, which might have completed at 1.2005. That is, up trend from 0.9506 (2007 low) is expected to resume at a later stage. This will remain the favored case as long as 1.2947 resistance turned support holds.
EUR/USD Weekly Outlook
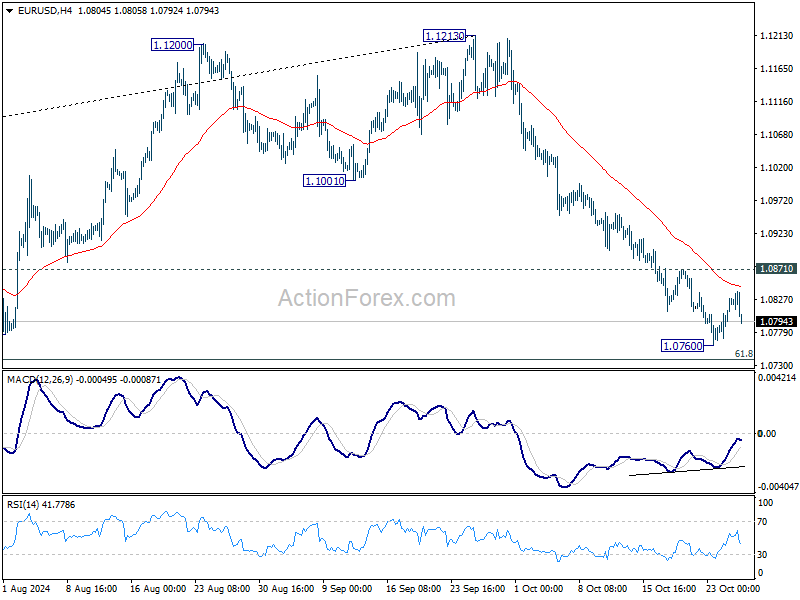
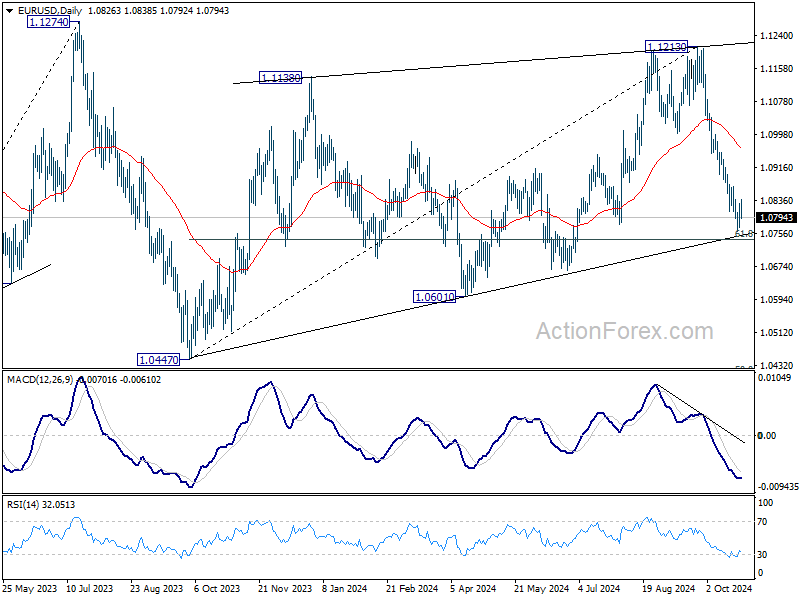
EUR/USD's fall from 1.1213 extended to as low as 1.0760 last week before forming a temporary bottom there and recovered. Initial bias remains neutral this week for consolidations. Further decline is expected as long as 1.0871 resistance holds. Below 1.0760 will target 61.8% retracement of 1.0447 to 1.1213 at 1.0740. Firm break there will target 1.0601 support next. However, considering bullish convergence condition in 4H MACD, break of 1.0871 will indicate short term bottoming, and turn bias back to the upside for 55 D EMA (now at 1.0962).
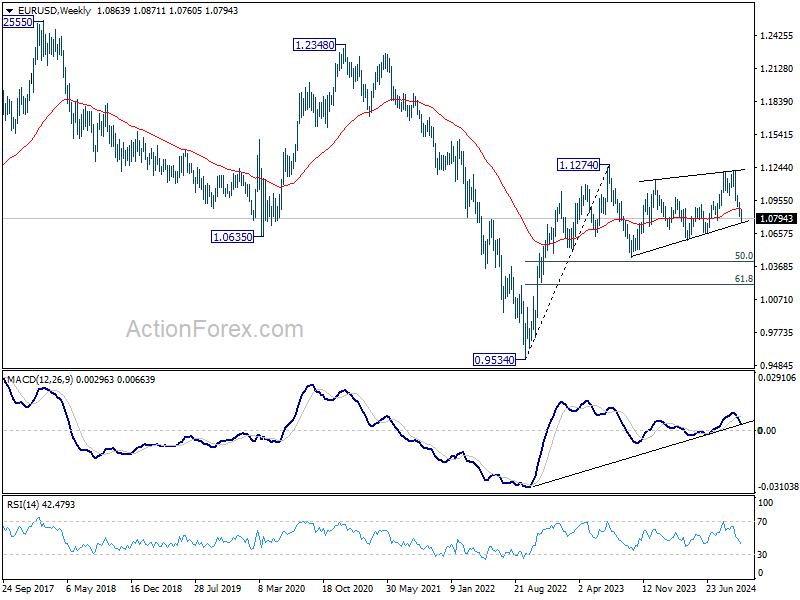
In the bigger picture, price actions from 1.1274 (2023 high) are seen as a consolidation pattern to up trend from 0.9534 (2022 low), with fall from 1.1213 as the third leg. Downside should be contained by 50% retracement of 0.9534 (2022 low) to 1.1274 at 1.0404, to bring up trend resumption at a later stage.
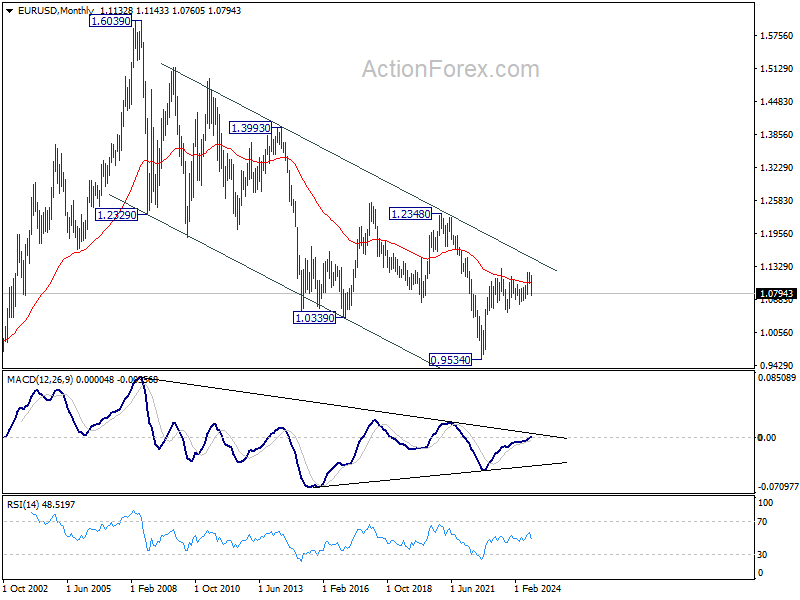
In the long term picture, a long term bottom is in place at 0.9534 (2022 low). But for now, EUR/USD is struggling to sustain above 55 M EMA (now at 1.1011). Outlook is neutral at best at this point.
USD/JPY Weekly Outlook
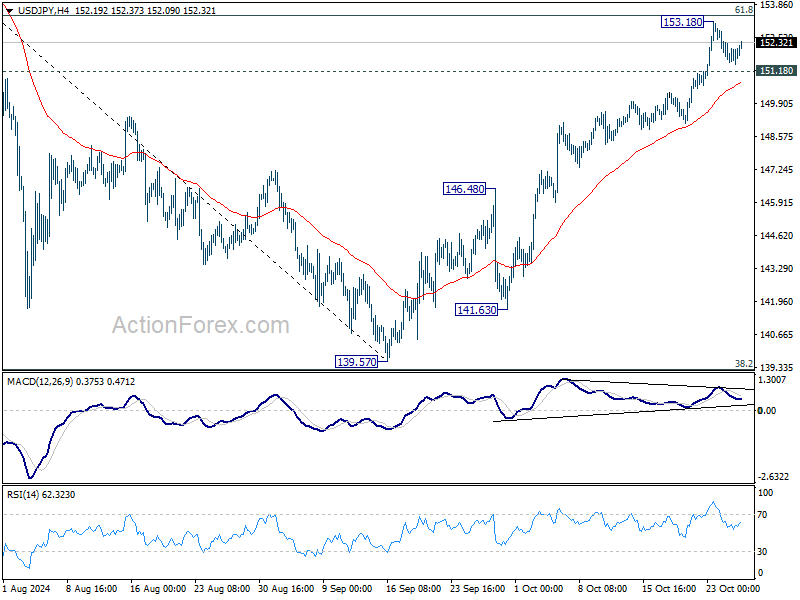
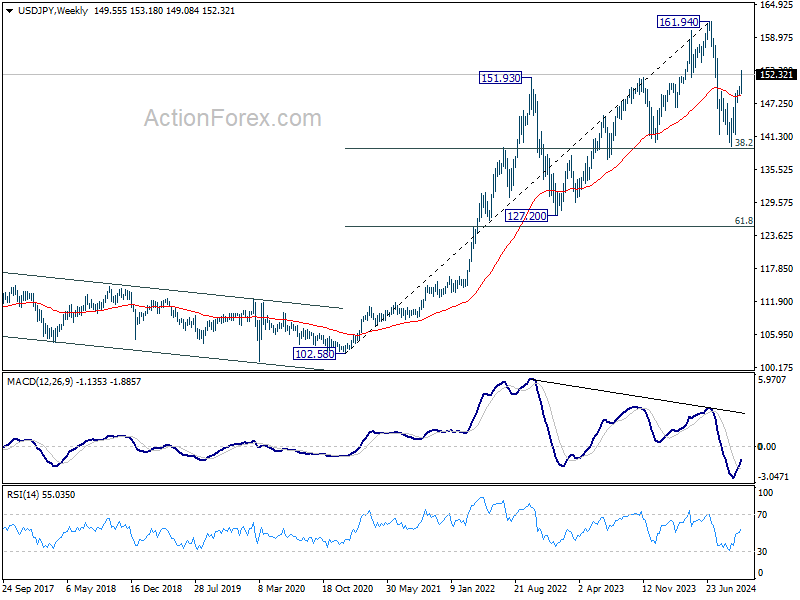
USD/JPY's rebound from 139.57 extended to as high as 153.18 last week but formed a temporary top there and retreat. Initial bias remains neutral this week for consolidations first. Further rally is in favor as long as 151.18 minor support holds. Sustained trading above 61.8% retracement of 161.94 to 139.57 at 153.39 will pave the way to retest 161.94 high. Nevertheless, considering bearish divergence condition in 4H MACD, break of 151.18 will indicate short term topping, and turn bias to the downside for 55 D EMA (now at 148.05).
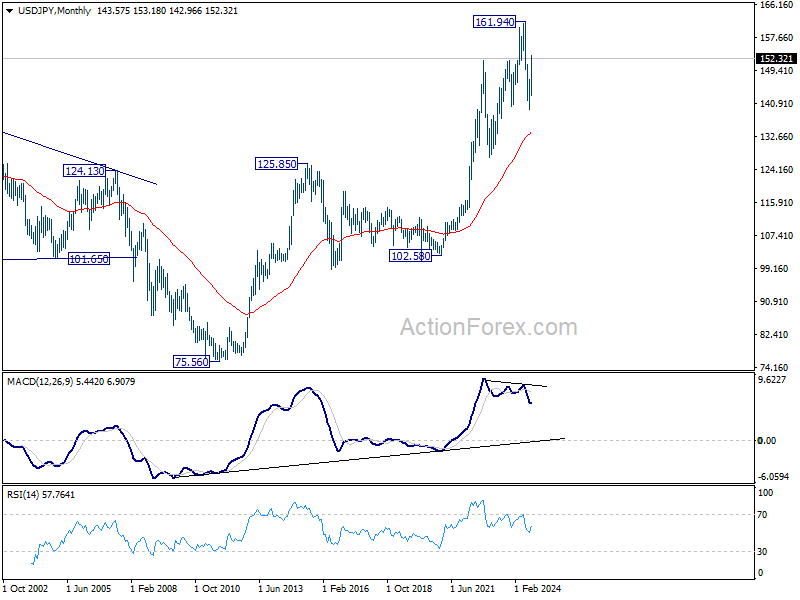
In the bigger picture, price actions from 161.94 are seen as a corrective pattern to rise from 102.58 (2021 low). The range of medium term consolidation should be set between 38.2% retracement of 102.58 to 161.94 at 139.26 and 161.94. Nevertheless, sustained break of 139.26 would open up deeper medium term decline to 61.8% retracement at 125.25.

In the long term picture, it's still early to conclude that up trend from 75.56 (2011 low) has completed. However, a medium term corrective phase should have commenced, with risk of deep correction towards 55 M EMA (now at 133.87).
GBP/USD Weekly Outlook
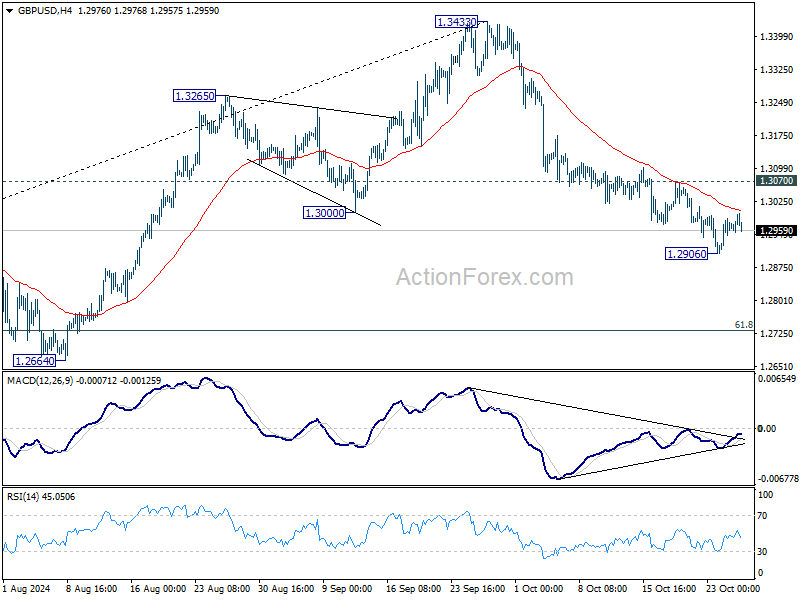
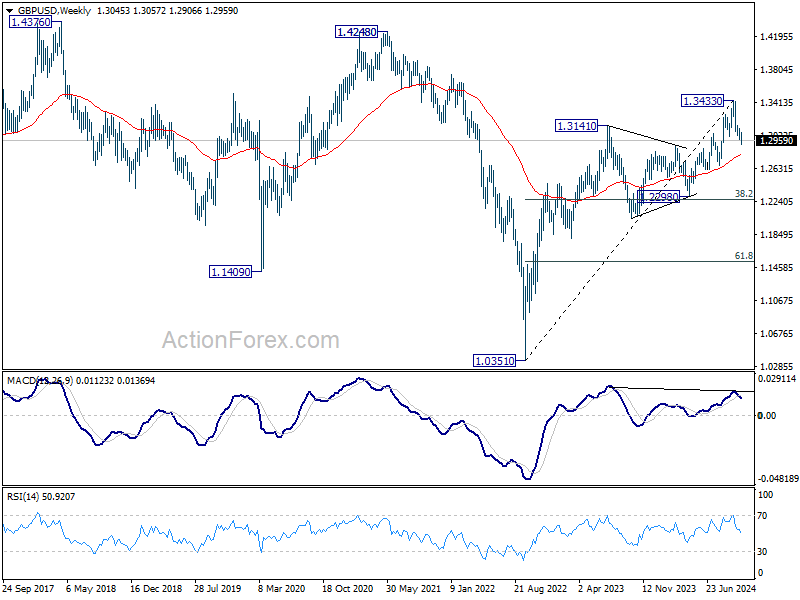
GBP/USD's fall from 1.3433 extended to as low as 1.2906 last week, but formed a temporary low there and recovered. Initial bias remains neutral this week for consolidations. Further decline is expected as long as 1.3070 minor resistance holds. Below 1.2906 will target 61.8% retracement of 1.2298 to 1.3433 at 1.2732. However, considering bearish divergence condition in 4H MACD, firm break 1.3070 resistance will indicate short term bottoming, and turn bias back to the upside for stronger rebound.
In the bigger picture, considering mildly bearish divergence condition in D MACD, a medium term top is likely in place at 1.3433 already. Price actions from there are seen as correction to whole up trend from 1.0351 (2022 low). Deeper decline would be seen to 38.2% retracement of 1.0351 to 1.3433 at 1.2256, which is close to 1.2298 structural support. Strong support should be seen there to bring rebound.
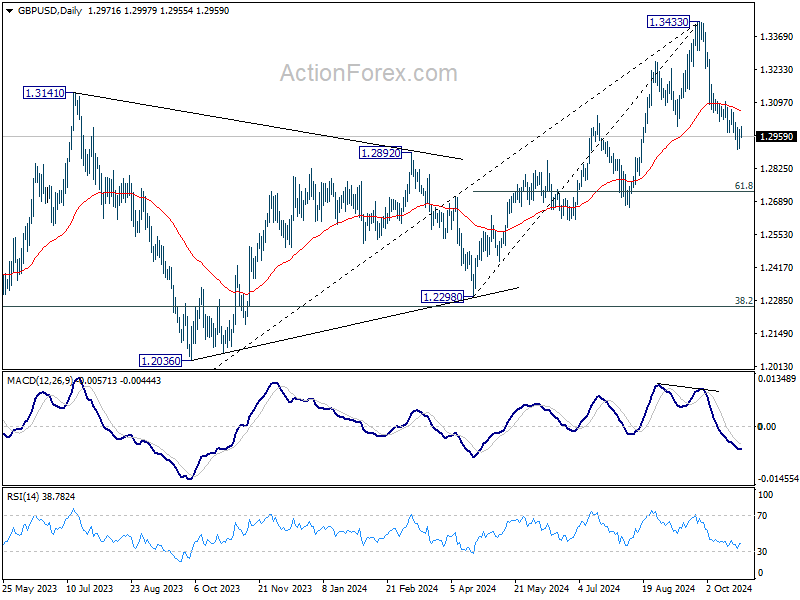
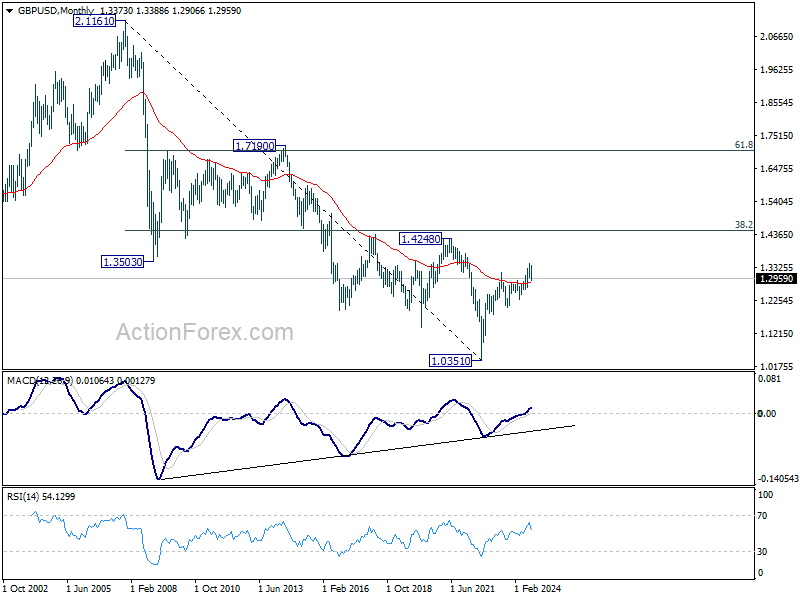
In the long term picture, as long as 1.2298 support holds, rise from 1.0351 long term bottom is expected to continue. The strong break of 55 M EMA (now at 1.2811) is a sign of bullish trend reversal. Yet, break of 1.4248 structural resistance is needed confirm. Otherwise, price actions from 1.0351 could just be part of a consolidation pattern.
USD/CHF Weekly Outlook
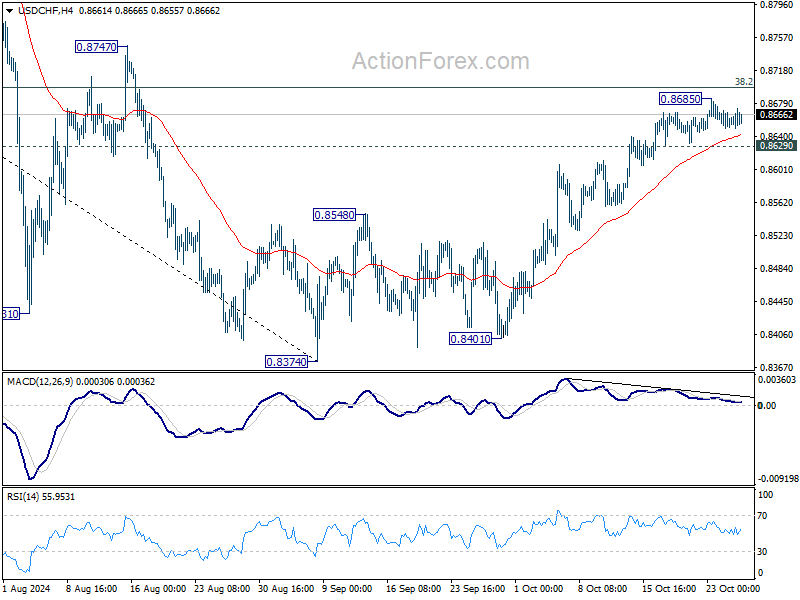
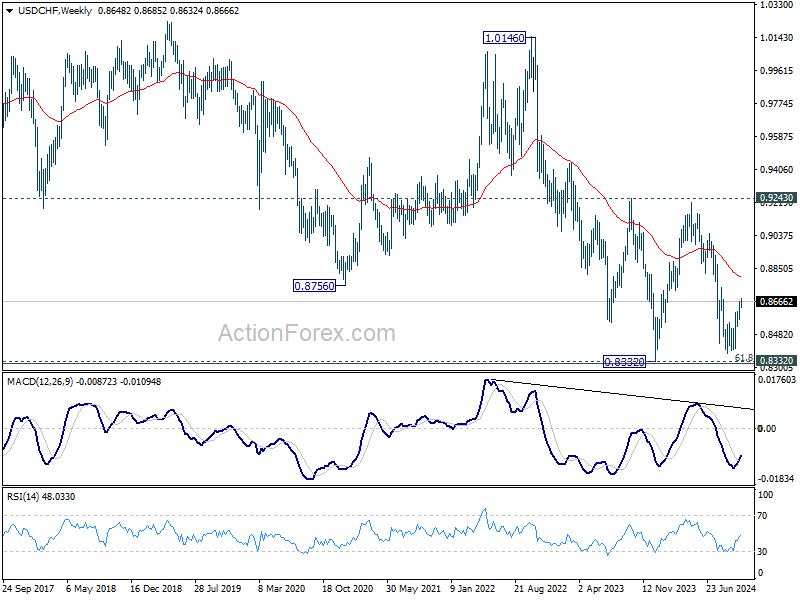
USD/CHF's rise from 0.8374 continued last week but formed a temporary top at 0.8685. Initial bias remains neutral this week first. Further rise is expected as long as 0.8629 minor support holds. Decisive break of 38.2% retracement of 0.9223 to 0.8374 at 0.8698 will argue that fall from 0.9223 has completed after defending 0.8332 low. Further rally should then be seen to 61.8% retracement at 0.8899 next. However, considering bearish divergence condition in 4H MACD, firm break of 0.8629 support will indicate short term topping, and turn bias back to the downside for 55 D EMA (now at 0.8601).
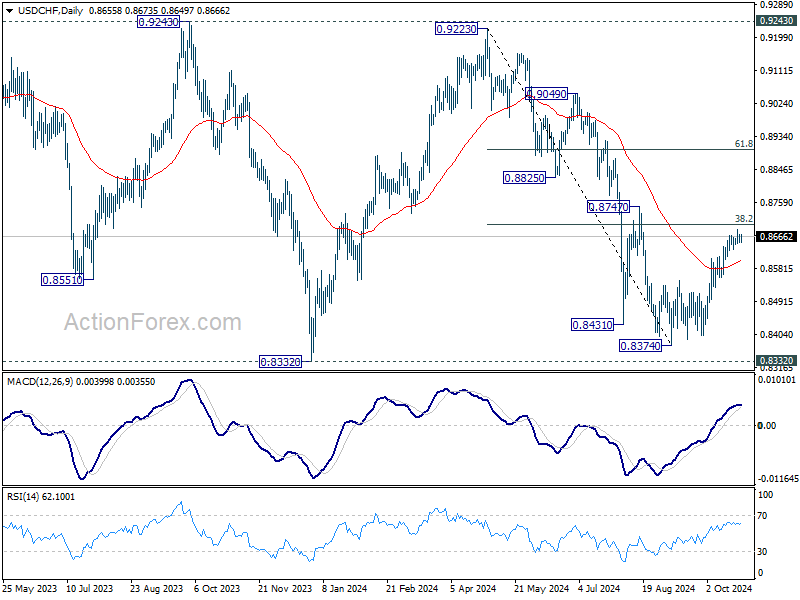
In the bigger picture, price actions from 0.8332 (2023 low) are currently seen as a medium term corrective pattern, with fall from 0.9223 as the second leg. Strong support could be seen from 0.8332 to bring rebound. Yet, overall outlook will continue to stay bearish as long as 0.9243 resistance holds. Firm break of 0.8332, however, will resume larger down trend from 1.0146 (2022 high).
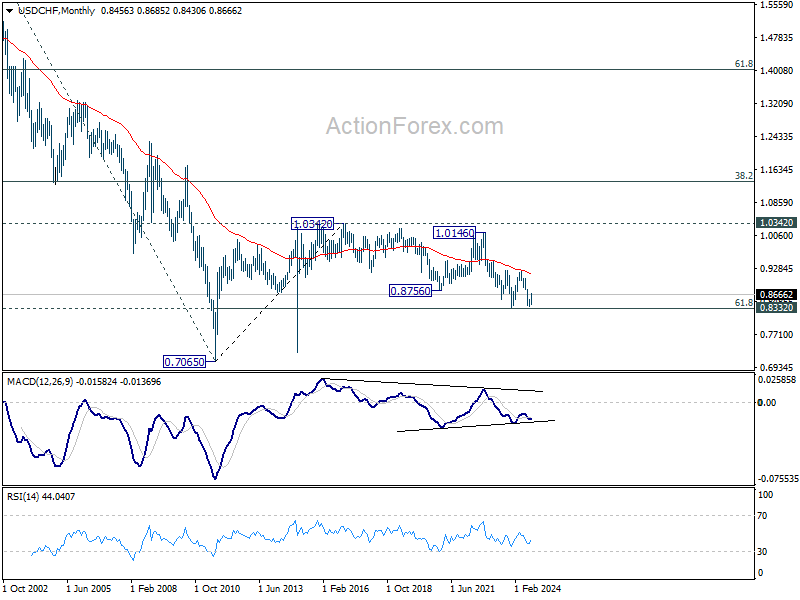
In the long term picture, price action from 0.7065 (2011 low ) are seen as a corrective pattern to the multi-decade down trend from 1.8305 (2000 high). Fall from 1.0342 (2016 high) is seen as the second leg. Rejection by 55 M EMA suggest that this fall is in progress. Break of 61.8% retracement of 0.7065 to 1.0342 at 0.8317 will pave the way back to 0.7065.
AUD/USD Weekly Report
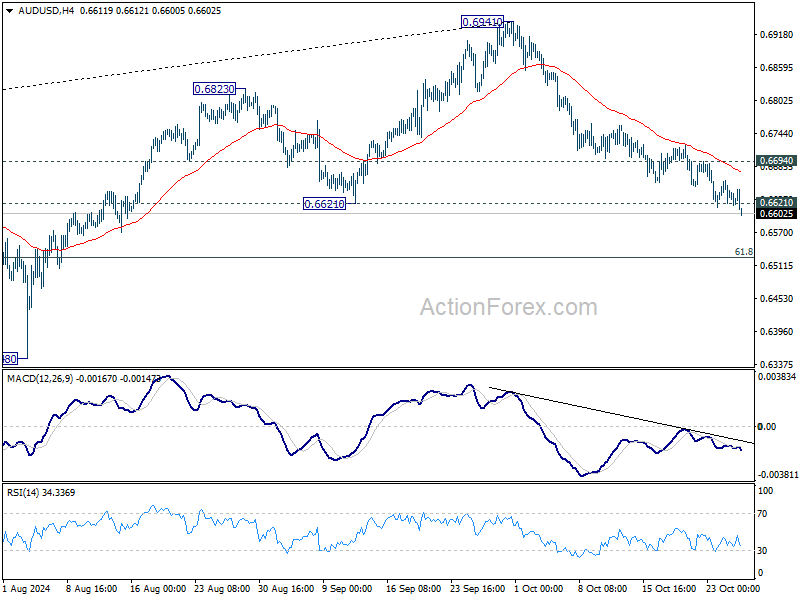
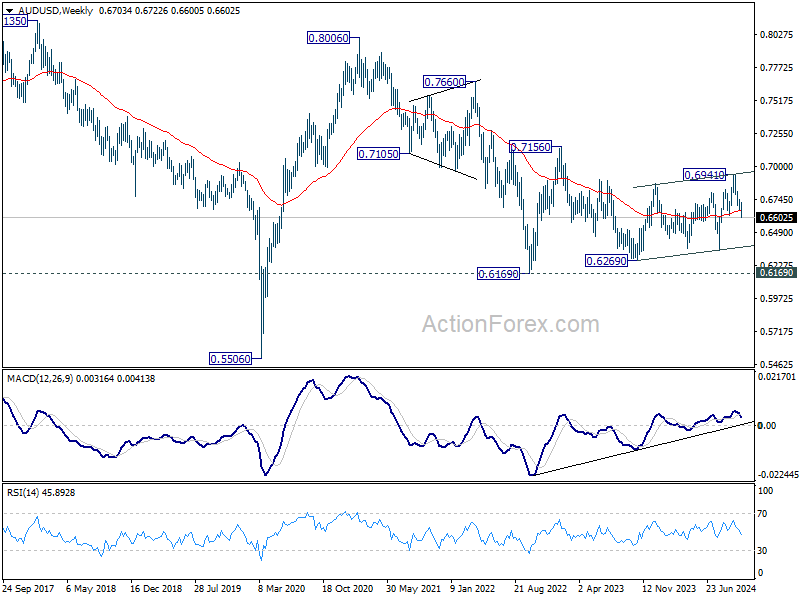
AUD/USD's fall from 0.6941 continued last week and the break of 0.6621 resistance suggest near term bearish reversal. Initial bias stays on the downside this week for 61.8% retracement of 0.6269 to 0.6941 at 0.6526 next. On the upside, above 0.6694 minor resistance will turn intraday bias neutral and bring consolidations first.
In the bigger picture, rise from 0.6269 (2023 low) should have completed with three waves up to 0.6941. Corrective pattern from 0.6169 (2022 low) is now extending with another falling leg. Deeper decline would be seen back to 0.6269 as sideway trading extends.
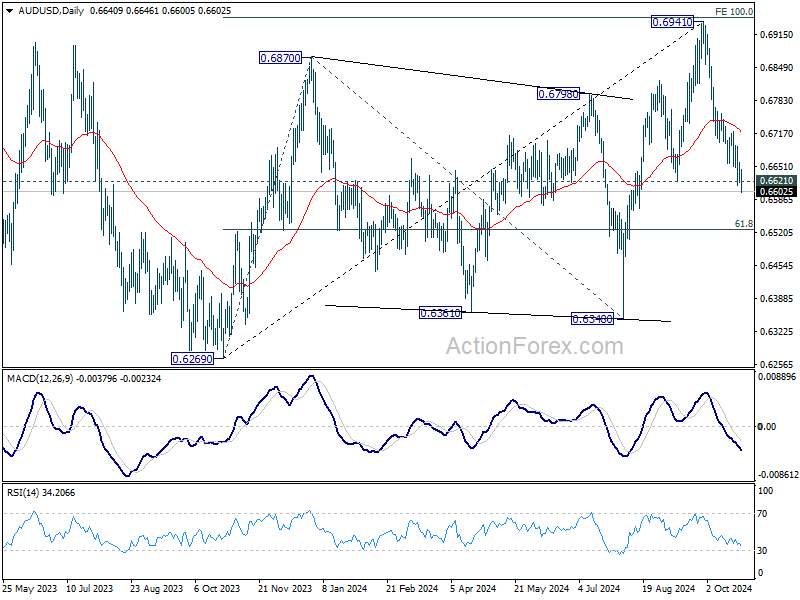
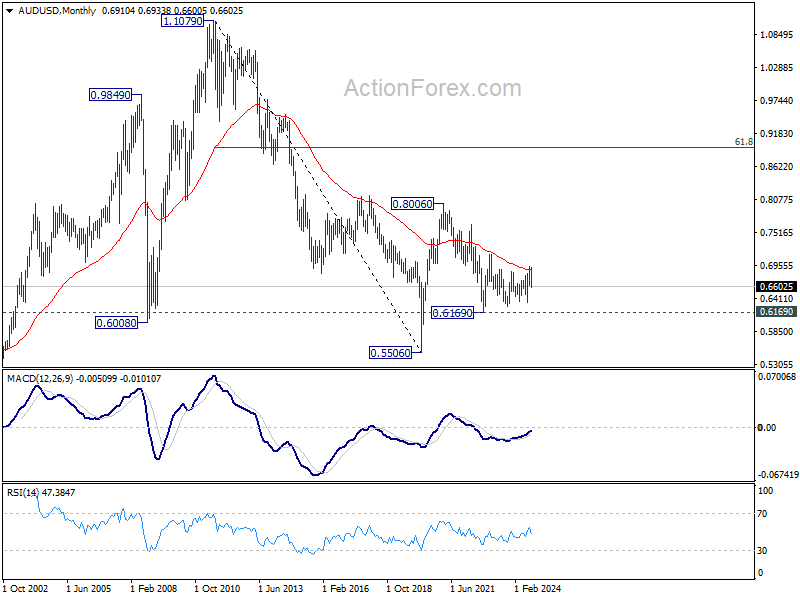
In the long term picture, the down trend from 1.1079 (2011 high) should have completed at 0.5506 (2020 low) already. It's unsure yet whether price actions from 0.5506 are developing into a corrective pattern, or trend reversal. But in either case, fall from 0.8006 is seen as the second leg of the pattern. Firm of 0.7156 resistance will argue that the third leg has already started towards 0.8006.
USD/CAD Weekly Outlook
USD/CAD's rally from 1.3418 continued last week and there is no clear sign of topping yet. Initial bias stays on the upside this week for 1.3946/76 resistance zone. On the downside, below 1.3837 minor support will turn intraday bias and bring consolidations first.
In the bigger picture, sideway consolidation pattern from 1.3976 (2022 high) might still extend further. While another decline cannot be ruled out, strong support should emerge above 1.2947 resistance turned support to bring rebound. Rise from 1.2005 (2021 low) is still in favor to resume at a later stage. Decisive break of 1.3976 will target 61.8% projection of 1.2401 to 1.3976 from 1.3418 at 1.4391.
In the longer term picture, price actions from 1.4689 (2016 high) are seen as a consolidation pattern, which might have completed at 1.2005. That is, up trend from 0.9506 (2007 low) is expected to resume at a later stage. This will remain the favored case as long as 1.2947 resistance turned support holds.