
Sample Category Title
Why Fed’s Warsh Could Trigger Silver’s Next Selloff Without Saying Much
Silver traders are focused on Thursday's US Non-Farm Payrolls report, but the metal's next major move could begin a day earlier. After days of listless sideways trading, Silver has failed to generate any meaningful recovery despite stabilizing above recent lows. That lack of buying enthusiasm suggests the recent downtrend is still intact. Before payrolls even arrive, today's appearance by Federal Reserve Chair Kevin Warsh may determine whether sellers regain full control.
The reason has less to do with what Warsh is expected to announce than with how he believes a central bank should communicate. Warsh has long argued that policymakers should stop cushioning markets with constant guidance. He skipped publishing a dot plot at his first FOMC meeting and made clear the Fed should "talk less." Under that philosophy, silence itself becomes policy. Investors are no longer searching for reassuring hints about future rate cuts—they are watching to see whether Warsh refuses to challenge the market's increasingly hawkish interpretation of incoming economic data.
That is why today's appearance at the ECB Forum in Sintra carries unusual significance. Warsh does not need to promise a September rate hike to tighten financial conditions. If he repeats that inflation must be defeated regardless of short-term growth concerns, endorses letting markets respond directly to stronger data, or hints that balance sheet reduction should play a larger role alongside higher interest rates, Treasury yields could climb further and the Dollar could strengthen. Those moves would be particularly damaging for Silver, which is highly sensitive both to rising real yields and to shrinking global liquidity.
Thursday's payrolls report still has the potential to reinforce or challenge that narrative, but traders may not wait that long. A hawkish tone from Warsh could encourage investors to position for another strong labor market report before the data are even released. In that sense, his communication style may itself become part of the tightening process, allowing markets to do much of the Fed's work.
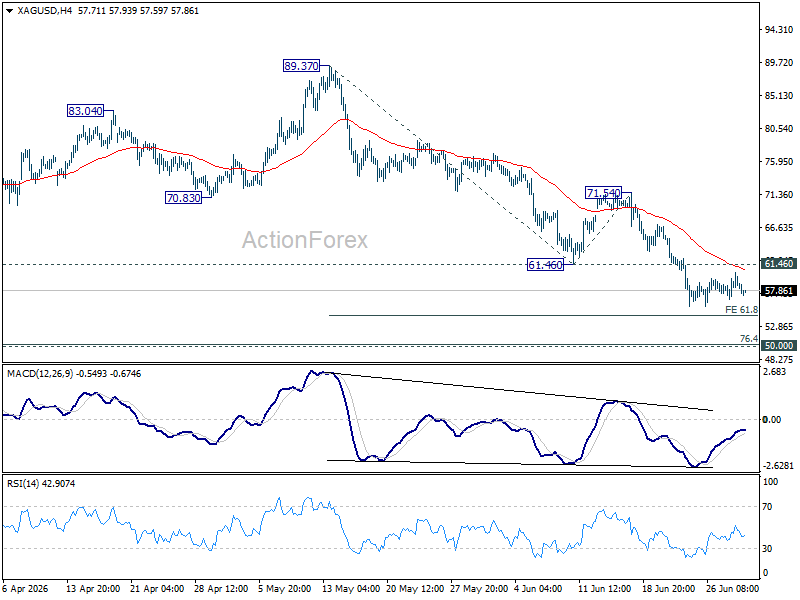
The technical picture already favors the bears. Silver continues to struggle below 61.46 support turned resistance, indicating that the recent recovery lacks conviction. The next downside objective remains the key psychological level at 50, which sits close to 76.4% retracement of 28.28 to 121.83 at 50.35.
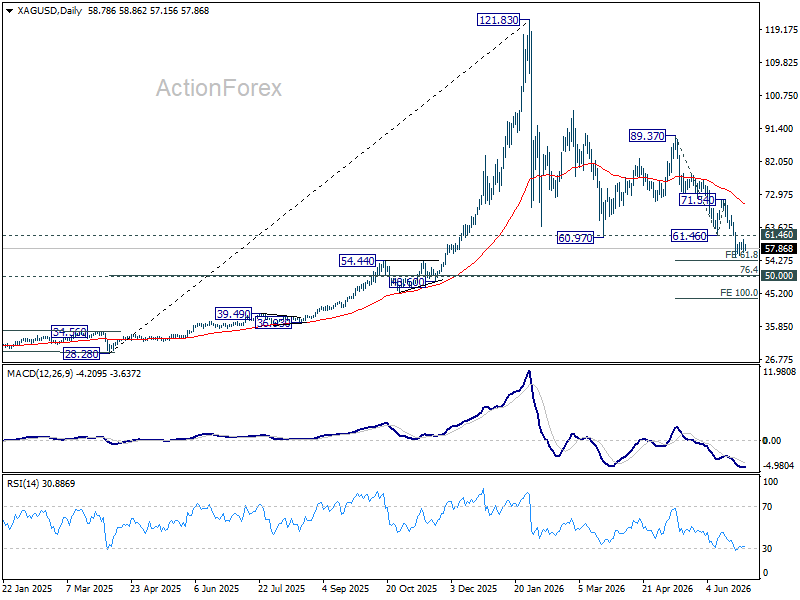
A sustained break beneath that area would signal a much deeper decline toward 100% projection of 89.37 to 61.46 from 71.54 at 43.63, or even further to 40 before finding a bottom.
EU Seeks New Balance in Relationship with China
The EU and China have a strong reciprocal trade relationship, with impressive flows of goods and services in both directions. This relationship has come under increasing pressure in recent years. When China was still the manufacturing factory of the world and mainly created products with low added value, the threat to the EU economy was limited. In recent years, however, China has changed its industrial policy by increasingly focusing on the development and production of high-tech goods. This puts pressure on the relationship between the two giants because China has become a major competitor for key industries in the EU, while the Chinese market remains highly shielded from foreign producers and investors. In addition, the EU is increasingly concerned about China's strategic power, including Europe's high dependence on China for critical materials for the digital and energy transitions. The EU is now looking at how it can balance trade with China without shooting itself in the foot. China has already clearly indicated that it will take countermeasures if the EU goes against its interests. The fact that the EU takes this threat seriously is evident from the cautious outcome of the meeting of European leaders in June. This meeting did not end in a large-scale plan with trade measures, but in a request to the European Commission to investigate which instruments can be used to deal with all kinds of global trade threats (unofficially especially China's industrial overcapacity). The EU is clearly committed to strengthening its trade and industrial policy, but continues to emphasise that communication and cooperation are still the basis of its relationship with other countries, including China.
EU flooded with Chinese goods
The EU's trade deficit with China for goods has grown sharply since the 2000s. This is not an unsurprising evolution, as economic activity in emerging economies typically increases a lot faster than developed economies. The big problem the EU is currently facing is that China's exports are growing strongly (increasingly in important economic sectors for the EU) and imports are not keeping up. The middle class in China has increased spectacularly in numbers, but the spending of this group is not growing at the same rate. Culprits here include the country's ongoing real estate crisis and limited social safety net. Consumers in China are keeping their fingers on the purse strings and producers are not getting enough sales of their products on the domestic market. The oversupply of certain products was also exacerbated by the government's market-distorting investment policy, in which strategic goals and local interests led to overproduction. Due to this overproduction, Chinese producers are increasingly forced to look for markets abroad. The more hostile trade policy of the US under Trump has added additional pressure, pushing Chinese exporters towards the EU even more.
EU wants to set boundaries
EU industries are increasingly outcompeted by Chinese imports and the EU's dependence on China is increasing. Aggravating circumstances in the relationship with China include the asymmetries between China's market openness and the EU and the restrictions on the free movement of Chinese currency.
There are therefore more and more voices within the EU calling for additional measures to slow down these developments. There are good reasons to do so, ranging from protecting EU jobs to safeguarding European geopolitical and economic independence. There are also growing warnings about the strategic risks associated with the high share of Chinese components and software in key infrastructure in the EU.
The EU has already launched a whole host of initiatives to diversify imports of goods and to better protect the internal market, for example from imports of oversubsidised goods. These include the Critical Raw Materials Act, the Industrial Accelerator Act, the Cyber Security Act, the Net-Zero Industry Act and the abolition of the de minimis exemption for e-commerce shipments under 150 euros from third countries.
Circumvention and retaliation
The EU has long been wary of perceived attempts by China to circumvent the EU’s protective measures. One example is the questions that are raised around the large sums that China is investing in Morocco, a country with which the EU has an extensive free trade agreement. The EU fears that these investments are at least partly intended to ship the overproduction from China to the EU via Morocco, without creating any significant added value in Morocco. The latter is an important condition (cf. rules of origin) for the products to fall under the trade agreement and be exported to the EU duty-free.
China is also less and less afraid to use tough language and actions to prevent other countries from tightening their trade policies. Just think of the rapid escalation of tariffs and export restrictions between the US and China in 2025. The trade arsenal that China can use to protect its own interests is extensive. On the one hand, China can impose import duties and restrictions. At the beginning of this year, there were warnings that the country would launch anti-dumping and anti-subsidy investigations into EU goods, including French wine, if the EU took trade measures against China. Even more damaging than the import instrument is China's ability to limit or completely halt exports of critical materials needed for the climate and technology transition.
EU keeps lines of communication open
Given this consideration, it is not surprising that the meeting of European leaders on this issue in June 2026 did not lead to a large package of new tariffs, quotas or trade restrictions. Yet the meeting was not in vain. The European Commission has now been given the task of examining what measures the EU can take to address the "unsustainable" trade deficit with China. While its stance against China has toughened, the EU's emphasis communication and cooperation also remains strong, as proven by the establishment of a new consultation forum between the two power blocs, the EU-China Trade and Investment Consultation (TIC) mechanism. It is clear that the EU is serious about rebalancing its economic relationship with China, but that it plans to do so in a careful and measured way.
Eurozone CPI Slows to 2.8%, Strengthening Case for ECB Pause
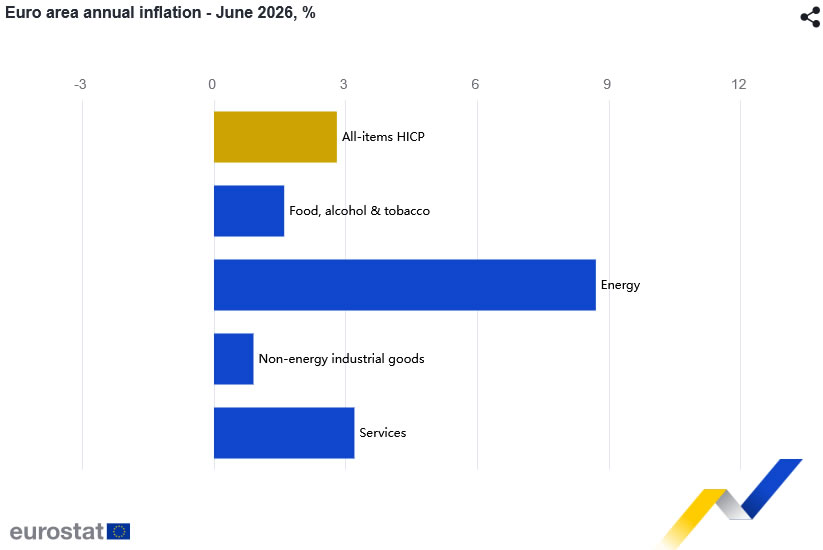
Eurozone inflation eased more than expected in June, reinforcing signs that price pressures are moderating following the recent decline in energy prices. Headline CPI slowed from 3.2% yoy to 2.8% yoy, below expectations of 3.0%. Core inflation, which excludes energy, food, alcohol and tobacco, fell from 2.6% yoy to 2.4% yoy, also below the consensus forecast of 2.5%.
The moderation was broad-based across the major inflation components. Energy inflation slowed from 10.8% yoy to 8.7% yoy as oil prices retreated following the easing of Middle East tensions. Services inflation also cooled from 3.5% yoy to 3.2% yoy, while food, alcohol and tobacco inflation eased from 1.9% yoy to 1.6%. Non-energy industrial goods inflation was unchanged at 0.9%, suggesting underlying goods price pressures remain well contained.
The data are likely to provide reassurance that the recent energy shock has not generated broader second-round inflation effects. With both headline and core inflation surprising on the downside, the figures strengthen the case for the ECB to leave interest rates unchanged at its next meeting while continuing to monitor whether lower energy costs feed further into services inflation and wage dynamics over the coming months.
| Indicator | Previous | Latest | Consensus | Comments |
|---|---|---|---|---|
| Headline CPI (YoY) | 3.2% | 2.8% | 3.0% | |
| Core CPI (YoY) | 2.6% | 2.4% | 2.5% | |
| Energy Inflation (YoY) | 10.8% | 8.7% | ||
| Services Inflation (YoY) | 3.5% | 3.2% | ||
| Food, Alcohol & Tobacco (YoY) | 1.9% | 1.6% | ||
| Non-Energy Industrial Goods (YoY) | 0.9% | 0.9% |
Brent: Surplus Spooks the Bulls
- Goldman Sachs expects an oil market surplus of 3 million BPD in 2027.
- Without Warsh’s help, Japan will be forced to resort to currency interventions.
The Dollar is consolidating ahead of Kevin Warsh’s speech in Sintra, Portugal, and the release of key US labour market data. A hawkish surprise from the new Fed Chair at the June FOMC meeting sent financial markets into a tailspin, leading to a rise in Treasury yields and the greenback. If the central bank chief hints that he was misunderstood, everything will be turned on its head.
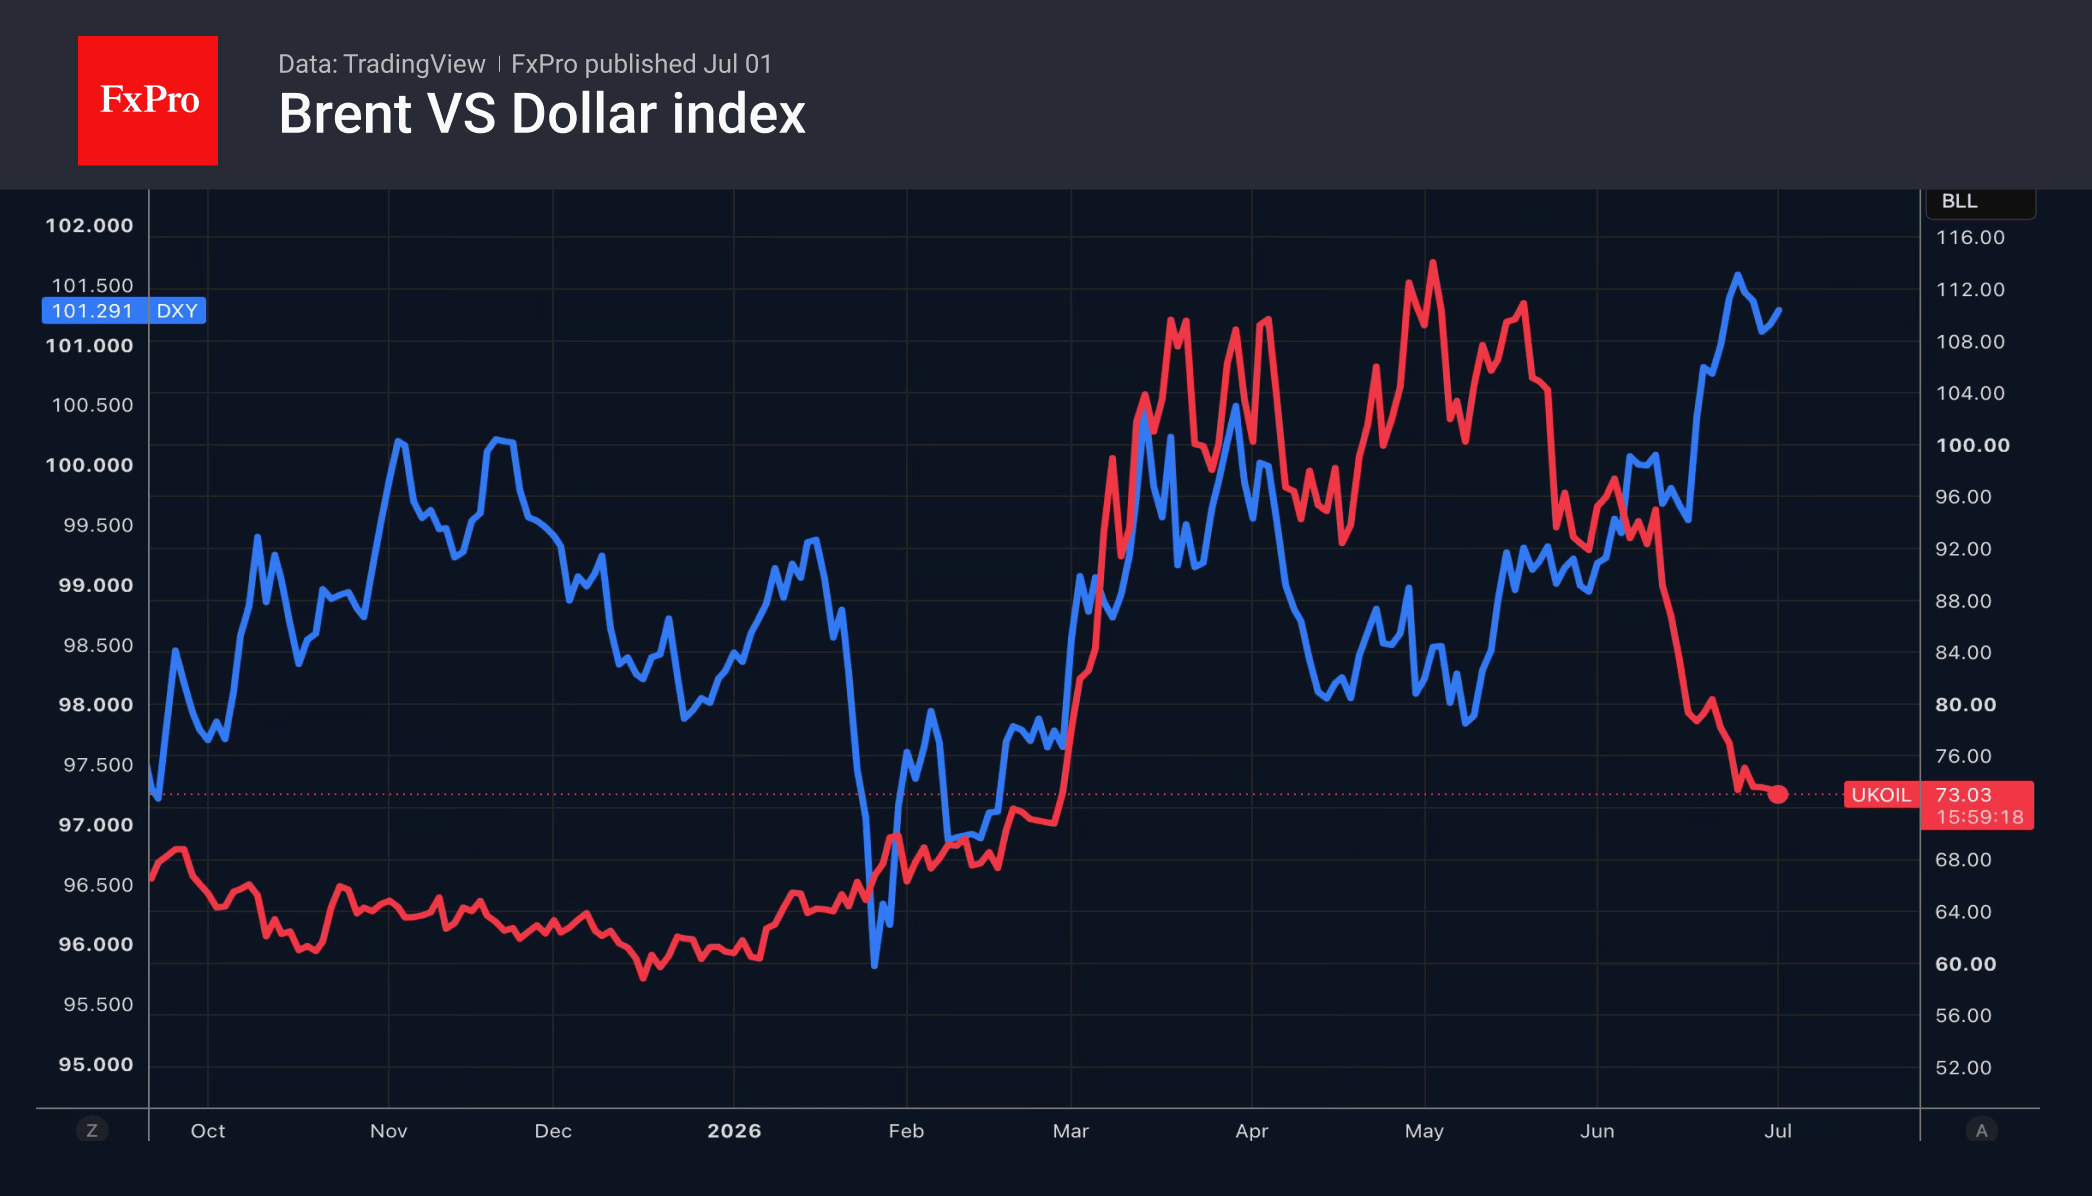
Meanwhile, the strengthening of the dollar has been one of the reasons behind the yen’s fall to 40-year lows and Brent’s rapid return to pre-Middle East conflict levels. In the spring, the rise in oil prices drove the dollar higher, but now the strengthening dollar is putting downward pressure on oil prices. That said, there are already plenty of headwinds for ‘black gold’.
Since the deal with the US was concluded, Iran has exported around 40 million barrels. Coupled with the rise in Russian oil supplies to 4.13M BPD, the highest since the beginning of 2022, this is exerting significant downward pressure on Brent.
Despite flare-ups in the conflict in the Middle East, tanker traffic through the Strait of Hormuz continues. The resumption of operations there allows Goldman Sachs to forecast a 3M BPD surplus in the oil market by 2027. Of this, 1 million BPD will be used to replenish strategic reserves. However, the remaining figure will be sufficient to give crude oil bears confidence.
The only thing likely to unsettle them would be the resumption of large-scale US air strikes against Iran. Donald Trump has not ruled out such action, but favours diplomacy.
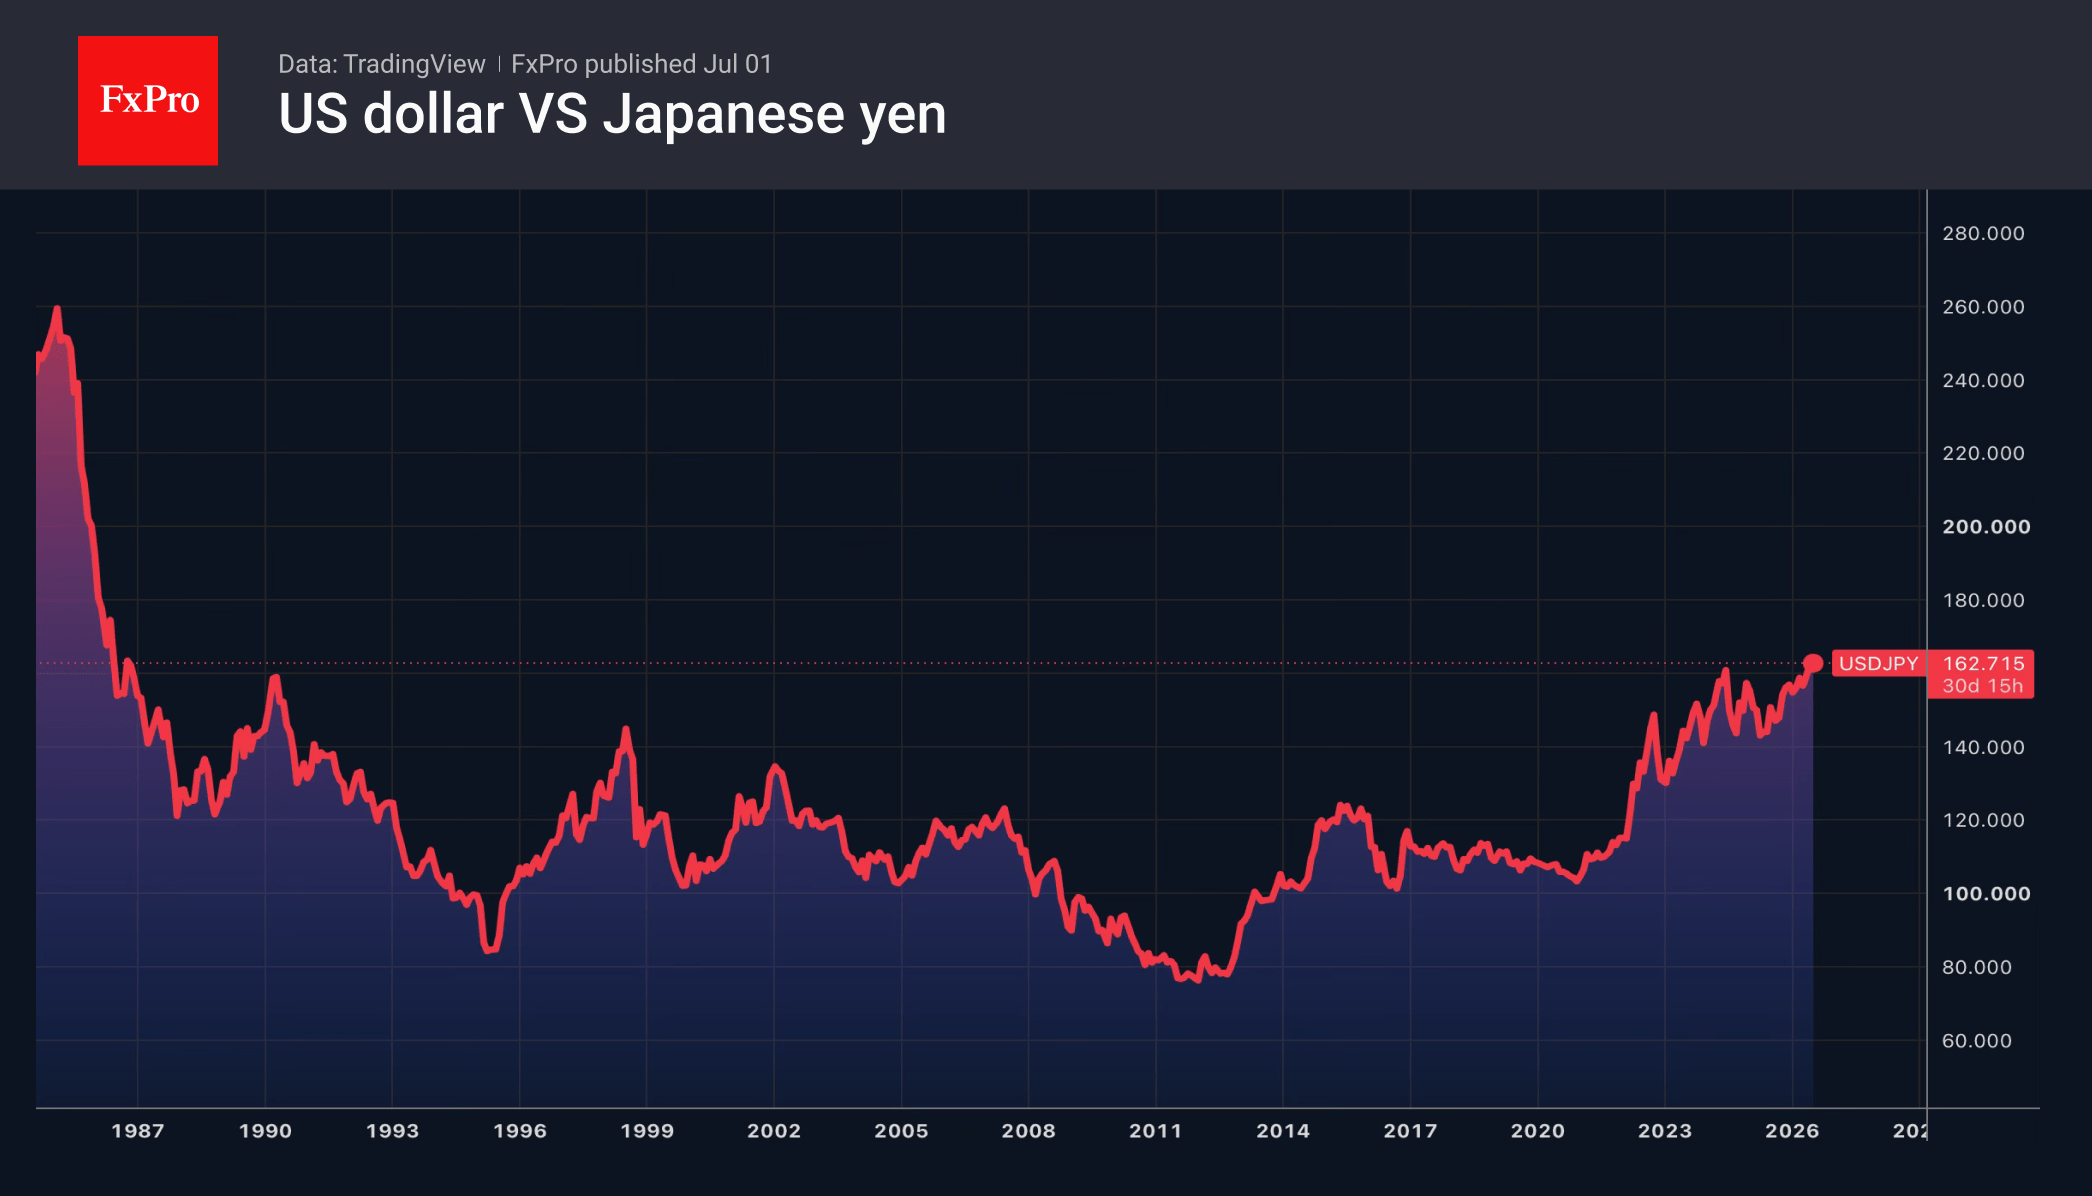
Meanwhile, the USDJPY has exceeded 162 for the first time since 1986. Investors are bracing for a resumption of currency interventions, on which Japan spent over $70 billion in April and May. According to Finance Minister Satsuki Katayama, the government and the central bank are ready to take appropriate measures regarding currencies at any time as necessary. The official noted that her US counterpart, Scott Bessent, had agreed with this.
If Kevin Warsh’s speech in Sintra fails to halt the US dollar’s advance, Japan will have no choice but to intervene in the forex market.
The FxPro Analyst Team
USD/JPY at 40-Year High: Multiple Factors Weigh on the Yen
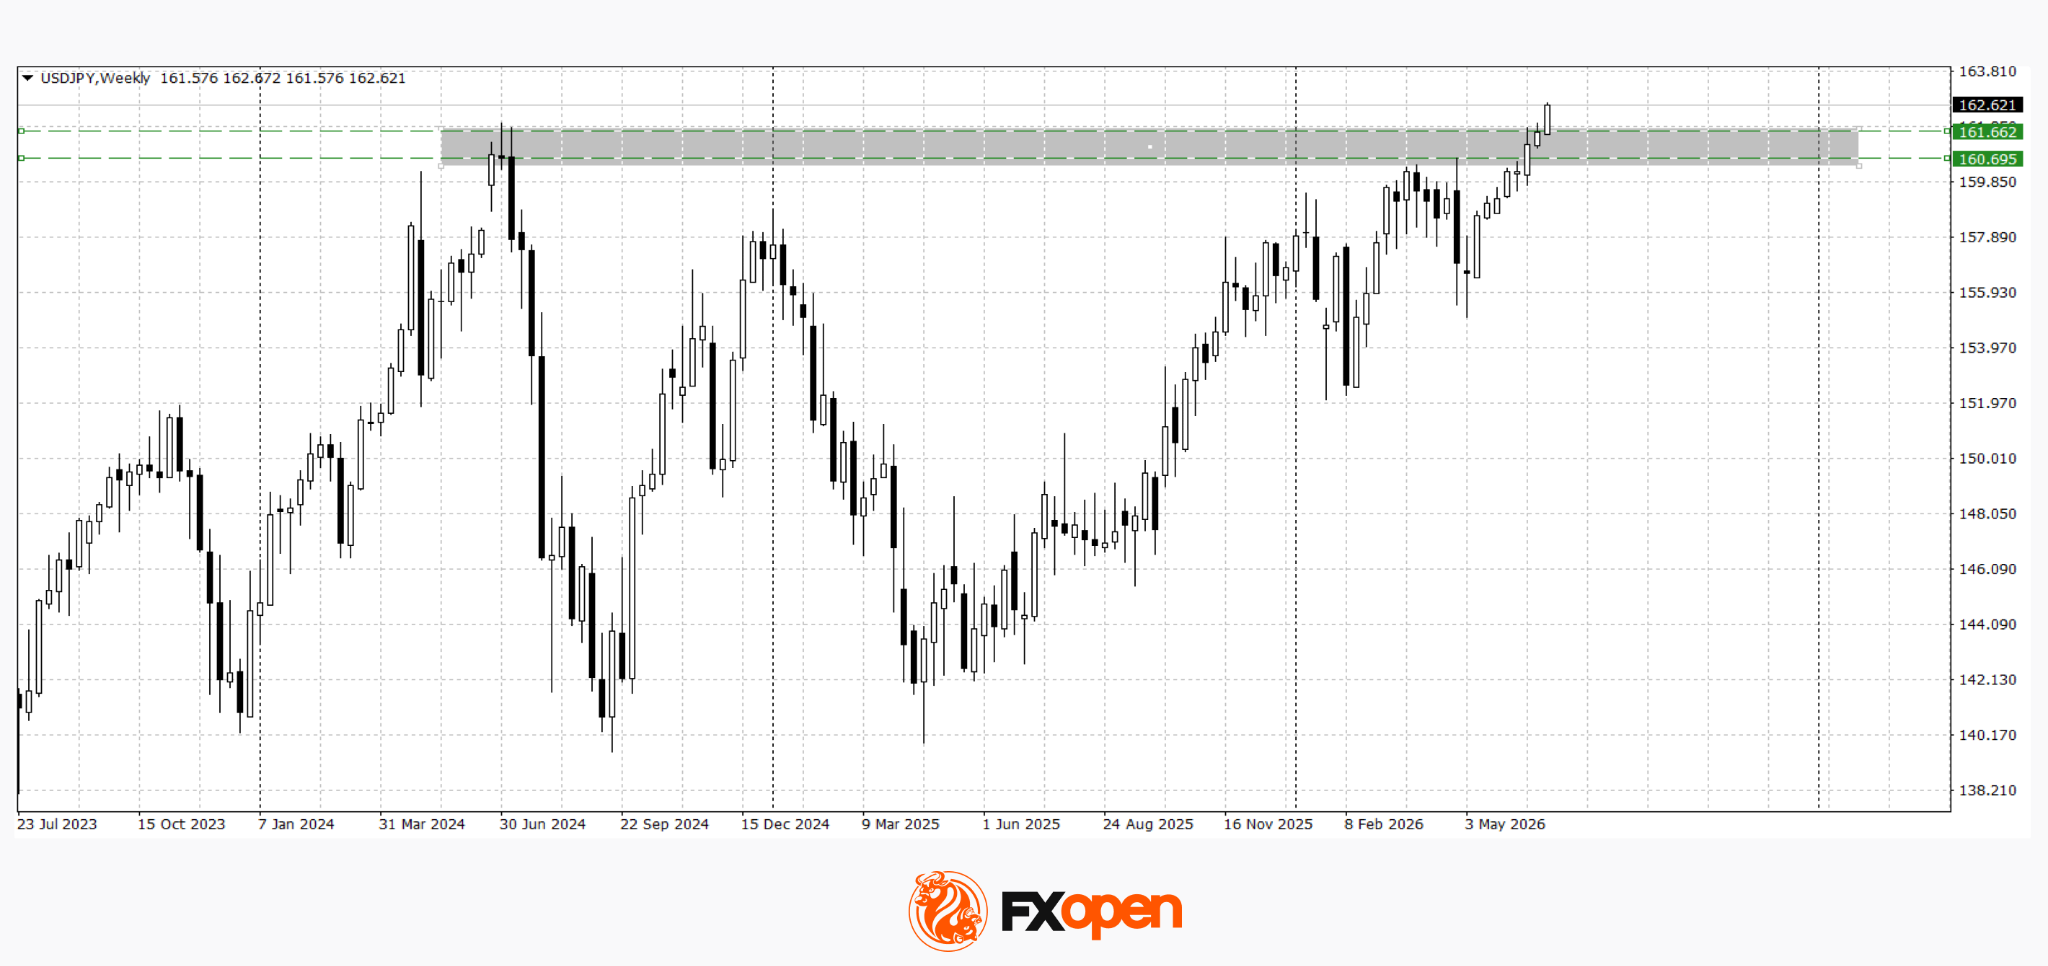
USD/JPY soared to 162.78 in the middle of the week, reaching its highest level in nearly 40 years.
This sharp move has intensified expectations of possible currency intervention by Japanese authorities to support the national currency.
Particular attention is focused on Friday, when US markets will be closed in observance of Independence Day. Low liquidity during such periods traditionally increases the effectiveness of potential interventions, and it was during similar windows that the Bank of Japan previously acted.
Additional pressure on the yen comes from robust US macroeconomic data, which supports expectations of further Federal Reserve interest rate hikes. At the same time, investors remain doubtful that the Bank of Japan is prepared to accelerate monetary tightening, as the regulator favours a gradual normalisation approach.
The continued appeal of carry trade operations and strong demand for the dollar as a safe-haven asset are also weighing on the Japanese currency.
An additional risk factor is Japan's reliance on oil imports from the Middle East, leaving the economy sensitive to potential disruptions in energy supplies from the region.
Technical Analysis
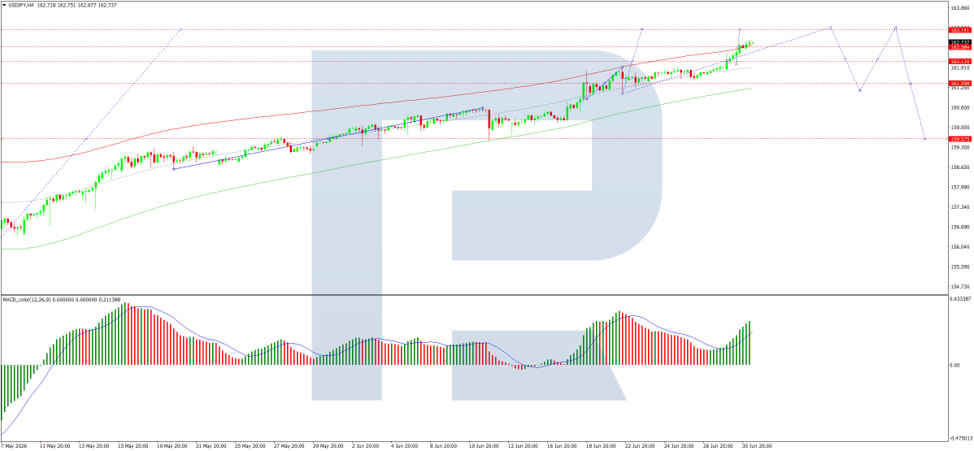
On the H4 chart, USD/JPY is trading within a consolidation range around the 162.55 level and, following an upside breakout, is developing an upward move towards 163.15. This target is expected to be reached today, followed by a decline towards 161.40. The MACD indicator confirms this scenario, with its signal line above zero and pointing firmly upwards, reflecting continued bullish momentum.
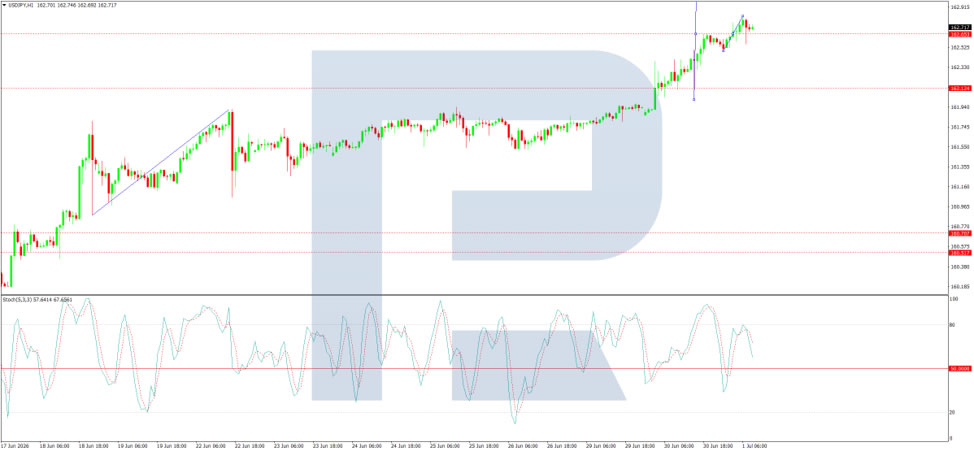
On the H1 chart, USD/JPY is forming an upward structure towards 163.15. A correction towards 162.60 may follow, before a further rise to 163.30, with scope for the trend to extend to 163.50. The Stochastic oscillator supports this scenario, with its signal line above 50 and pointing upwards towards 80, indicating that short-term upside potential remains.
Conclusion
USD/JPY has surged to a 40-year high as multiple factors align against the yen. Strong US data continues to support expectations of further Fed rate hikes, while the Bank of Japan remains cautious in its approach to policy normalisation, widening the interest rate differential. The persistent appeal of carry trades and safe-haven demand for the dollar add further pressure, while Japan's dependence on Middle Eastern oil imports heightens vulnerability to supply disruptions. Markets are now on high alert for potential intervention, particularly with US markets closed on Friday – a period of low liquidity that has historically increased the likelihood of such actions. Technically, further upside towards 163.15–163.50 appears likely in the near term, although intervention risks remain elevated at these levels.
UK Manufacturing PMI Slips from Four-Year High as Stockpiling Boost Fades
The UK's manufacturing sector remained firmly in expansion territory in June, although growth eased slightly from May's four-year high. The S&P Global UK Manufacturing PMI slipped from 53.9 to 52.5, below the earlier flash estimate of 53.1, while extending the current expansion to eight consecutive months. Factory output continued to grow at its fastest pace since September 2024, highlighting the sector's resilience despite a modest loss of momentum.
According to S&P Global's Rob Dobson, manufacturers continue to benefit from strategic stockpiling by customers seeking to protect themselves against supply-chain disruptions and future price increases. However, he warned that "a drop in the rate of growth of new work intakes suggests this boost is already starting to fade." Business optimism also remained subdued, with many firms citing geopolitical tensions and uncertainty over future government policy as reasons for caution.
Inflation pressures presented a mixed picture. Input cost inflation remained elevated as supply-chain strains led to raw material shortages and higher supplier charges. At the same time, the recent decline in energy prices helped slow the overall pace of cost inflation, allowing factory selling price inflation to moderate as well. The survey suggests manufacturers are still benefiting from temporary inventory-related demand, but sustaining the recovery will increasingly depend on a stronger pipeline of underlying orders as those stockpiling effects diminish.
| Indicator | Previous | Latest |
|---|---|---|
| Manufacturing PMI | 53.9 | 52.5 |
| Manufacturing Output | Strong | Fastest since Sep 2024 |
| New Orders | Stronger | Growth slowed |
| Business Optimism | Tepid | Remained subdued |
| Input Cost Inflation | Elevated | Still elevated |
| Selling Price Inflation | Elevated | Slowed |
Eurozone PMI Manufacturing Shows Resilience, but Inventory Tailwind May Be Ending
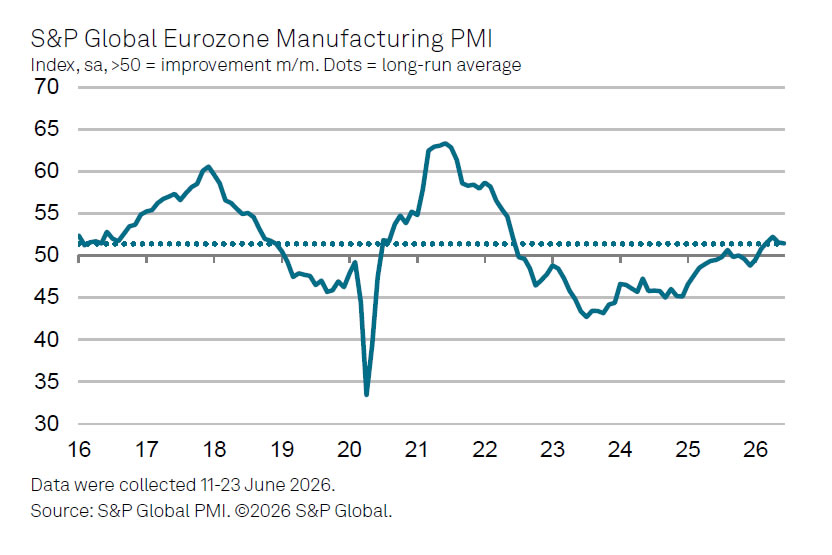
Eurozone manufacturing remained in expansion territory in June despite a modest slowdown in headline activity. The S&P Global Eurozone Manufacturing PMI eased from 51.6 to 51.4, a four-month low, while the Manufacturing Output Index rose from 51.3 to 51.7, its highest level in two months. The data suggest factory production continued to strengthen even as broader business conditions softened slightly.
According to S&P Global Chief Business Economist Chris Williamson, the latest survey capped the strongest calendar quarter for Eurozone manufacturing production since the first quarter of 2022. He noted that the expansion was accompanied by a welcome easing in inflationary pressures, with both input costs and output prices rising at their slowest pace since March, reflecting lower oil prices and improving supply conditions. Williamson said these developments should help reduce firms' costs while supporting consumer demand through lower inflation.
Looking ahead, however, the outlook is less straightforward. Williamson cautioned that manufacturers have benefited in recent months from precautionary stockpiling linked to the Middle East conflict, a tailwind that is already beginning to fade. While lower energy prices and easing supply constraints provide a supportive backdrop, the unwinding of inventory building could weigh on production growth in the coming months, leaving the durability of the manufacturing recovery dependent on underlying demand rather than temporary stockpiling.
| Indicator | Previous | Latest |
|---|---|---|
| Eurozone Manufacturing PMI | 51.6 | 51.4 |
| Manufacturing Output Index | 51.3 | 51.7 |
| Input Cost Inflation | Slowest since March | |
| Output Price Inflation | Slowest since March | |
| Quarterly Manufacturing Output | Strongest since Q1 2022 | |
| Positive Drivers | Lower oil prices; easing supply concerns | |
| Key Risk | Precautionary stockpiling fading |
USD/JPY Tests Multi-Year Highs, While USD/CAD Holds Near Yearly Peaks
After a strong rally in the US dollar at the end of last week, the currency has moved into a consolidation phase against major counterparts. Investors remain cautious ahead of the release of the ADP employment report for the US private sector, which is expected to serve as a key indicator before Friday’s official Nonfarm Payrolls data. Additional influence on the dollar’s dynamics today may come from the manufacturing PMI and ISM indices, as well as a speech by Federal Reserve Board member Christopher Waller.
Market participants continue to assess the outlook for future Federal Reserve policy. Despite no new rate decisions, Fed officials maintain a hawkish tone, stressing the need to keep interest rates elevated until there are clear and sustained signs of inflation slowing. As a result, demand for the dollar remains strong; however, ahead of key data releases, investors are partially taking profits on long USD positions, contributing to a consolidation phase in the market.
USD/JPY
Unlike most dollar pairs, USD/JPY is not showing clear consolidation and continues its upward trend. After reaching a new two-year high, the price has strengthened to 162.60, with no technical signals yet indicating the start of a correction.
Technical analysis of USD/JPY suggests potential further gains towards 163.00–164.00. A corrective pullback could begin only after a decisive break below 161.60.
Key events for USD/JPY:
- Today at 15:15 (GMT+3): ADP US Nonfarm Employment Change;
- Today at 16:00 (GMT+3): Fed Governor Waller speaks;
- Today at 17:00 (GMT+3): ISM Manufacturing PMI (US).
USD/CAD
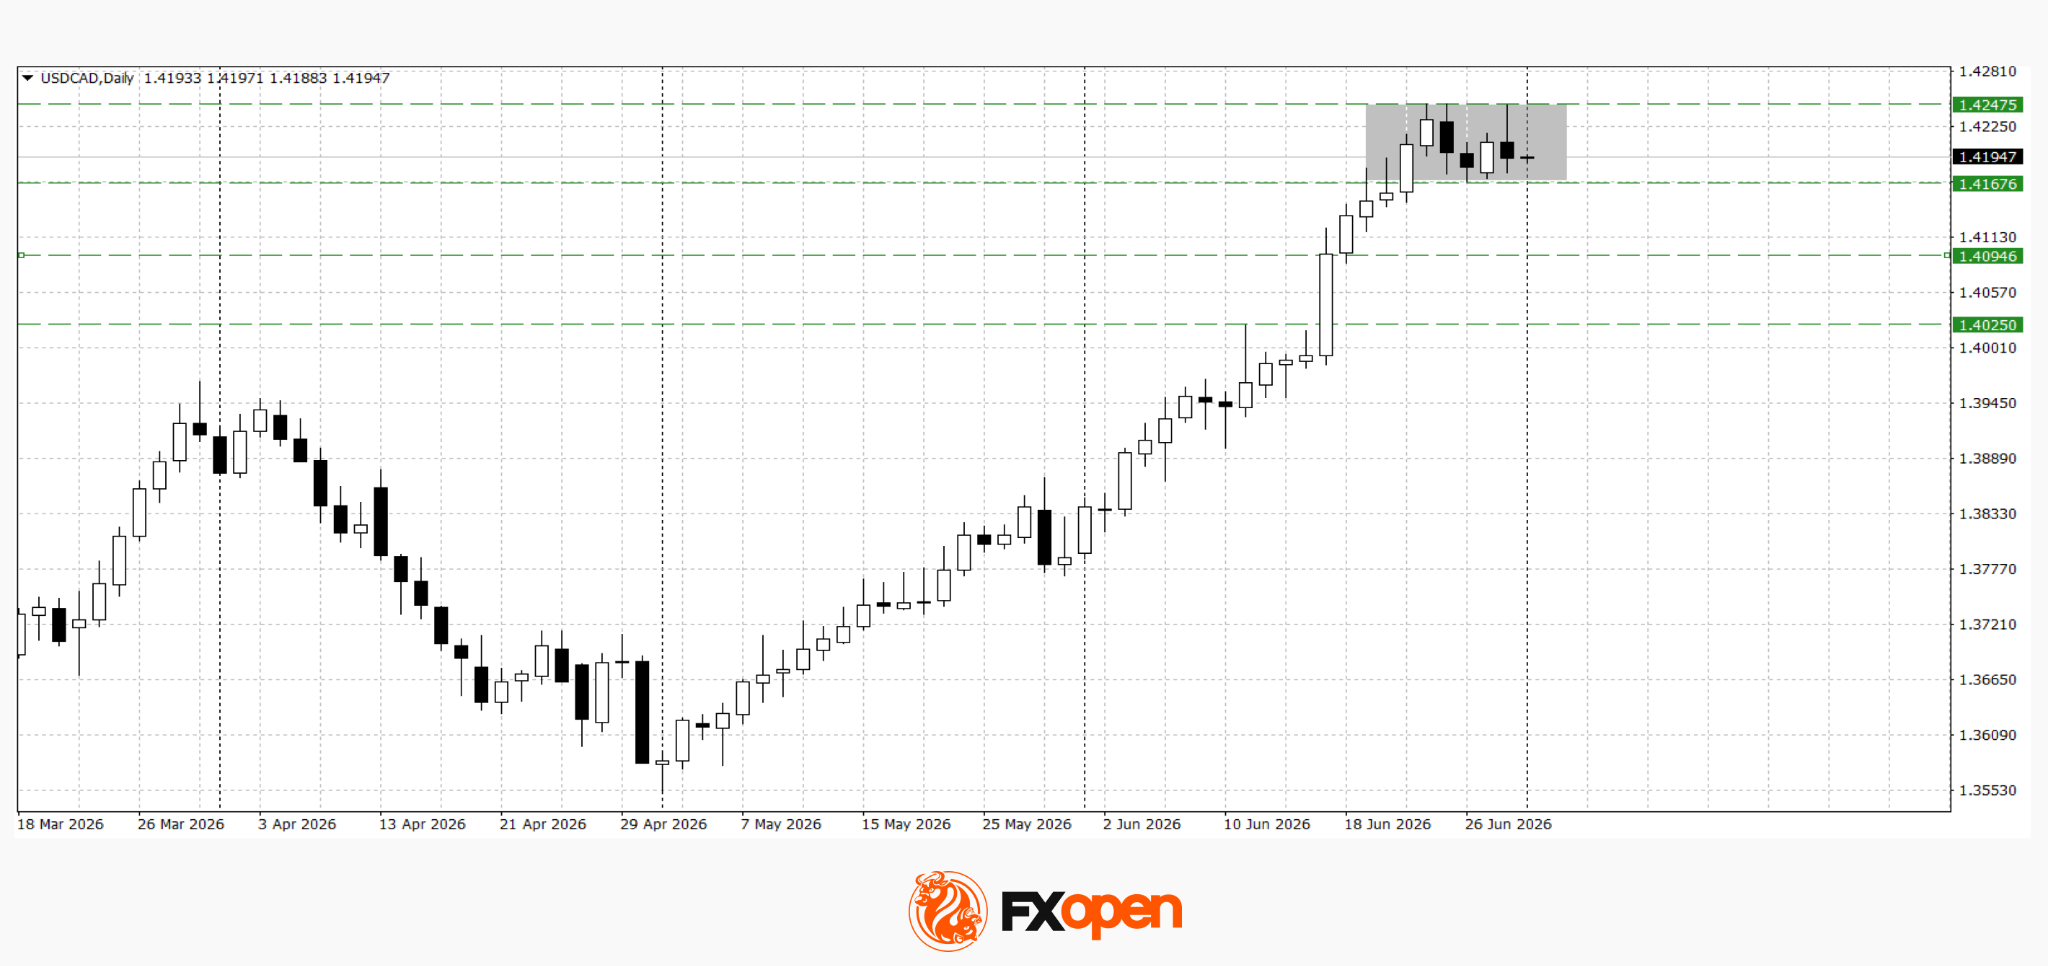
USD/CAD buyers failed to break resistance at 1.4250. After an unsuccessful attempt to hold above this level, buying pressure eased and the pair moved back below 1.4200. The nearest key support is located at 1.4160. If the pair settles below this level in upcoming sessions, a deeper corrective decline may begin. At the same time, a firm break above 1.4250 could trigger a renewed upward move.
Key events for USD/CAD:
- Today at 16:00 (GMT+3): Bank of Canada Governor Macklem speaks;
- Today at 17:30 (GMT+3): US crude oil inventories;
- Today at 18:30 (GMT+3): Atlanta Fed GDPNow indicator.
Overall, ahead of the ADP report, the dollar is likely to maintain mixed price action near recent highs. If labour market data confirms resilience in the US economy, expectations of prolonged Fed tightening may strengthen, supporting further USD gains. Conversely, weaker data could trigger profit-taking and lead to a corrective move ahead of Friday’s official Nonfarm Payrolls release.
Trade over 50 forex markets 24 hours a day with FXOpen. Take advantage of low commissions, deep liquidity, and spreads from 0.0 pips (additional fees may apply). Open your FXOpen account now or learn more about trading forex with FXOpen.
This article represents the opinion of the Companies operating under the FXOpen brand only. It is not to be construed as an offer, solicitation, or recommendation with respect to products and services provided by the Companies operating under the FXOpen brand, nor is it to be considered financial advice.
Bitcoin at $59K: Strategy’s Sell-Off Fears Are Weighing on the Market
Market Overview
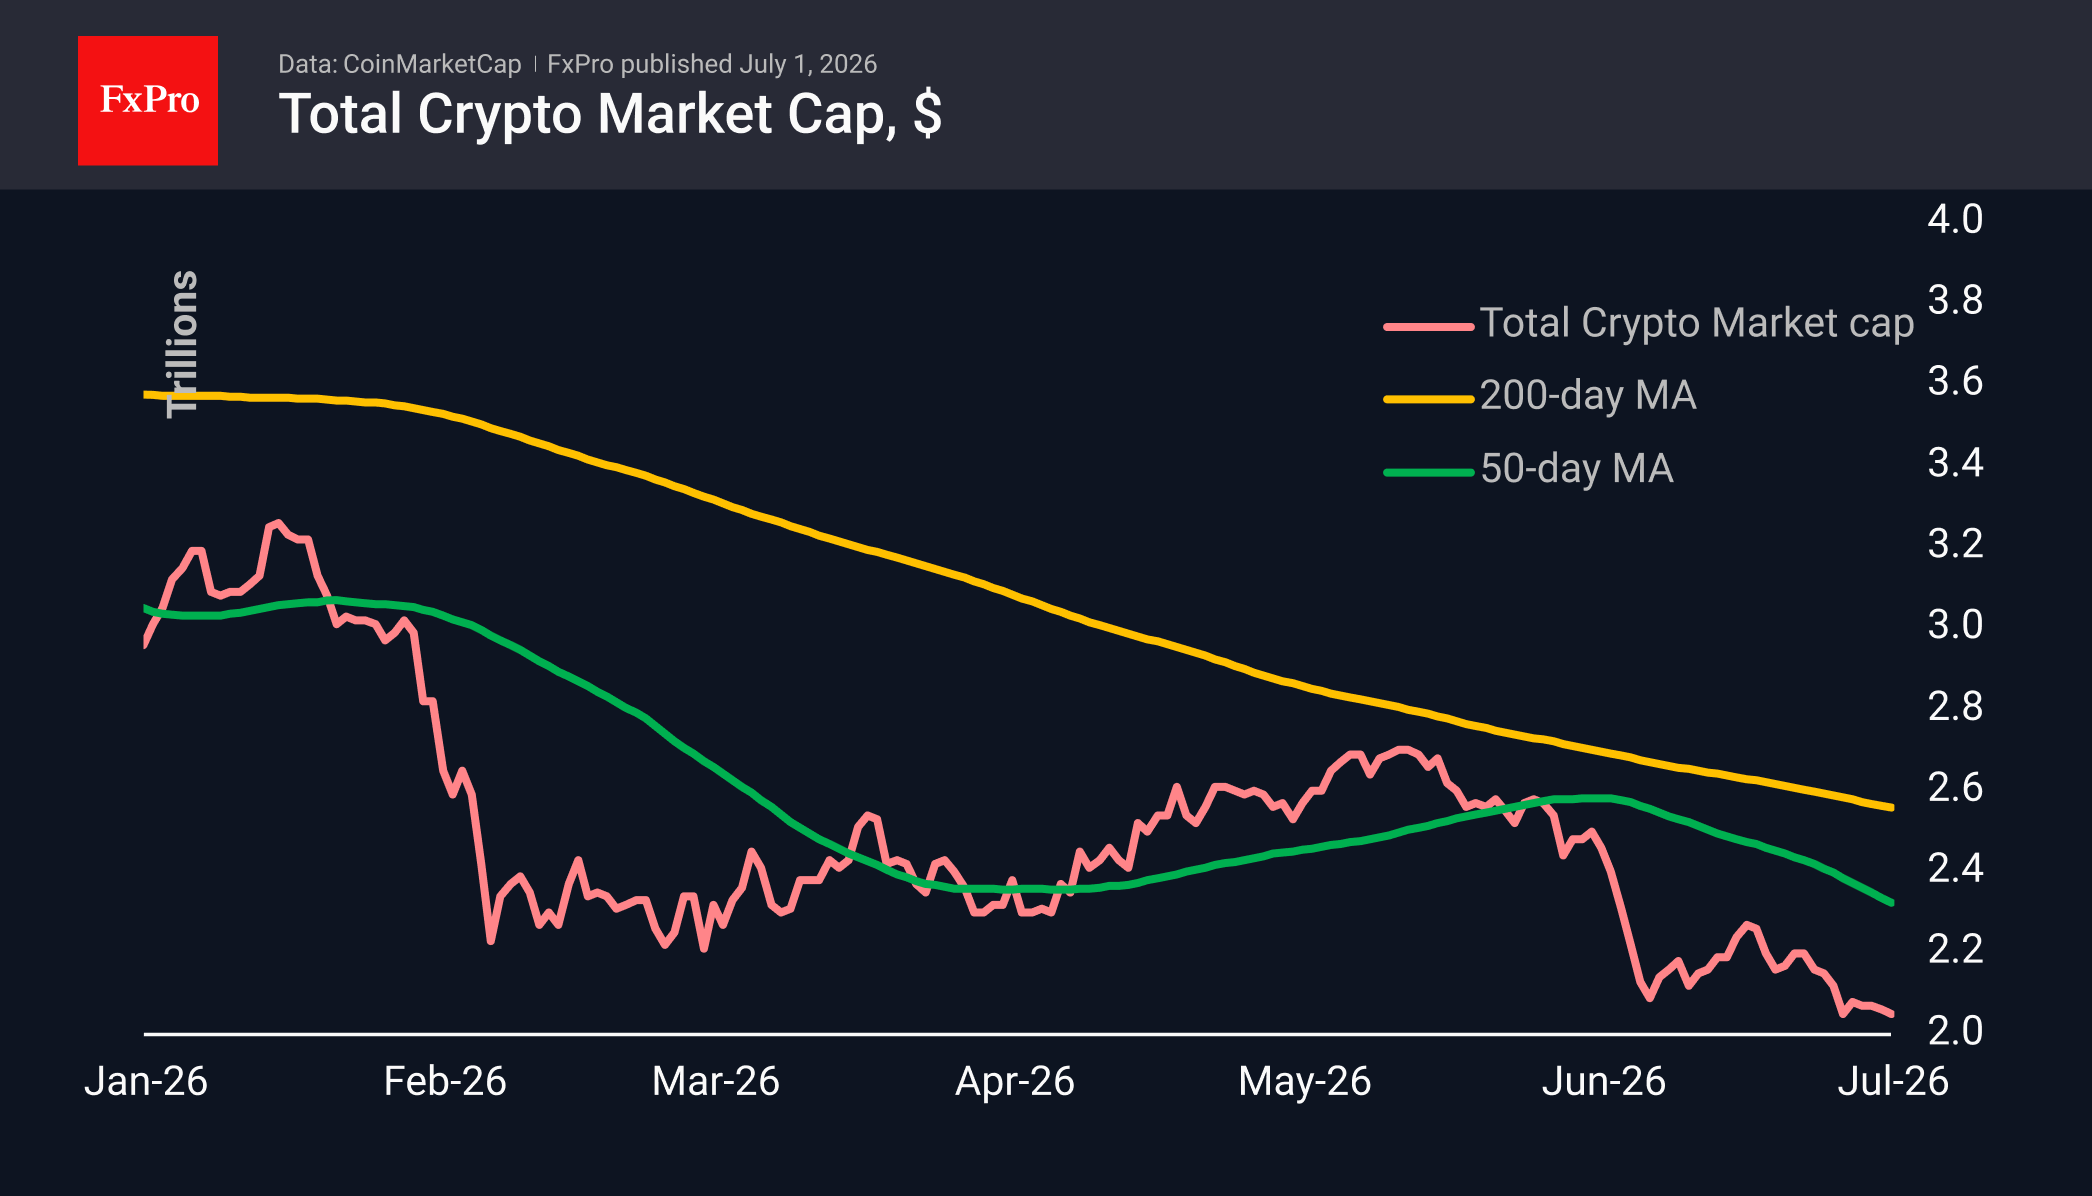
The crypto market is trading at $2.06T, unchanged from the previous day. Still, the current levels represent a recovery from a low of $2.02T, where the cap had fallen at the start of the active US trading session and again at the opening of the Asian session. Cryptocurrencies remain under pressure from fears of selling by Strategy, casting a shadow over the relatively positive backdrop of favourable stock market dynamics and a declining dollar. Among the top coins over the past 24 hours, the leaders were Stellar (+7%), Cardano (+4.8%) and Bitcoin Cash (+3.6%). The underperformers were Aave (-3.9%), Algorand (-3.2%) and Basic Attention Token (-3%).
The sentiment index plummeted to 11, its lowest level in roughly the last three weeks. June turned out to be a rather gloomy month, as sentiment was above the ‘extreme fear’ threshold of 25 on only the 1st, remaining within the range of 8 to 23 for the rest of the month.
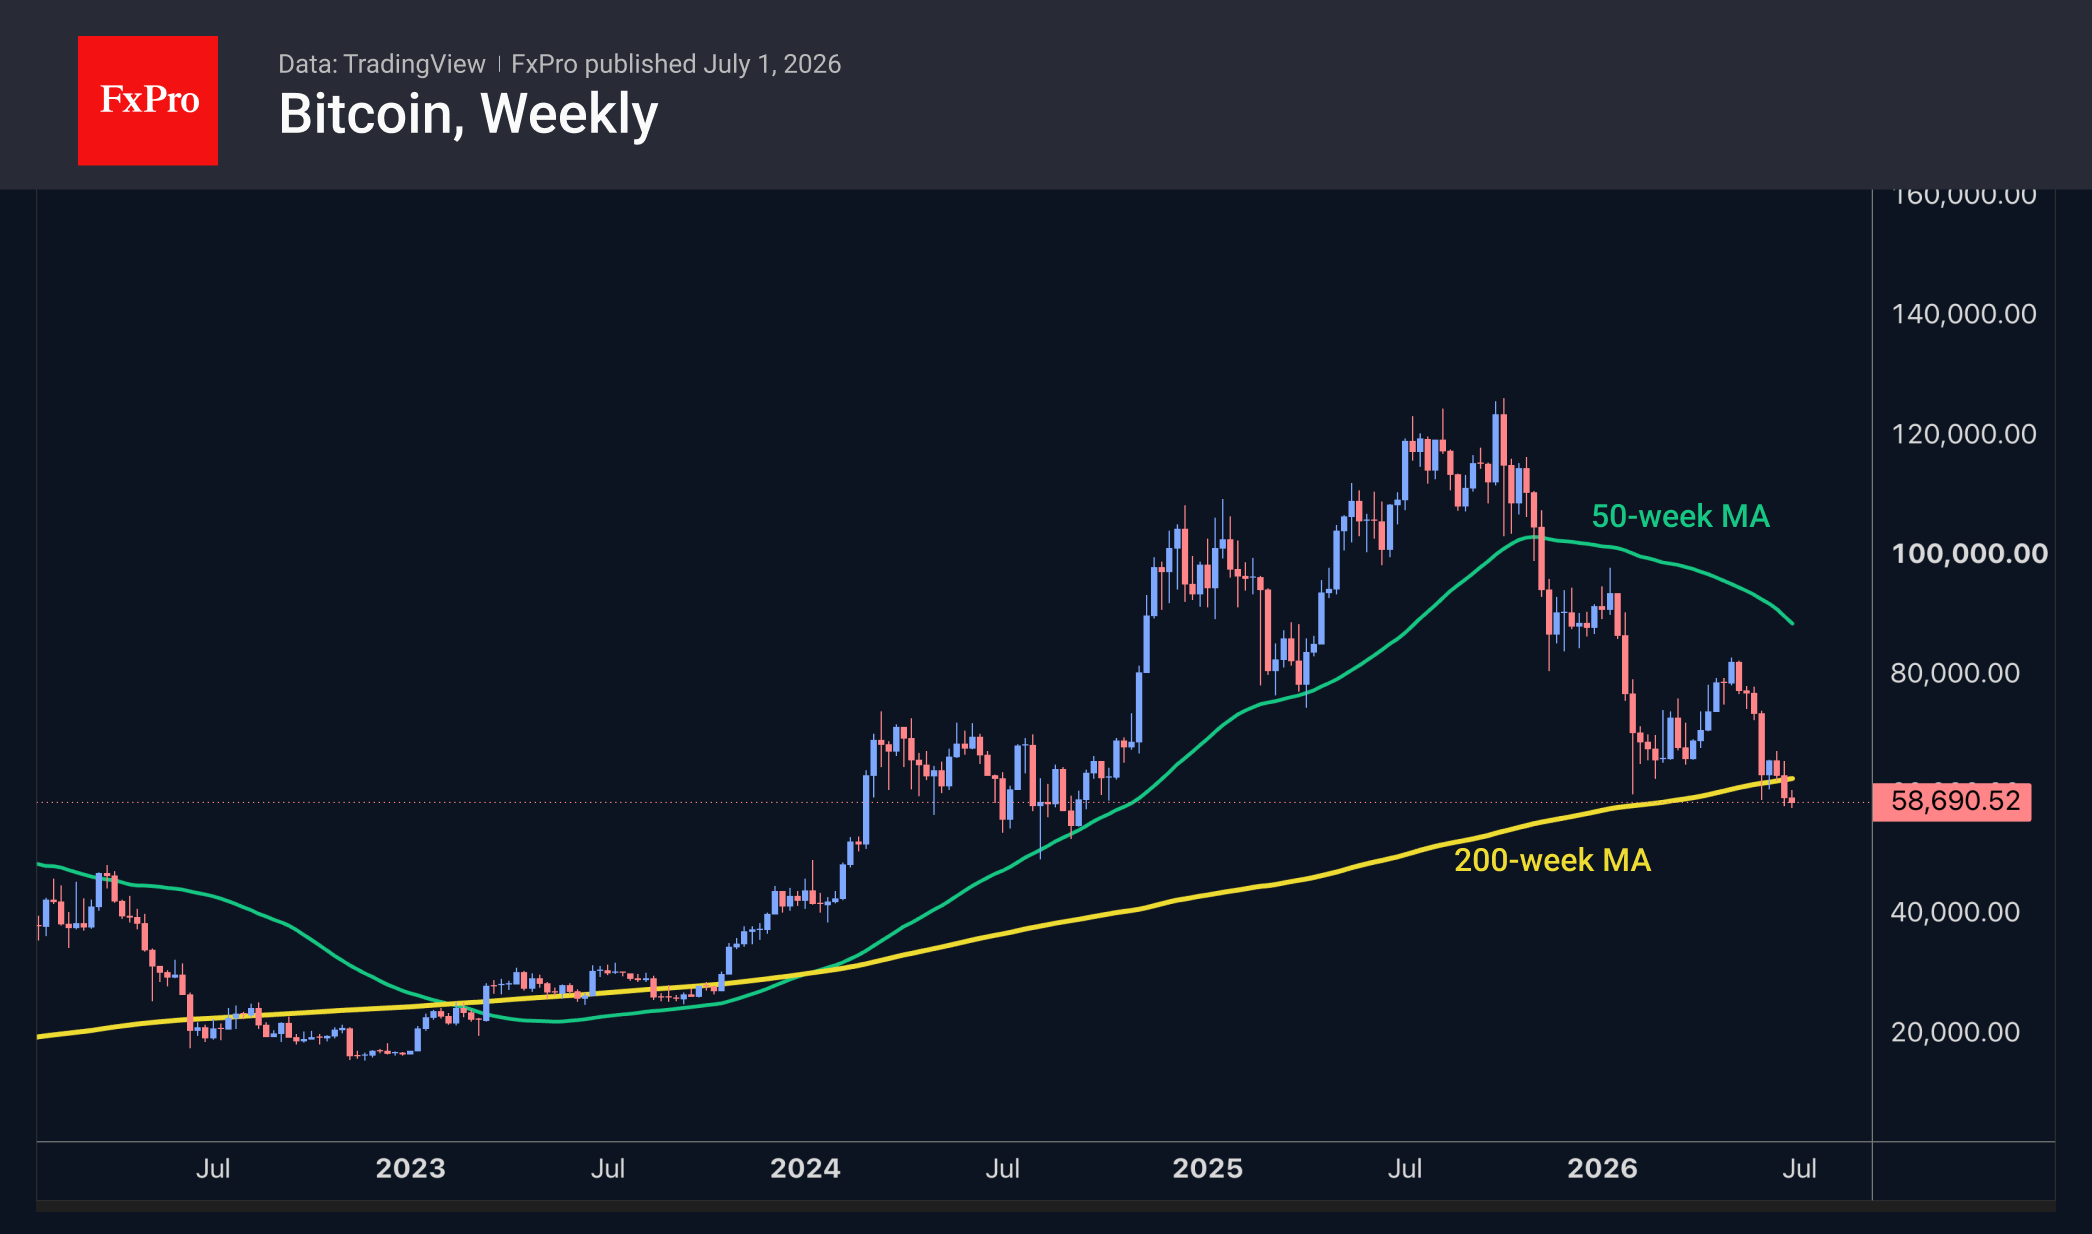
At the start of the day on 1 July, Bitcoin slipped to $57.8K, having recovered to above $59K at the time of writing. At its lowest point, BTC hit its lowest level since September 2024, and the subsequent attempt to rebound still looks rather tentative. The leading cryptocurrency is gradually slipping below the 200-week moving average, which is typical behaviour for it at this point on the curve, judging by several past instances.
Bitcoin fell by 20.5% in June to $58.6K, marking its second consecutive month of decline following a two-month rally. This monthly decline was the steepest in the last four years. From a seasonal perspective, July is generally considered a fairly successful month for BTC. Over the past 15 years, Bitcoin has ended the month higher on ten occasions and lower on five. The average gain was 19%, while the average decline was 7.8%.
News Background
Over the past week, BitMine purchased an additional 27,084 ETH worth $43 million, bringing the total amount of Ethereum in its reserves to 5.7 million ETH, which exceeds 4.7% of the total Ethereum supply. BitMine has achieved 94% of its target to consolidate 5% of the second-largest cryptocurrency’s total supply over the past 11 months, according to BitMine’s Chairman, Tom Lee.
According to Arkham Intelligence, the US company Sharplink has resumed buying Ethereum after an eight-month hiatus. Last week, the company acquired 39,196 Ether for $62.4 million.
Strategy did not buy any Bitcoin last week, but sold a block of MSTR ordinary shares, increasing its dollar reserves to $2.55 billion. According to the company, these funds will be sufficient to cover 17 months of expected share-based payments.
Following the latest adjustment, the Bitcoin mining difficulty rose sharply by 7.15% to 133.87 T. This is the largest increase in the metric since February.
According to SoSoValue, investors withdrew $4.3B from US Bitcoin ETFs in June. This monthly outflow was the largest since the launch of the Bitcoin ETF in January 2024.
The FxPro Analyst Team
Sunrise Market Commentary
Markets
A combination of data, comments from the ECB Sintra forum and some final end-of-quarter repositioning were the drivers for trading at the final session of the quarter. July inflation data from EMU members including Germany (HICP -0.2% M/M; 2.4% Y/Y), France (-0.3% M/M; 2% Y/Y) and Italy (0.1% M/M; 3.1% Y/Y) surprised slightly to the downside. There is no one-to-one link between those data and the ECB assessment/comments. Even so, they only support the message from multiple ECB members that the bank should not be in a hurry to raise rates already at the July meeting. As markets only discount less than 10% of a July rate hike, these data didn't change that much for current market positioning. The market debate on a potential September rate hike remains open (70% discounted). German yields changed less than 1.5 bps across the curve. US data were mixed. June consumer confidence (Conference Board) slightly disappointed at 91.2. The US consumer in particular turned more cautious on their current assessment (116.4 from a downwardly revised 119.4). However, the market focus these days mainly is on labour data. US May JOLTS job openings rose a bigger than expected 7494k, suggesting the labour market remains in a 'constructive balance'. The initial reaction was modest, but yields were squeezed higher in final hours of Q2 trading. US yields finally added 6.8 bps (2-y) to 9.1 bp (10-y). It didn't help the dollar. DXY closed little changed at 101.18. Same for EUR/USD (close 1.1422). USD/JPY confirmed Monday's break above 161.95, closing at 162.55, with the yen at a 40-year low against the dollar. Markets can only guess what will be the next line in the sand for Japanese authorities. Equities again found their composure with tech outperforming (Nasdaq +1.52%, Dow +0.26%).
This morning, most Asian equity indices show modest gains. The dollar gains modestly, with the yen staying defensive (USD/JPY 162.7). Today's calendar contains the June Flash EMU CPI. Given the national data already available, there is a slight downside risk to the 0.1% M/M; 3% Y/Y expectation. However, the focus regarding ECB policy might be on core and even more on services inflation. In the US, the ADP private job report (expected at 120k) might further fine-tune expectation on tomorrow's payrolls. The US manufacturing ISM (expected 53.8) should confirm resilient activity. At 15:00 CET the market focus probably will be on the panel debate at the ECB Sintra forum with ECB President Lagarde, Fed Chair Warsh, BoE governor Bailey and BoC governor Macklem. We don't expect Fed Chair Warsh to provide forward guidance at this forum.
News & Views
ECB sources told Reuters that the central bank is considering to double the minimum reserve requirement ratio to 2% from 1%. Funneling commercial banks' excess reserves into this unremunerated account would reduce central banks' combined annual interest bill by almost €4bn, Reuters calculated. The topic turned political in the aftermath of the Covid inflation crisis, which resulted in ECB policy rates as high as 4%. Huge amounts of excess liquidity, the result of years of ECB government bond buying, were back then deposited at the central bank and the rest of the Eurosystem and remunerated at rates not seen in decades. Euro area central banks stacked up losses, hampering their ability to pay dividends to states and potentially resulting in forced capital increases. Raising the minimum reserve requirements would also aid the ECB in mopping up the excess liquidity it created by years of government bond buying (which is now being unwound).
Japanese business mood unexpectedly improved in Q2, the Bank of Japan's Tankan survey showed. Large manufacturers considered business conditions to have improved, from 16 to 22 – the best since 2018. Sentiment was better in 13 of the 18 subsectors involved, supported probably by the AI-investment boom. Sentiment at non-manufacturers meanwhile brightened further to a new 35-year high. The forward looking component stood at a similar 8-year and 35-year high in the respective sectors and have yet to fully reflect the US-Iran ceasefire (survey reference date was June 11). Industry-wide capex plans amount to 11.5% in the fiscal year through March 2027, a sharp increase from the 3.3% in Q1. Businesses (across size and sector) see CPI at 2.6% five years from now, 0.1 ppt higher than in Q1. This indicator is a critical one in the BoJ's assessment of long-term inflation expectations. Japanese firms are widely planning increases to their output prices in another sign of strong underlying inflation momentum. The Tankan survey fails to lift JPY spirits. The Japanese yen continues to trade at a 40-year low against the USD just shy of 163 with the only thing preventing rapid further declines being intervention threats by Japanese officials.