Sample Category Title
Swiss CPI Slows to 0.6% as Imported Price Pressures Fade Further
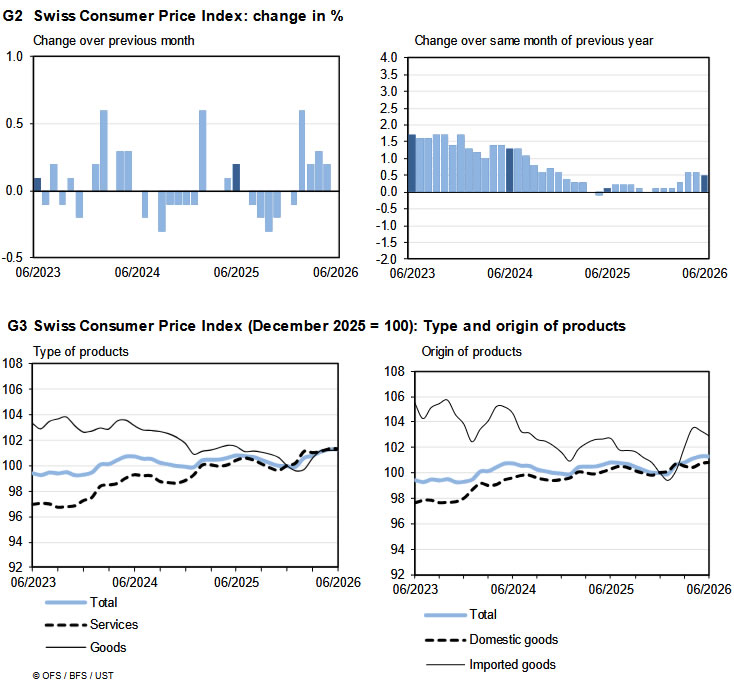
Swiss inflation remained subdued in June, with consumer prices unchanged on the month and annual headline inflation easing from 0.6% yoy to 0.5% yoy, in line with market expectations. Core inflation, which excludes fresh and seasonal products as well as energy and fuel, was also flat on the month and held steady at 0.3% yoy, pointing to persistently muted underlying price pressures.
The breakdown highlighted a divergence between domestic and imported inflation. Prices for domestic products rose 0.1% mom and slowed from 0.6% yoy to 0.5% yoy. Imported product prices fell -0.4% mom. On an annual basis, imported inflation decelerated sharply from 0.7% yoy to 0.2% yoy, reflecting the impact of lower global energy prices and easing imported cost pressures.
The latest figures reinforce Switzerland's position as one of the lowest-inflation economies among advanced markets. With both headline and core inflation remaining well below levels seen elsewhere in Europe, the data should give the Swiss National Bank flexibility to keep policy unchanged while monitoring external developments, particularly the effects of lower commodity prices and exchange-rate movements on imported inflation.
| Indicator | Previous | Latest | Consensus |
|---|---|---|---|
| Headline CPI (MoM) | — | 0.0% | 0.1% |
| Core CPI (MoM) | — | 0.0% | — |
| Domestic Product Prices (MoM) | — | 0.1% | — |
| Imported Product Prices (MoM) | — | -0.4% | — |
| Headline CPI (YoY) | 0.6% | 0.5% | 0.5% |
| Core CPI (YoY) | 0.3% | 0.3% | — |
| Domestic Product Prices (YoY) | 0.6% | 0.5% | — |
| Imported Product Prices (YoY) | 0.7% | 0.2% | — |
Sunrise Market Commentary
Markets
The highly awaited panel debate at the ECB Sintra forum between Fed Chair Warsh, ECB president Lagarde, BoE governor Bailey and Bank of Canada governor Macklem didn't yield much new insight on the short-term dynamics of monetary policy of the participants' central banks. BoE Governor Bailey mainly focused on low UK growth even as inflation stays above target for now. Fed Chair Warsh reiterated he prefers a smaller balance sheet but this will take quite some time. He also kept his 'communication commitment' to avoid any forward guidance on upcoming Fed policy steps. Even so, he saw inflation expectations and inflation risks coming down recently, but at the same time reiterated the commitment to deliver on its price stability mandate. ECB Lagarde assessed that risks to inflation and growth probably now are a bit more balanced. The comments can be understood as mildly dovish, but with little specific 'guidance' on (the timing of) upcoming policy steps. Yields eased slightly off the intraday highs after the debate, but daily changes in the end were small. US yields rose between 0.2 bps (2-y) and 1.9 bps (30-y). Regarding the US data, the ADP June private job growth at 98K was below consensus. The US manufacturing ISM also eased slightly more than expected to 53.3 from 54. The prices paid subindex eased to 73 from 82.1. Even so, the market reaction was very limited with the focus on today's US payrolls. The German yield curve slightly steepened (2-yr -1.6 bps; 30-yr +3 bps). The oil price continues its decline with Brent currently trading below $71/b but the direct impact on markets is becoming a bit less pronounced. Equities are still swinging between 'hope and doubt' with the Nasdaq losing 0.66%. The Eurostoxx 50 also ceded 0.72%. The dollar slightly outperformed with DXY closing north of 101. EUR/USD closed at 1.1377 (from 1.1422 at the open). After setting a new multi-year high early in the session, USD/JPY closed off the intraday top (162.6). After several rejected tests over the previous year, EUR/GBP dropped below the 0.86 range bottom, with additional stop-loss momentum pushing the pair to a close of 0.857.
US payrolls are published one day earlier than the traditional Friday release as US markets are going into a long weekend due to Independence Day. After three months of strong job growth, markets now expect payrolls growth at 113k (from 172k in May). Even so, this is a growth rate that should be able to at least balance the unemployment rate (expected unchanged at 4.3%). Average hourly earnings are expected at 0.3% M/M and 3.5% Y/Y. A solid figure confirms the picture of US eco resilience, and makes it easier for the Warsh Fed to act on its price stability commitment. With only 30% probability of a 25 bps Fed step discounted in July and 80% in September, the market still has some room to 'frontload' in case of a strong report. Such a scenario should be USD supportive. In EUR/USD, the ST low at 1.1325 is still within reach.
News & Views
Sources familiar with the matter told Reuters that Japanese officials may abandon the habit of telegraphing interventions or the risk of them to markets. Such "ambush intervention tactics" – as Reuters describes it – is considered a more targeted campaign to abruptly squeeze out speculators instead of giving them a heads up that allows them to orderly unwind their positions. By eliminating this possibility, Japan increases market uncertainty and therefore risks of shorting the yen. The Reuters report comes amid JPY exploring new 40-year lows against the US dollar. Officials have indeed remained more quiet than in the recent past on the matter. They may have been biding their time going into today's US payrolls, hoping that it would strip the dollar some of its momentum. The Reuters report, however, offers a different perspective on the recent relative silence. USD/JPY takes a small step back from the recent multidecade highs to trade around 162.4.
South Korean inflation decelerated from 0.5% to 0.1% m/m in June but pushed the annual figure higher nonetheless, from 3.1% to 3.2% in June. Core CPI (ex. food and energy) matched May's 2.5% compared to the consensus view of 2.6%. That may have been the product of some oil-sensitive services prices (e.g. international airfares and overseas group-tour costs eased in y/y terms from May) that have come off in line with general oil prices. With prices expected to remain above the Bank of Korea's 2% target for some time and the economy profiting from the AI/semiconductor boom, the central bank is likely to hike the policy rate from the current 2.5% several times in coming months. The Korean won trades slightly lower around USD/KRW 1554.75, a historically weak exchange rate.
EUR/GBP Accelerates Through Key Support as ECB/BoE Yield Convergence Trade Reverses
EUR/GBP may have passed a turning point that extends well beyond this week's inflation data. The sharp break below key technical support reflects more than a softer Eurozone CPI report—it signals that one of the market's biggest policy trades of recent months is beginning to unwind, and intensifying. Investors are no longer betting that the ECB will continue closing the interest-rate gap with the BoE. Instead, that convergence story is rapidly losing momentum.
June's inflation figures provided the catalyst. Headline CPI slowed from 3.2% yoy to 2.8% yoy, while core inflation eased from 2.6% yoy to 2.4% yoy, both undershooting expectations. Shortly afterwards at the ECB Forum, ECB President Christine Lagarde acknowledged that inflation and growth risks had become "more broadly balanced" following the sharp decline in oil prices after the US-Iran ceasefire. With energy prices back near pre-conflict levels, fears of persistent second-round inflation have eased substantially. Markets now see a July pause as virtually certain, while expectations for another ECB hike beyond that have become far less convincing.
That represents a meaningful shift in the EUR/GBP narrative. Earlier this year, the cross benefited as investors anticipated the ECB would tighten policy more aggressively, gradually narrowing the sizeable interest-rate gap with the BoE. That process has now stalled. The ECB has already delivered one hike, but lower inflation has reduced the urgency for additional moves. By contrast, BoE Governor Andrew Bailey made clear in Sintra that a rate cut is "off the table at the moment," leaving UK policy broadly unchanged and preserving the existing yield advantage for Sterling, (2.25% vs 3.75%).
Political developments are adding extra support for the Pound. Following Keir Starmer's resignation, markets expect the incoming administration under Andy Burnham to maintain a disciplined fiscal stance rather than pursue expansionary policies. While not the primary driver, that perception is helping underpin confidence in Sterling as monetary policy expectations increasingly move in its favour.
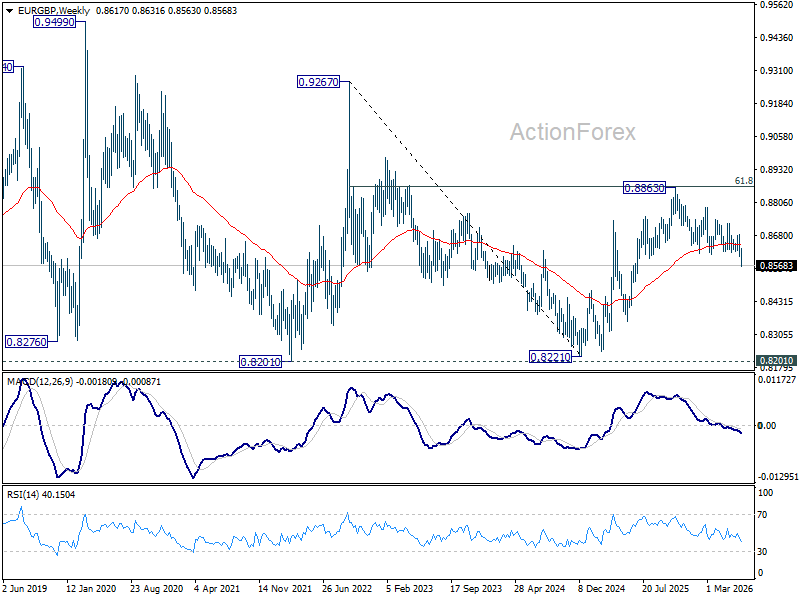
Technically, the latest decline carries much greater significance than a routine break of support. EUR/GBP has decisively fallen below the 38.2% retracement of 0.8221 (2024 low) to 0.8863 (2025 high) at 0.8618, while also slicing through 55 W EMA (now at 0.8645). These breaks came after the cross was firmly rejected by the 61.8% retracement of the broader 0.9267 (2022 high) to 0.8221 decline at 0.8867.
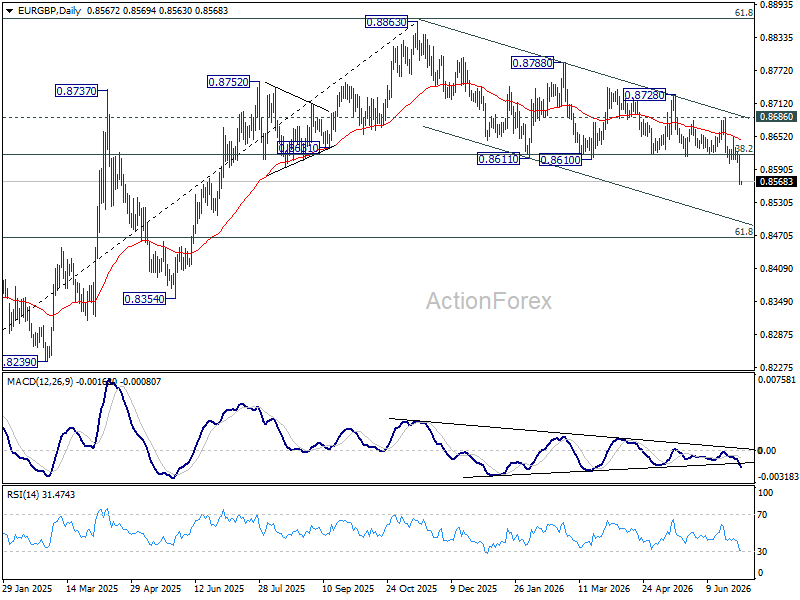
Taken together, these developments suggest the year-long uptrend from the December 2024 low at 0.8221 likely completed at the November 2025 high of 0.8863. As long as 0.8686, now immediate structural resistance, caps any rebound, the outlook should remain firmly tilted to the downside. The next objective is 61.8% retracement of 0.8221 to 0.8863 advance at 0.8466.
A sustained move below that level would strengthen the case that the entire rise from the 2024 low has been unwound, shifting attention toward a retest of 0.8221 over the medium term. Conversely, only a recovery back above 0.8686 would delay the bearish scenario and signal that a period of consolidation is developing instead.
Australia Posts Biggest Trade Deficit Since 2015 as Gold, Iron Ore Exports Slump
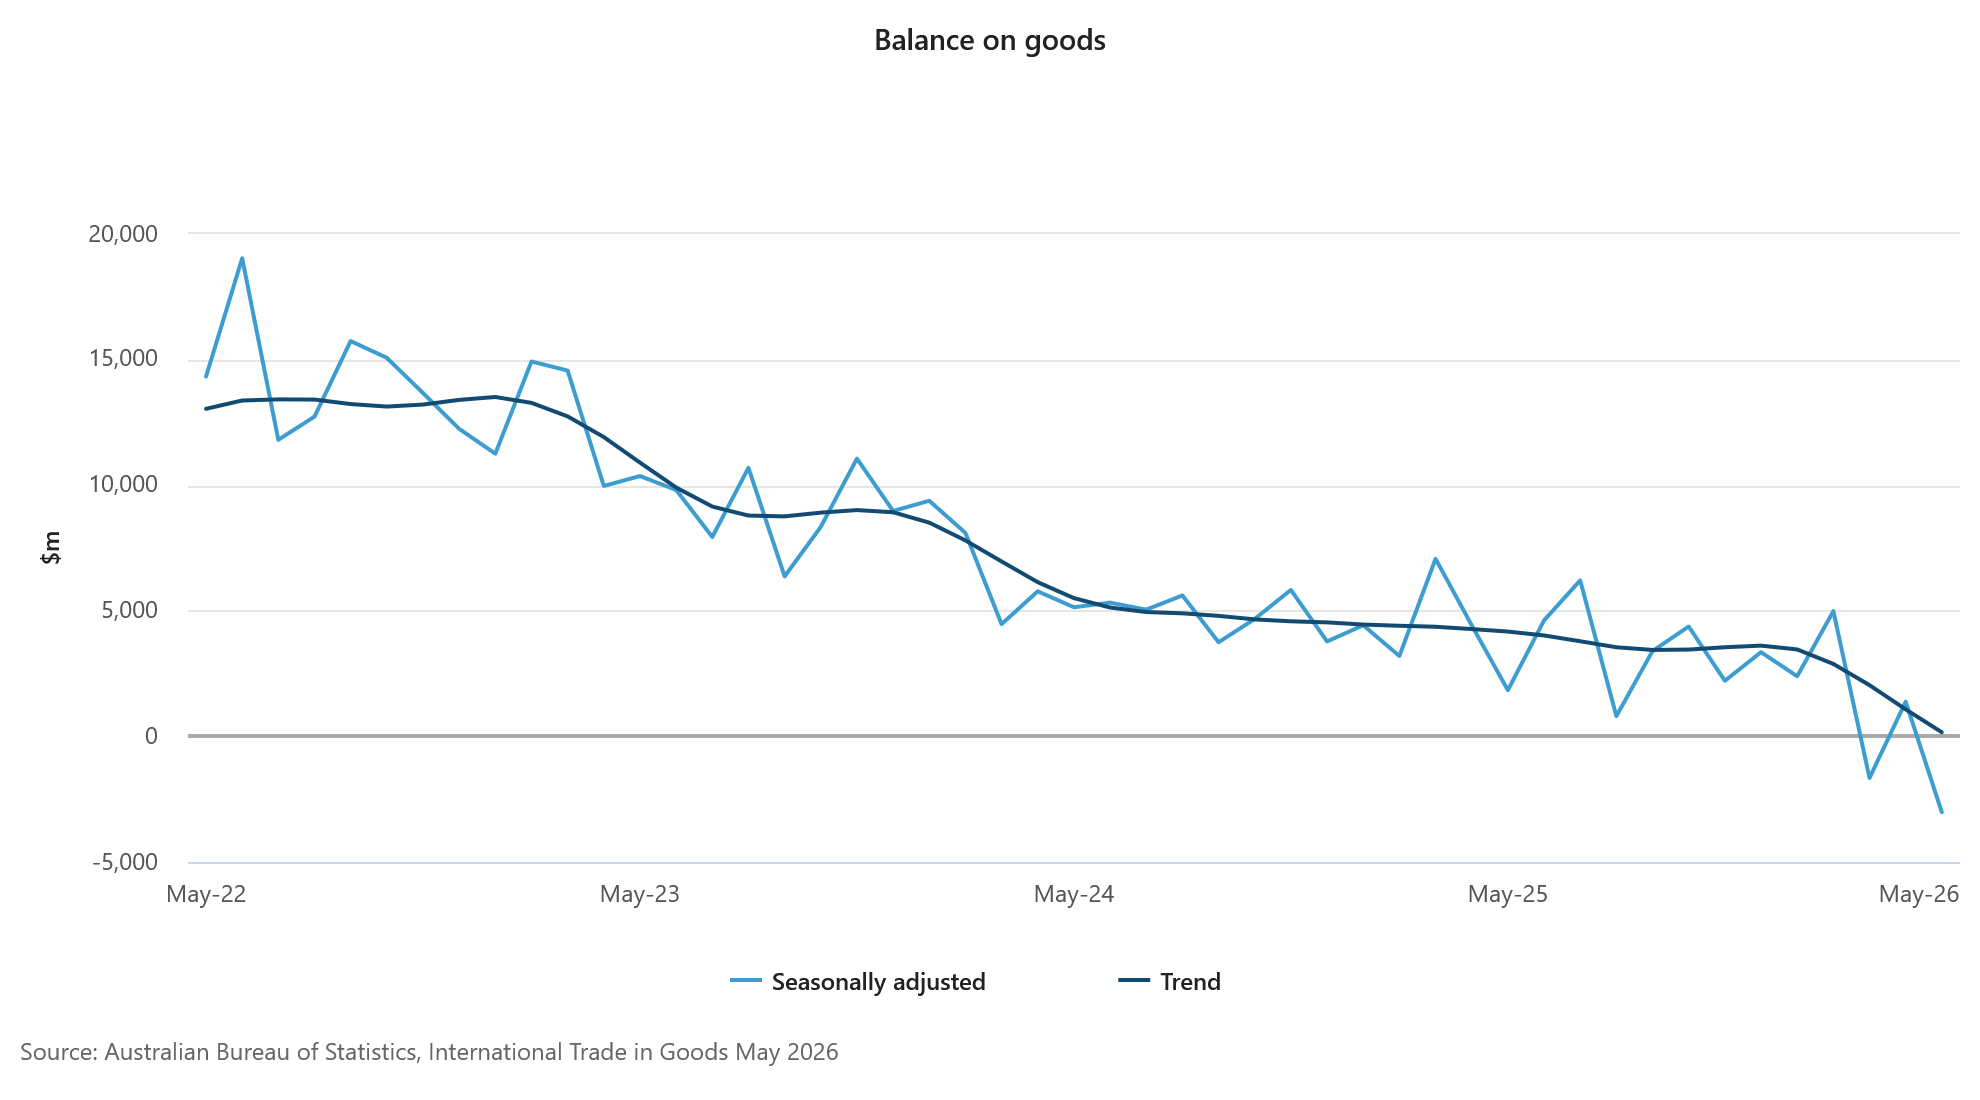
Australia's trade balance unexpectedly swung into its largest deficit in more than a decade in May as a sharp drop in commodity exports outweighed a rise in imports.
The Australian Bureau of Statistics reported a goods trade deficit of AUD 3.02B, compared with a revised surplus of AUD 1.38B in April and well below market expectations for a AUD 2.18B surplus. The shortfall marked Australia's largest monthly trade deficit since late 2015.
The deterioration was driven primarily by a -6.9% mom decline in exports following April's surge. Non-monetary gold exports plunged -35%, while iron ore exports fell -9%, highlighting the volatility of Australia's commodity-driven trade flows. Imports, meanwhile, rose 2.6% mom, led by stronger purchases of motor vehicles, aircraft and telecommunications equipment. Import increased 0.2% mom in April.
| Indicator | Previous | Latest | Consensus |
|---|---|---|---|
| Goods Trade Balance (AUD) | +1.38B | -3.02B | +2.18B |
| Exports (MoM) | 7.2% | -6.9% | |
| Imports (MoM) | 0.2% | 2.6% | |
| Non-Monetary Gold Exports | -35% | ||
| Iron Ore Exports | -9% |
Wti Crude Oil Under Pressure with US NFP in Sharp Focus
Key Highlights
- WTI Crude Oil extended losses and traded below $70.
- A key declining channel is forming with resistance at $70.85 on the 4-hour chart of XTI/USD.
- Gold could attempt a recovery if it surpasses the $4,200 resistance.
- USD/JPY extended gains above 162.50 before there was a minor pullback.
WTI Crude Oil Price Technical Analysis
WTI Crude Oil prices remained under pressure below $75 against the US Dollar. The price dipped below $72.50 to enter further into a bearish zone.
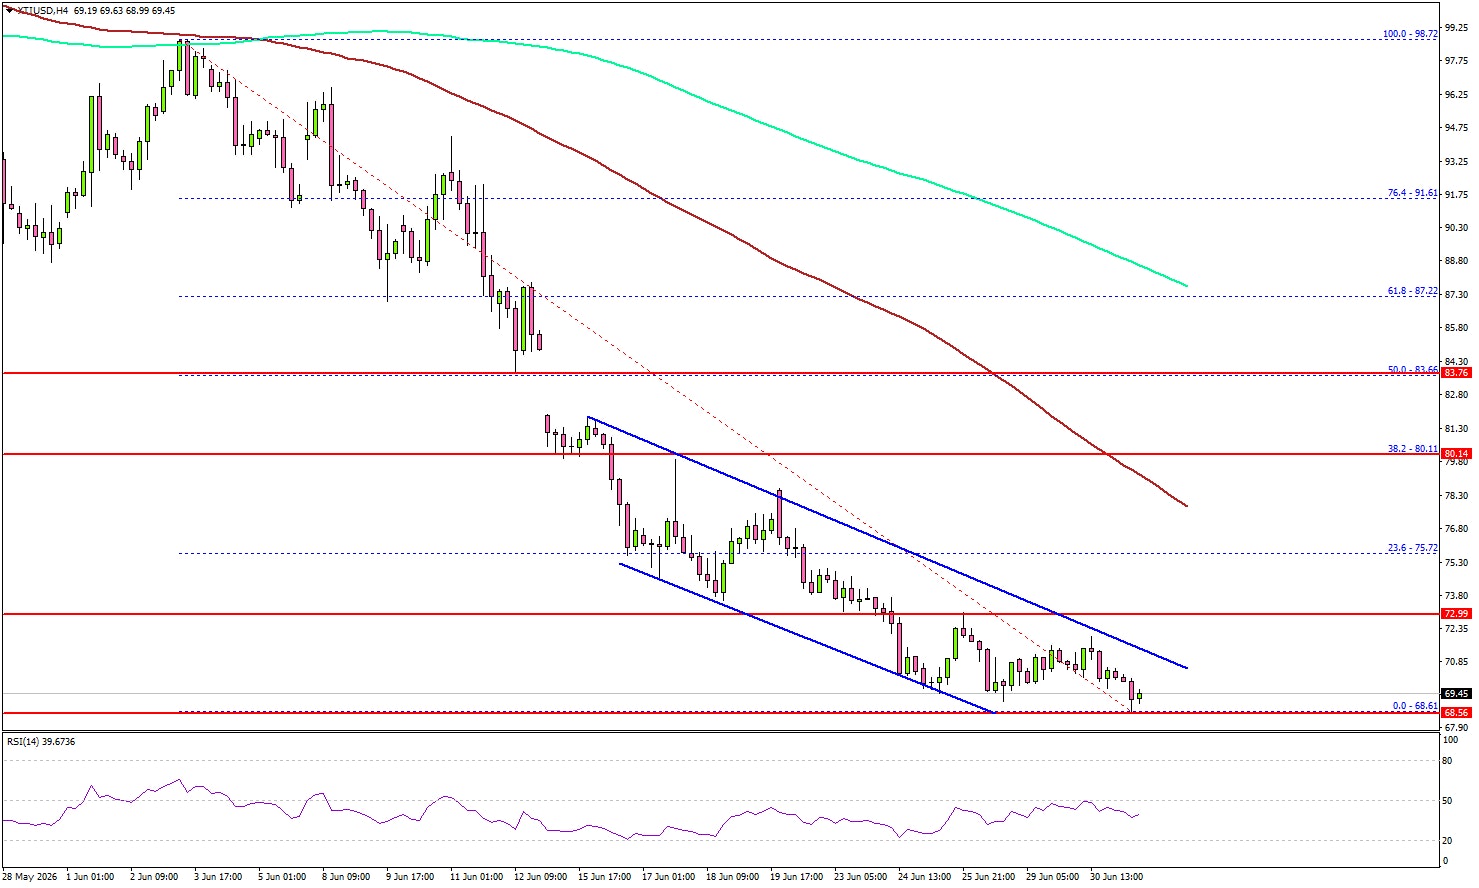
Looking at the 4-hour chart of XTI/USD, the price even declined below $70. It settled well below $72, the 100 simple moving average (red, 4-hour), and the 200 simple moving average (green, 4-hour). Besides, there is a key declining channel forming with resistance at $70.85.
If there is a recovery wave, the price could face resistance near the same channel. The next resistance might be $73.00. The first key hurdle for the bulls could be near the 23.6% Fib retracement level of the downward move from the $98.72 swing high to the $68.61 low at $75.72.
The main resistance may perhaps be near the 100 simple moving average (red, 4-hour) and $78.50. A close above $78.50 might send Oil prices toward $80. Any more gains might call for a test of $85 in the near term.
On the downside, the first major support could be near the $68.50 zone. The next support might be $66.50, below which the price could dive and test $65. A daily close below $65 could open the doors for a larger decline. In the stated case, the bears might aim for a drop toward $60.
Looking at Gold, the price might attempt a recovery wave, but it must settle above $4,200 to continue higher.
Economic Releases to Watch Today
- US nonfarm payrolls for June 2026 – Forecast 110K, versus 172K previous.
- US Unemployment Rate for June 2026 - Forecast 4.3%, versus 4.3% previous.
- US Initial Jobless Claims - Forecast 220K, versus 215K previous.
GBPUSD Elliott Wave Bearish Structure Calls for Further Weakness
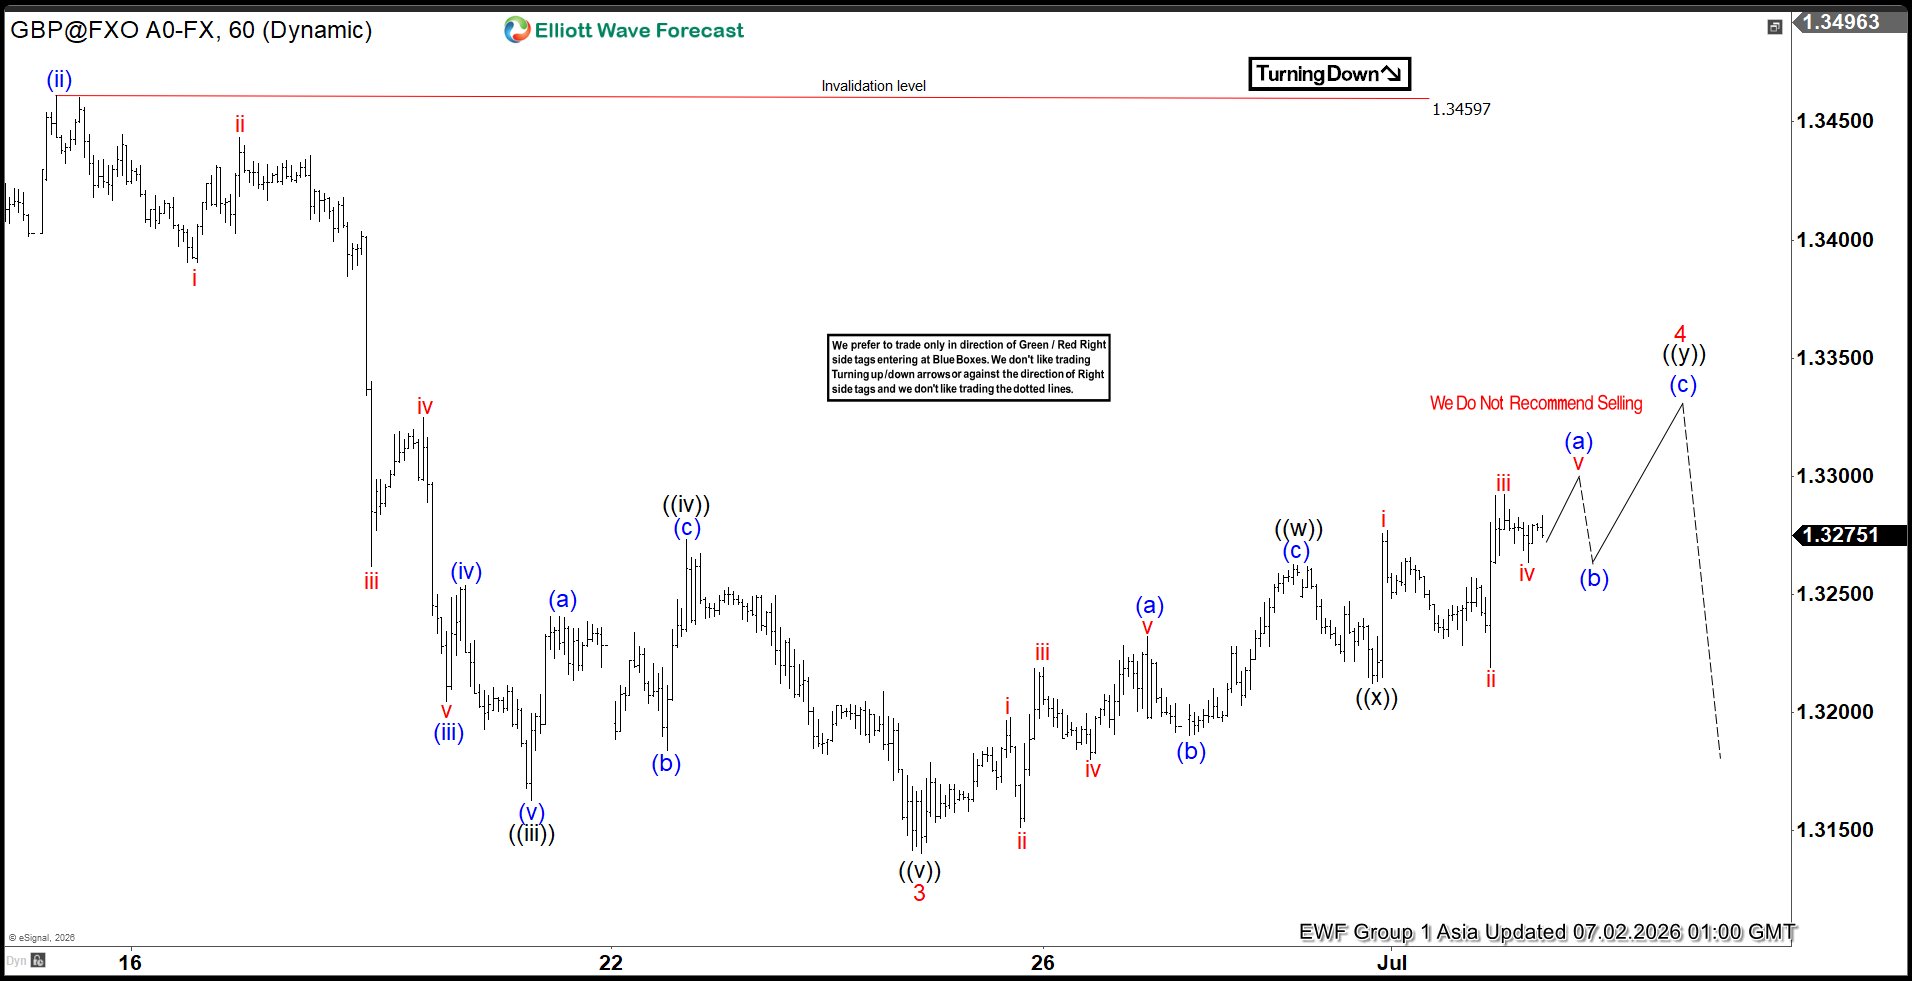
GBPUSD continues to show an incomplete bearish sequence from the January 27, 2026 high, keeping the bias tilted lower. The potential target can be measured using the 100% to 161.8% Fibonacci extension from that peak. This calculation defines a zone between 1.252 and 1.295, which remains the key area of interest for traders. The near‑term structure supports this view, as the decline from the May 1 high is unfolding as a five‑wave impulse. From May 1, wave 1 ended at 1.33, while the corrective rally in wave 2 concluded at 1.35. The pair then resumed its downward path in wave 3, reaching 1.314.
Wave 4 is now in progress and shows internal subdivision as a double three corrective structure. From the wave 3 low, wave ((w)) ended at 1.326, followed by a pullback in wave ((x)) that completed at 1.321. The pair then advanced in wave ((y)), which remains active and should extend further towards 1.33 to 1.34 before turning lower. This corrective rally is expected to be temporary, as the larger bearish sequence continues to dominate. As long as the pivot at 1.346 high stays intact, the rally should fail in seven swings and give way to renewed weakness. The overall technical picture reinforces the downside bias, suggesting GBPUSD is likely to extend its decline in line with the incomplete bearish sequence.
GBPUSD 60-Minute Elliott Wave Chart
GBPUSD Elliott Wave Video:
https://www.youtube.com/watch?v=KH5aUw_9a70
EURGBP Wave Analysis
EURGBP: ⬇️ Sell
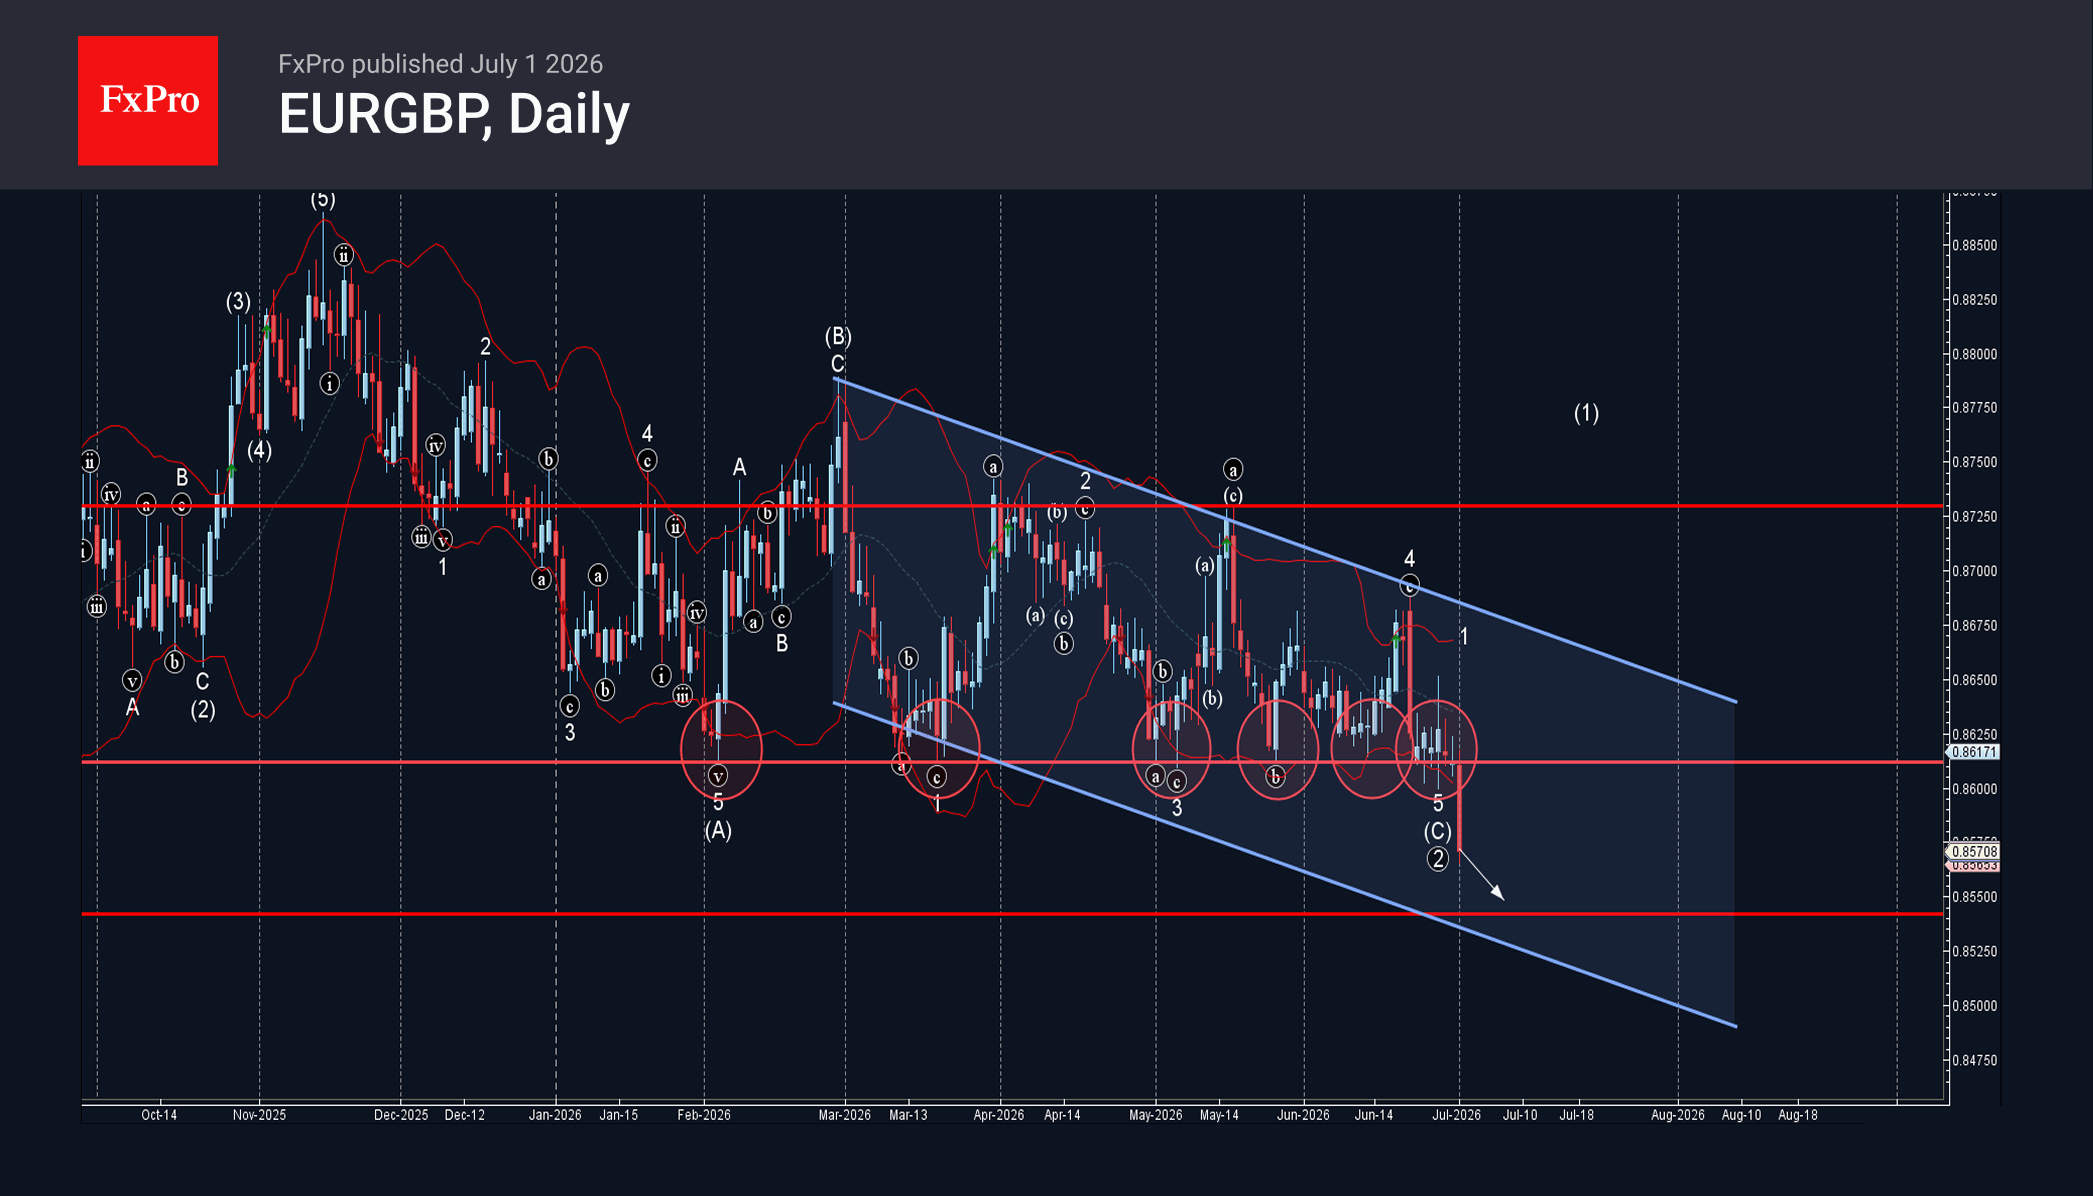
– EURGBP broke multi-month support level 0.8610
– Likely to fall to support level 0.8550
EURGBP currency pair recently broke below the strong multi-month support level 0.8610 (which has been steadily reversing the price from the start of this year).
The breakout of the support level 0.8610 should strengthen the bearish pressure on this currency pair in the coming trading sessions.
Given the clear daily downtrend and the bearish euro sentiment seen today, EURGBP currency pair can be expected to fall to the support level 0.8550.
Eco Data 7/2/26
| GMT | Ccy | Events | Act | Cons | Prev | Rev |
|---|---|---|---|---|---|---|
| 22:45 | NZD | Building Permits May | -4.00% | 10.90% | 11.10% | |
| 23:50 | JPY | Monetary Base Y/Y Jun | -13.70% | -10.00% | -12.20% | |
| 01:30 | AUD | Trade Balance (AUD) May | -3.02B | 2.18B | 1.79B | 1.38B |
| 06:30 | CHF | CPI M/M Jun | 0.00% | 0.10% | 0.20% | |
| 06:30 | CHF | CPI Y/Y Jun | 0.50% | 0.50% | 0.60% | |
| 09:00 | EUR | Eurozone Unemployment Rate May | 6.20% | 6.30% | 6.30% | 6.20% |
| 12:30 | USD | Initial Jobless Claims (Jun 26) | 215K | 218K | 215K | 216K |
| 12:30 | USD | Nonfarm Payrolls Jun | 57K | 114K | 172K | 129K |
| 12:30 | USD | Unemployment Rate Jun | 4.20% | 4.30% | 4.30% | |
| 12:30 | USD | Average Hourly Earnings M/M Jun | 0.30% | 0.30% | 0.30% | |
| 13:30 | CAD | Manufacturing PMI Jun F | 53 | 52.9 | ||
| 14:00 | USD | Factory Orders M/M May | -1.30% | 2.10% | 4.80% | 5.30% |
| 14:30 | USD | Natural Gas Storage (Jun 26) | 87B | 81B | 76B |
| 22:45 | NZD |
| Building Permits May | |
| Actual | -4.00% |
| Consensus | |
| Previous | 10.90% |
| Revised | 11.10% |
| 23:50 | JPY |
| Monetary Base Y/Y Jun | |
| Actual | -13.70% |
| Consensus | -10.00% |
| Previous | -12.20% |
| 01:30 | AUD |
| Trade Balance (AUD) May | |
| Actual | -3.02B |
| Consensus | 2.18B |
| Previous | 1.79B |
| Revised | 1.38B |
| 06:30 | CHF |
| CPI M/M Jun | |
| Actual | 0.00% |
| Consensus | 0.10% |
| Previous | 0.20% |
| 06:30 | CHF |
| CPI Y/Y Jun | |
| Actual | 0.50% |
| Consensus | 0.50% |
| Previous | 0.60% |
| 09:00 | EUR |
| Eurozone Unemployment Rate May | |
| Actual | 6.20% |
| Consensus | 6.30% |
| Previous | 6.30% |
| Revised | 6.20% |
| 12:30 | USD |
| Initial Jobless Claims (Jun 26) | |
| Actual | 215K |
| Consensus | 218K |
| Previous | 215K |
| Revised | 216K |
| 12:30 | USD |
| Nonfarm Payrolls Jun | |
| Actual | 57K |
| Consensus | 114K |
| Previous | 172K |
| Revised | 129K |
| 12:30 | USD |
| Unemployment Rate Jun | |
| Actual | 4.20% |
| Consensus | 4.30% |
| Previous | 4.30% |
| 12:30 | USD |
| Average Hourly Earnings M/M Jun | |
| Actual | 0.30% |
| Consensus | 0.30% |
| Previous | 0.30% |
| 13:30 | CAD |
| Manufacturing PMI Jun F | |
| Actual | 53 |
| Consensus | |
| Previous | 52.9 |
| 14:00 | USD |
| Factory Orders M/M May | |
| Actual | -1.30% |
| Consensus | 2.10% |
| Previous | 4.80% |
| Revised | 5.30% |
| 14:30 | USD |
| Natural Gas Storage (Jun 26) | |
| Actual | 87B |
| Consensus | 81B |
| Previous | 76B |
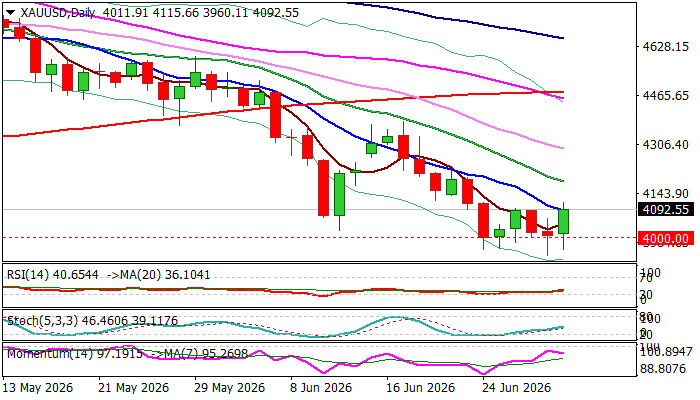
Gold Price Bounces on Positive News but Key Barrier Still Holds; US Labor Data in Focus
Gold price jumped on Wednesday (up 2.2% until early US session) following another failure at strong $4000 support (metal failed to register clear break below this level in six consecutive attempts.
Weaker than expected US private sector employment data for June and comments from Fed Chair Warsh that inflation risks have eased, lifted metal’s price.
Fresh strength cracked $4100 zone, ceiling of near-term congestion (reinforced by falling 10DMA), with sustained break here needed to generate initial positive signal and start reviving bulls for potential stronger recovery.
Supportive fundamentals (markets await Thursday’s release of June NFP report) still conflict with predominantly bearish structure on daily chart (14-d momentum remains in negative territory / MAs in bearish configuration, with the latest formation of 55/200DMA bear-cross) that continues to provide headwinds to recovery attempts.
Another failure to clear $4100 zone pivots would keep the price within the range, though bullishly aligned while holding in the upper part of the range, as studies on hourly and 4h charts have improved).
All eyes are on June labor data, with disappointing NFP to further weigh on recovery, while better than expected numbers would add to developing positive signals for stronger bounce.
Res: 4115; 4184; 4200; 4268
Sup: 4023; 4000; 3960; 3942
Brent Oil – Fresh Weakness Generates Initial Signal of Bearish Continuation
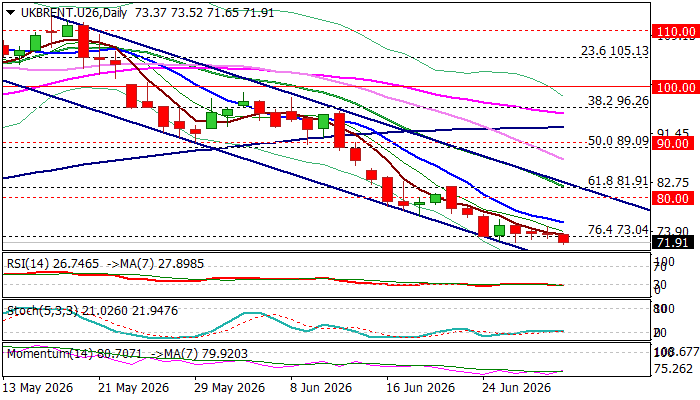
Brent price fell on Wednesday, after holding within narrow range in past two days, on track for eventual close below Fibo support at $73.04 (76.4% retracement of $58.70/$119.47 advance), after four consecutive failures at this level.
Persisting optimism on signals of progress of peace talks in the Middle East would open way normalization of supply through Hormuz strait, keep the price under pressure, along with warnings from market analysts about potential oversupply and signals that OPEC may raise oil production from August.
On the other hand, Russian ban on diesel exports, due to shortage in the local market, so far did not obstruct larger bears.
The contract ended trading in June with loss of 20%, the biggest drop since March 2020 and being in red for the second consecutive month that adds to negative outlook.
Fresh weakness cracked the floor of recent congestion ($72.00 zone), with firm break lower to generate initial signal of continuation of broader downtrend and expose targets at $70.50 (weekly Ichimoku cloud top) and $70 (psychological), guarding bear-channel support line ($68.20).
Firmly bearish daily studies contribute to negative picture, however oversold RSI warns that traders may opt for partial profit taking in coming sessions.
Res: 72.40; 73.04; 75.52; 76.87
Sup: 71.00; 70.50; 70.00; 69.15