Sample Category Title
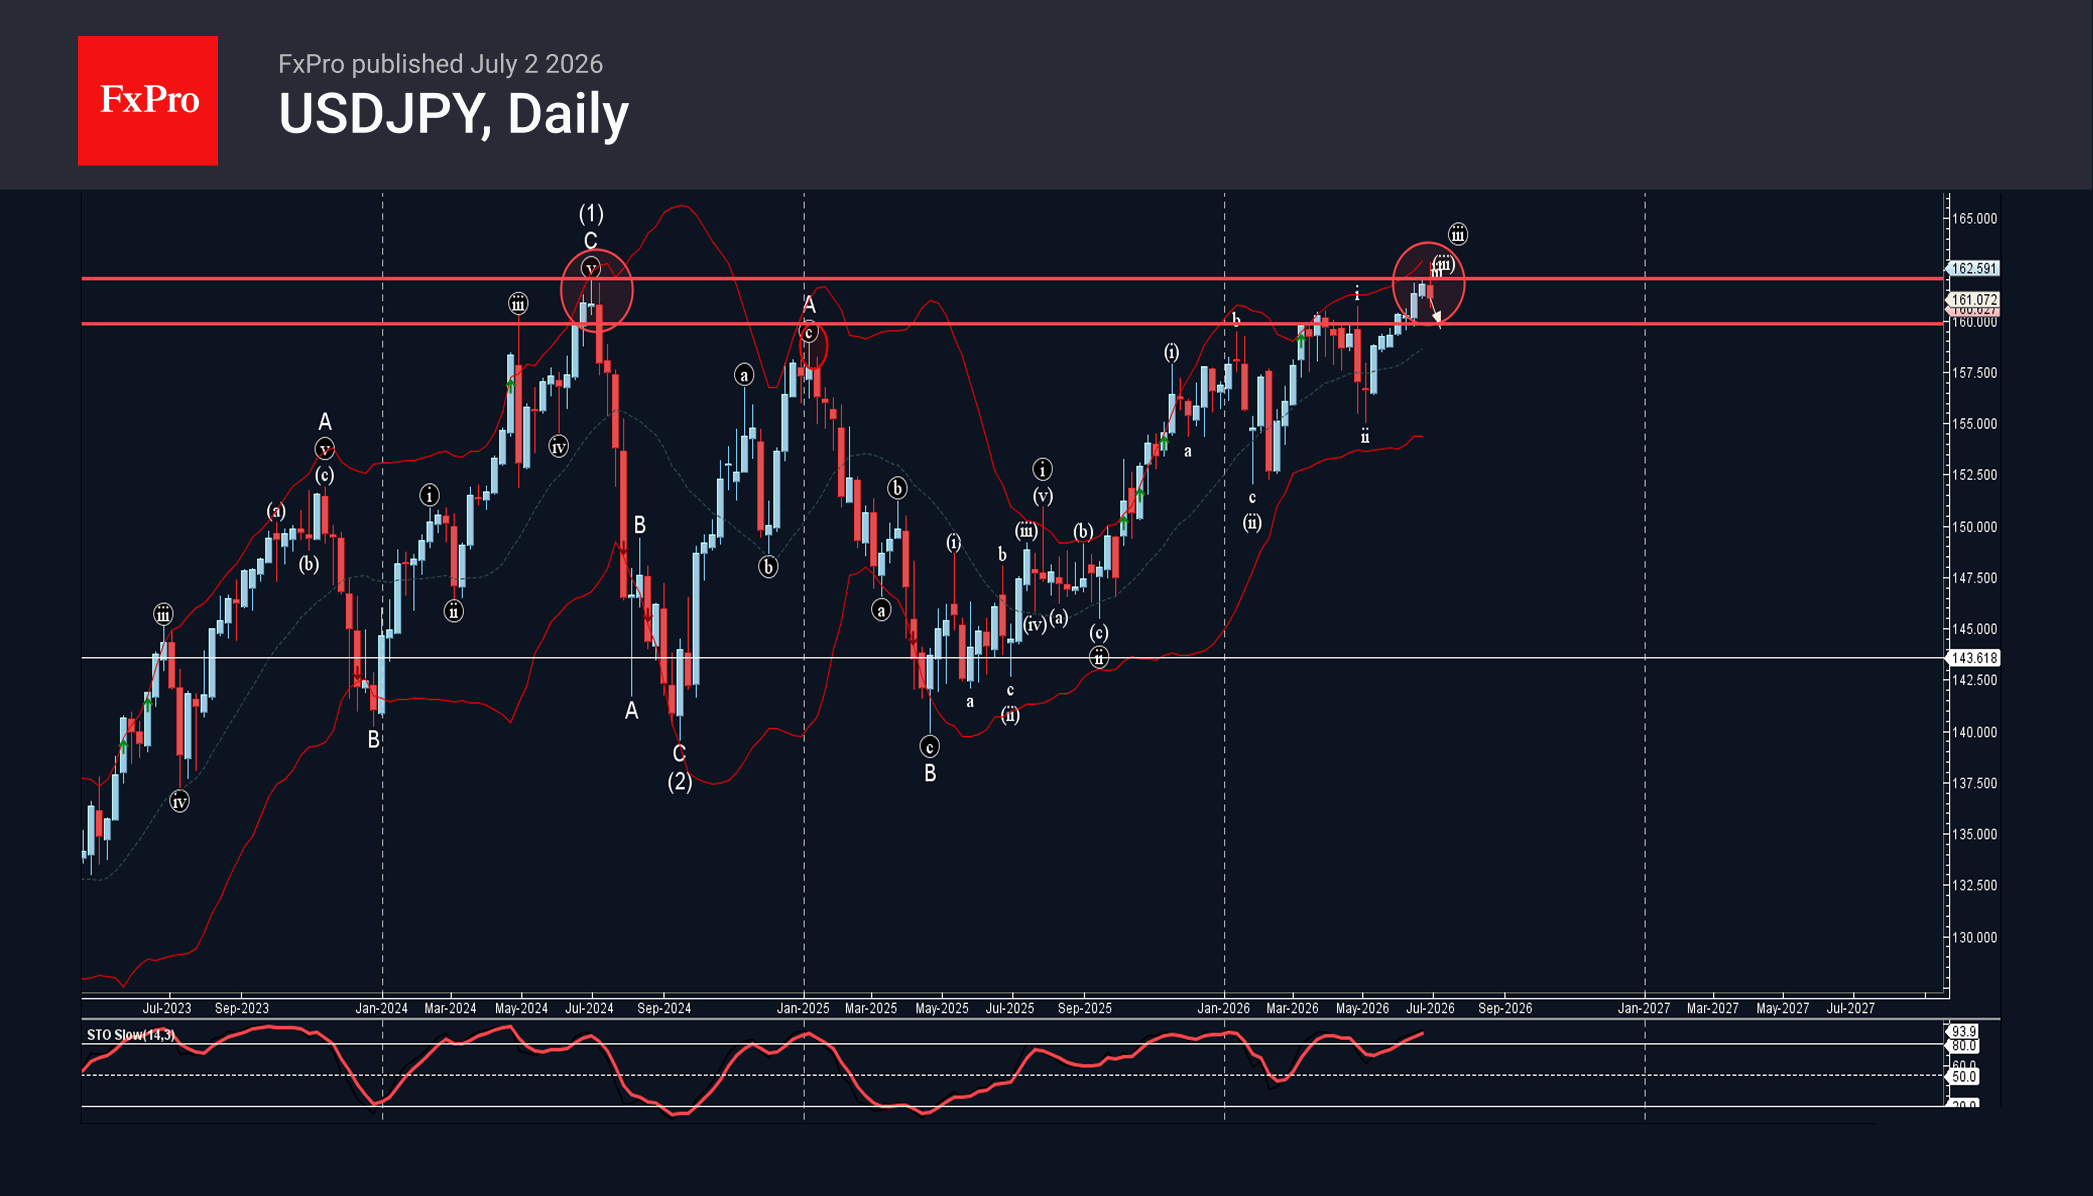
USDJPY Wave Analysis
USDJPY: ⬇️ Sell
– USDJPY reversed from the long-term resistance level 162.0
– Likely to fall to support level 160.00
USDJPY currency pair recently reversed from the resistance zone between the long-term resistance level 162.0 (which stopped the sharp weekly uptrend in 2024) and the upper weekly Bollinger Band.
The downward reversal from the resistance zone stopped the previous minor impulse wave iii – that belongs to wave B from 2025.
Given the strength of the resistance level 162.0 and the overbought weekly Stochastic, USDJPY currency pair can be expected to fall to the next support level 160.00.
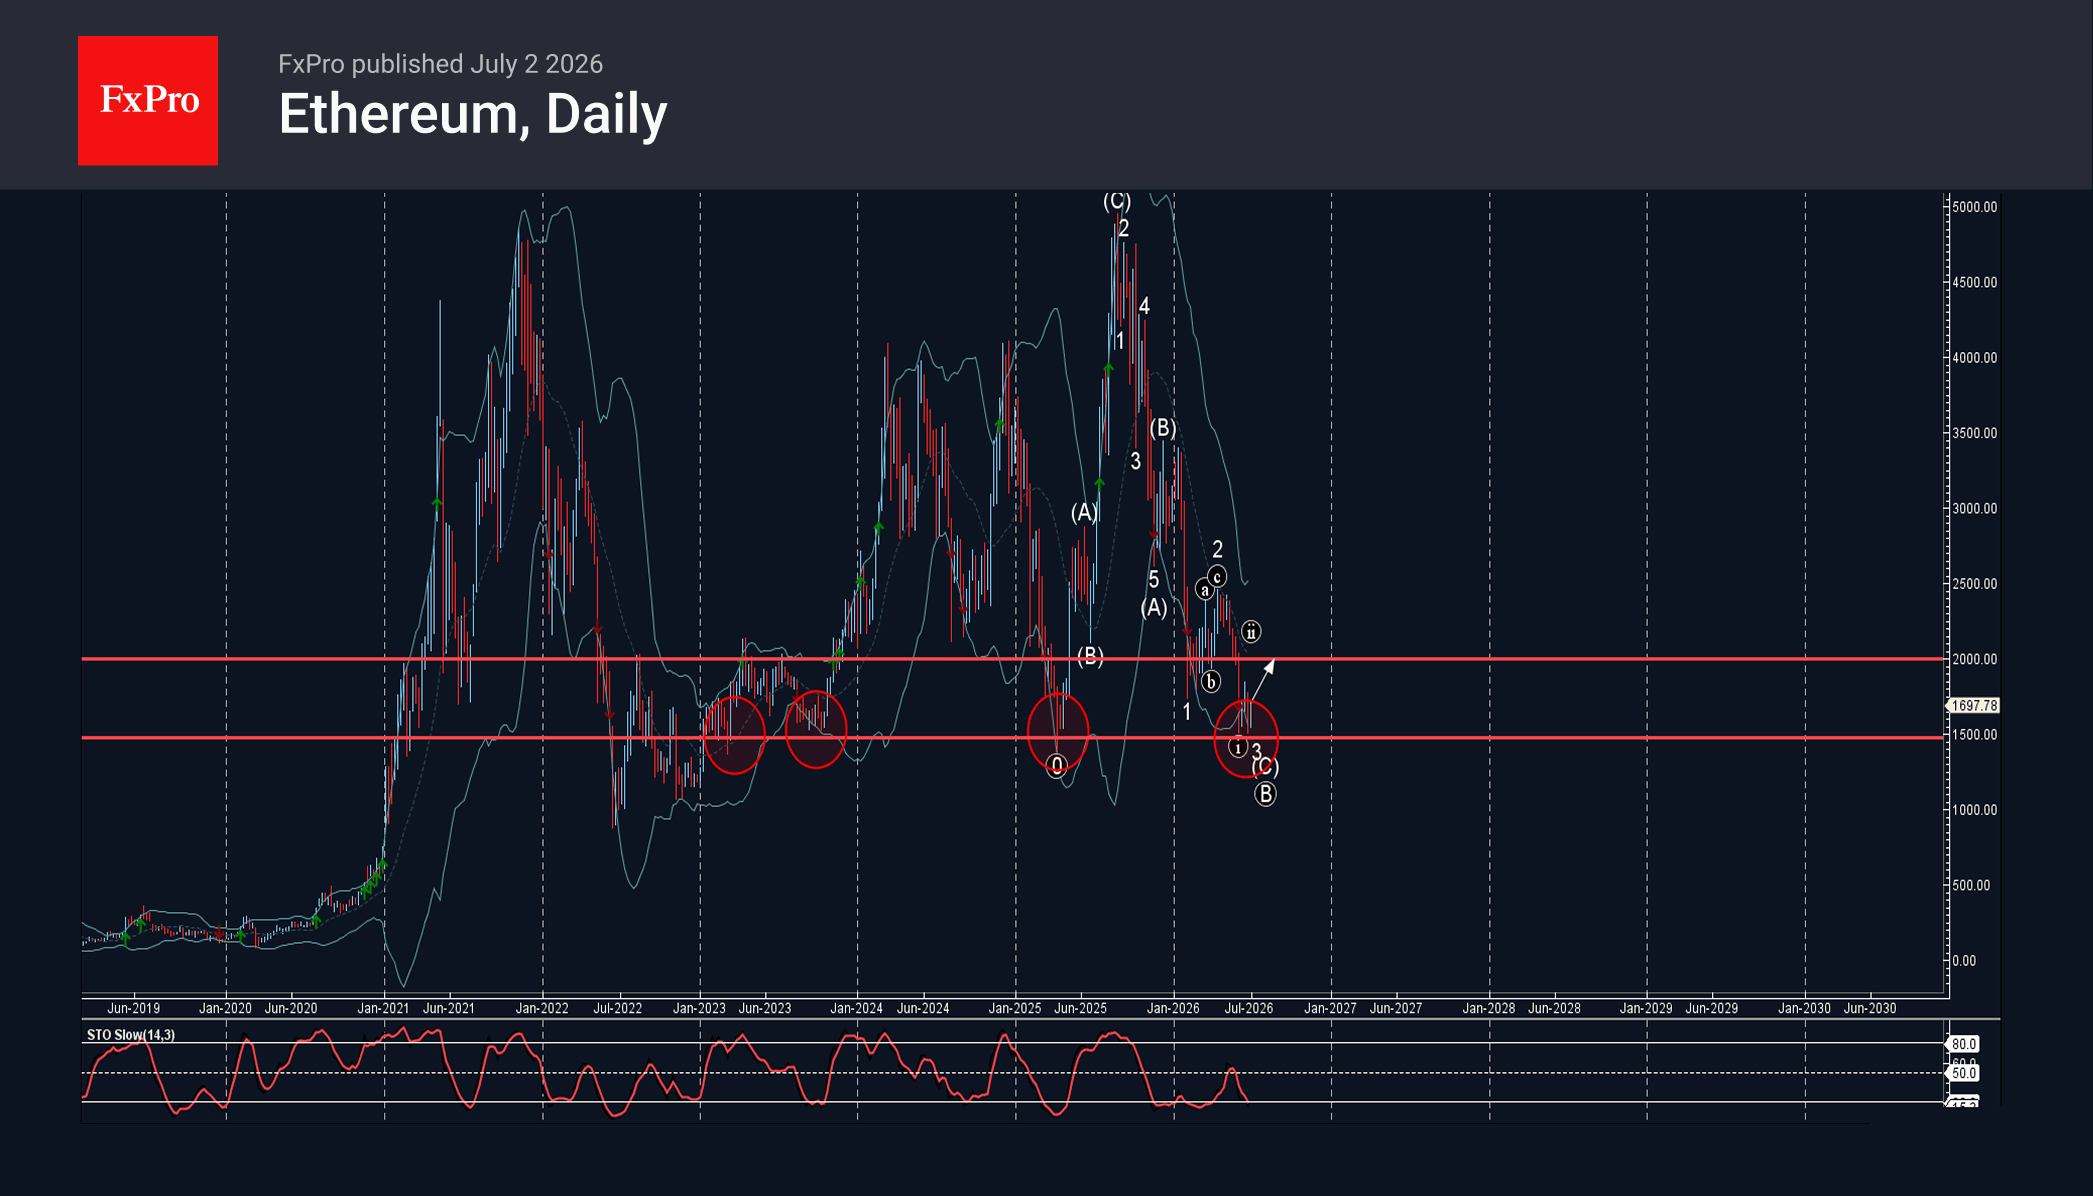
Ethereum Wave Analysis
Ethereum: ⬆️ Buy
– Ethereum reversed from long-term support level 1500.00
– Likely to rise to resistance level 2000.00
Ethereum cryptocurrency recently reversed up from the support zone between the long-term support level 1500.00 (which has been reversing the price from January) and the lower daily Bollinger Band.
The upward reversal from the support zone stopped the previous minor impulse wave 3.
Given the strength of the support level 1500.00 and the oversold daily Stochastic, Ethereum cryptocurrency can be expected to rise to the next resistance level 2000.00.
Eco Data 7/3/26
| GMT | Ccy | Events | Act | Cons | Prev | Rev |
|---|---|---|---|---|---|---|
| 23:00 | AUD | Services PMI Jun F | 50.5 | 49.9 | 49.9 | |
| 00:30 | JPY | Services PMI Jun F | 52.2 | 51.8 | 51.8 | |
| 01:45 | CNY | RatingDog Services PMI Jun | 54.1 | 53.6 | 54.4 | |
| 06:45 | EUR | France Industrial Output M/M May | -0.10% | -0.30% | 0.10% | 0.30% |
| 07:50 | EUR | France Services PMI Jun F | 46.8 | 47.4 | 47.4 | |
| 07:55 | EUR | Germany Services PMI Jun F | 48.6 | 46.8 | 46.8 | |
| 08:00 | EUR | Eurozone Services PMI Jun F | 49.4 | 48.9 | 48.9 | |
| 08:30 | GBP | Services PMI Jun F | 48.8 | 48.7 | 48.7 |
| 23:00 | AUD |
| Services PMI Jun F | |
| Actual | 50.5 |
| Consensus | 49.9 |
| Previous | 49.9 |
| 00:30 | JPY |
| Services PMI Jun F | |
| Actual | 52.2 |
| Consensus | 51.8 |
| Previous | 51.8 |
| 01:45 | CNY |
| RatingDog Services PMI Jun | |
| Actual | 54.1 |
| Consensus | 53.6 |
| Previous | 54.4 |
| 06:45 | EUR |
| France Industrial Output M/M May | |
| Actual | -0.10% |
| Consensus | -0.30% |
| Previous | 0.10% |
| Revised | 0.30% |
| 07:50 | EUR |
| France Services PMI Jun F | |
| Actual | 46.8 |
| Consensus | 47.4 |
| Previous | 47.4 |
| 07:55 | EUR |
| Germany Services PMI Jun F | |
| Actual | 48.6 |
| Consensus | 46.8 |
| Previous | 46.8 |
| 08:00 | EUR |
| Eurozone Services PMI Jun F | |
| Actual | 49.4 |
| Consensus | 48.9 |
| Previous | 48.9 |
| 08:30 | GBP |
| Services PMI Jun F | |
| Actual | 48.8 |
| Consensus | 48.7 |
| Previous | 48.7 |
Sunset Market Commentary
Markets
Markets were counting down to the June US payrolls as it could further shape expectations on Fed tightening and the implications for financial conditions globally. In the meantime, yield curves in Japan, the UK and Europe embarked on a steepening trend, a development that tentatively restarted over previous sessions. The short end of the curve apparently is 'better protected' as the comments from ECB and BoE policymakers of late suggest that the decline in the oil price is buying time to assess next policy steps. German yields rose between 2 bps (2-y) and 4.5 bps ahead of the US payrolls. For the UK and the Japanese yield curve this was respectively +2 bps (2-y) and 6 bps (30-y) and minus 0.6 bps and +5.7 bps (30-y). The move in JGBs was reinforced by an uninspiring 10-y JGB auction. Investors apparently still ask higher premia as the Japanese government aims for a supportive fiscal policy to propel (nominal) GDP growth. At the same time, it wants the BoJ to join (or at least not to counteract) this policy ambition. The rise in long-term bond risk premia this time didn't hurt the likes of sterling or the yen. After touching the highest level in 40 years (weakest for the yen) at USD/JPY 162.84 yesterday, the pair dropped to the 161.4 area ahead of the payrolls as markets apparently fear imminent interventions (e.g. in a context of thinner market liquidity when US markets are closed tomorrow). Sterling also gained further, extending yesterday's break below the 0.86 range bottom that marked the floor of a trading range at work for about a year. EUR/GBP traded near 0.856 ahead of the payrolls release. The euro also slightly outperformed the dollar but lost against the likes of the yen and sterling.
These moves evidently still had to be validated by the reaction to the US payrolls report. After three solid monthly reports, the US economy in June only created a net 57k jobs, with on top a negative revision of 74k for the previous two months. The miss was mainly due to a surprise decline in leisure and hospitality (-61k, potentially attributable to World Cup effects). Professional business services (+36k) and private education and health (+69k) contributed positively. There was also a marginal rise in manufacturing jobs (+3k). The unemployment rate (derived from the household survey) declined from 4.3% to 4.2%, but 'for the wrong reason'. Employment in this survey declined 507k, but less than the fall in the labour force (-720k), suggesting lower participation. Average hourly earnings printed as expected at 0.3% M/M and 3.5% Y/Y. The strong swings in the household survey probably won't go unnoticed by Fed Chair Warsh as the Fed is taking a look at data accuracy/reliability. Even so, the US yield curve steepens with the 2-y yield easing 4 bps. The 30-y still adds about 2 bp. Markets now only see about 20% probability of a July rate hike (from about 30%). A 25 bps step is now only fully discounted by December. Yields in EMU/Germany and the UK reacted only marginally compared to pre-payrolls levels (1-2 bps lower at the short end of the curve). The dollar faces a setback. DXY tumbles from the 101.2 area to currently trade near 100.8. EUR/USD rebounds to the 1.1445 area. Even the yen extends intraday gains against the dollar to trade near USD/JPY 161. Equities enjoy the 'diminishing chance' of tighter financial conditions. The Eurostoxx 500 gains 1.3%. The S&P escaped from a negative open (+0.3%).
News & Views
Germany's government coalition overcame weeks of friction to agree on a wide-ranging reform package aimed at reviving the economy's long-term growth potential and reforming social welfare, the pension system and the labour market. It also includes support for critical sectors such as AI, semiconductors and batteries. It also offers €10bn in annual income tax relief for small- to middle-earning households. Discussions about the eventual 34-point package got an important boost last week when coalition partners largely agreed on the pension overhaul while they were still apart on the tax cuts. CDU conservatives had long resisted financing it (partially) with a higher tax rate on top earners. The legislative blueprint is meant to evolve into a comprehensive plan by the parliamentary summer recess that begins at the end of next week.
Swiss inflation stagnated in June on a monthly basis, allowing the Y/Y figure to cool down from 0.6% to 0.5%. Core CPI defied an expected uptick to 0.4% by matching May's 0.3% y/y. Prices increased for fruiting vegetables, stem vegetables, hotels and other accommodation providers as well as for car rental and car sharing. These were offset by lower prices, mainly for energy-related products. Recent weakening of the franc doesn't appear to have filtered through yet with imported inflation falling by 0.4% m/m, to be up only 0.2% y/y. EUR/CHF traded unchanged on the release before slipping through 0.92, but the pair bounced back to trade slightly lower on the day around that big figure. Swiss money markets continue to lean toward a rate hike rather than a cut from zero. The implied probability for such a move this year is low (approximately 25%).
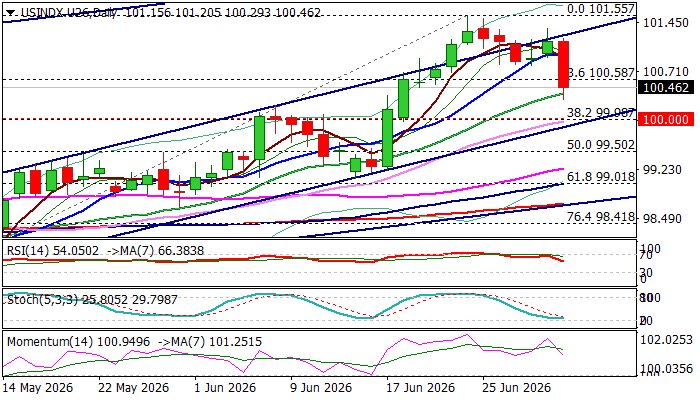
Dollar Falls on Disappointing US June NFP Numbers
The US dollar fell across the board on Thursday, hit by disappointing US labor data, (June NFP 57K vs 114K f/c and downwardly revised May result to 129K from 172K) reflecting significantly weaker than expected job growth last month.
The dollar Index, which tracks performance of dollar against the basket of six major currencies, fell 0.6% in immediate reaction to economic data and hit the lowest level in two weeks.
Softer than expected June labor data provide temporary relief to the Fed and fade expectations for rate hike in July, amid recent hawkish shift in the central bank’s narrative, although bets for September’s rate hike remain high.
Fresh weakness undermined larger bulls on completion of bearish failure swing pattern on daily chart and violation of initial Fibo support at 100.58 (23.6% retracement of 97.44/101.55 rally) though close below the latter will be needed to verify signal.
However, technical picture on daily chart remains bullish, with south-turning momentum indicators, still holding well in the positive territory, showing more space for correction.
Dips should ideally find firm ground at 100 zone (psychological / Fibo 38.2% retracement / bull-channel support line) to keep larger bulls in play and mark a healthy correction ahead of fresh extension of larger uptrend.
Res: 100.96; 101.55; 102.00; 102.40
Sup: 100.29; 100.00; 99.50; 99.24
US: Payrolls Cool in June, But Unemployment Rate Falls to 4.2%
Nonfarm payrolls rose by 57k in June, lower than the Bloomberg consensus forecast of 113k. Revisions to the two prior months were 74k lower.
- Smoothing through volatility, payrolls averaged 111k over the last three months, stronger than the 42k averaged over the last twelve months.
Private payrolls rose 49k, slower than the 97k recorded in May. Job gains were concentrated in professional & business services (+36k) and health care & social assistance (+46.6k). Leisure & hospitality shed 61k last month, following a large jump the month prior. Meanwhile, government added 8k new positions.
In the household survey, the labor force plummeted by 720k, larger than the still hefty decline in civilian employment (-507k). As a result, the unemployment rate fell 11 basis points to a twelve-month low of 4.2%.
Average hourly earnings rose 0.3% month-on-month (m/m), pushing the year-ago measure to 3.5% (from 3.4% the month prior).
Key Implications
Payrolls moderated in June, following a string of exceptionally strong gains in each of the prior three months. The pullback hardly came as a surprise, especially given the large gains in leisure & hospitality and local government the month prior. That said, job growth is still considerably stronger than a year ago, and is also running slightly above the estimated breakeven rate, which helped to push the unemployment rate to a twelve-month low of 4.2%.
While the labor market has clearly turned a corner, this morning's weaker headline print combined with the downward revisions suggests it's stopping short of a full-blown reacceleration. Market odds for a July hike were completely pushed back following the release (a hike was 30% priced ahead of payrolls), with all eyes now turning to the June CPI (scheduled for July 14th). While a hotter reading could swing odds back in favor of a summer hike, we still think the bar for policy tightening is high. Today's policy rate remains somewhat in restrictive territory and provided inflation cools as expected in H2-2026, it will lead to a natural tightening in the real fed funds rate.
EUR/USD Daily Outlook
EUR/USD's rebound from 1.1323 extended higher today, but it's still capped below 1.1499 support turned resistance. Intraday bias remains neutral and further decline is in favor. On the downside, break of 1.1323 will resume the fall from 1.2081 to 100% projection of 1.2081 to 1.1408 from 1.1848 at 1.1175. However, decisive break of 1.1499 will turn bias back to the upside for 55 D EMA (now at 1.1559) and above.
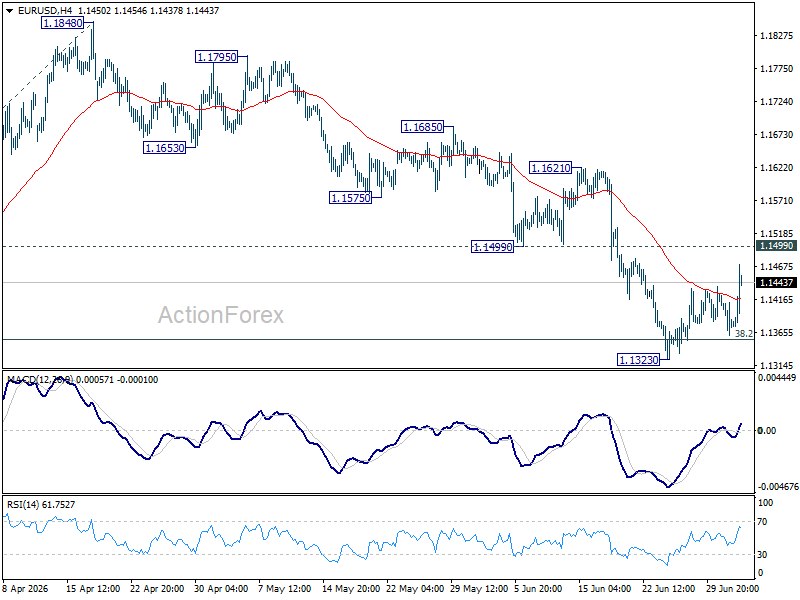
In the bigger picture, focus is back on 38.2% retracement of 1.0176 to 1.2081 at 1.1353. Decisive break there will revive the case of medium term bearish trend reversal after rejection by 1.2 key cluster resistance level. Further fall should be seen to 61.8% retracement at 1.0904. Nevertheless, strong rebound from 1.1353, followed by break of 1.1621 resistance, will retain medium term bullishness.
GBP/USD Daily Outlook
GBP/USD's strong break of 1.3300 support turned resistance suggests that fall from 1.3650 has completed at 1.3139 already. Intraday bias is back on the upside for 1.3459 resistance. Firm break there will argue that correction from 1.3867 has completed too, and target 1.3657 for confirmation. On the downside, below 1.3264 minor support will turn intraday bias neutral again first.
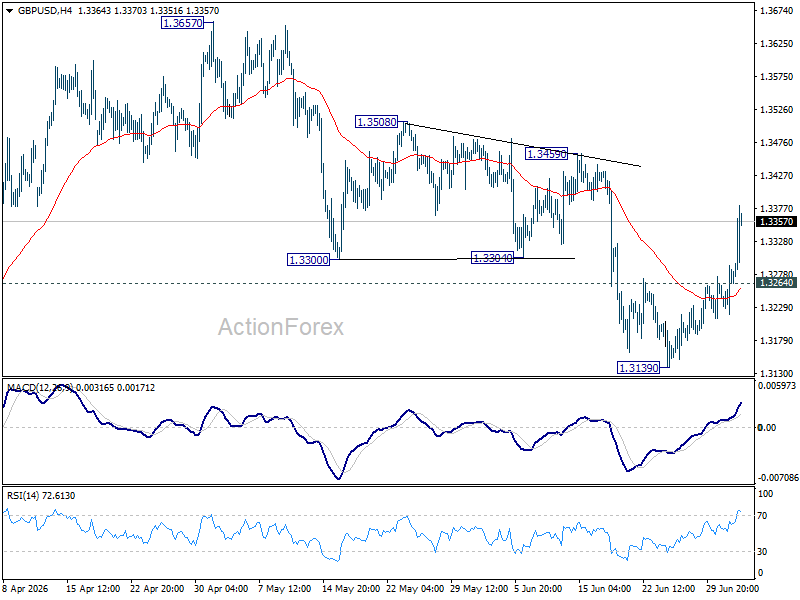
In the bigger picture, price actions from 1.3867 are a corrective pattern within the broader up trend from 1.0351 (2022 low). With 1.3008 support intact, medium term bullishness is maintained and break of 1.3867 is in favor for a later stage, towards 1.4248 key resistance (2021 high). However, firm break of 1.3008 will at least bring deeper fall to 38.2% retracement of 1.0351 to 1.3867 at 1.2524, with increased risk of bearish reversal.
USD/CHF Daily Outlook
USD/CHF's fall from 0.8139 extends lower today but it's still holding on to 0.8012 resistance turned support. Intraday bias stays neutral first. On the upside, above 0.8139 will extend the larger rise from 0.7603 to 100% projection 0.7603 to 0.8041 from 0.7600 at 0.8198 next. However, sustained break of 0.8012 will bring deeper fall to 55 D EMA (now at 0.7949) and below.
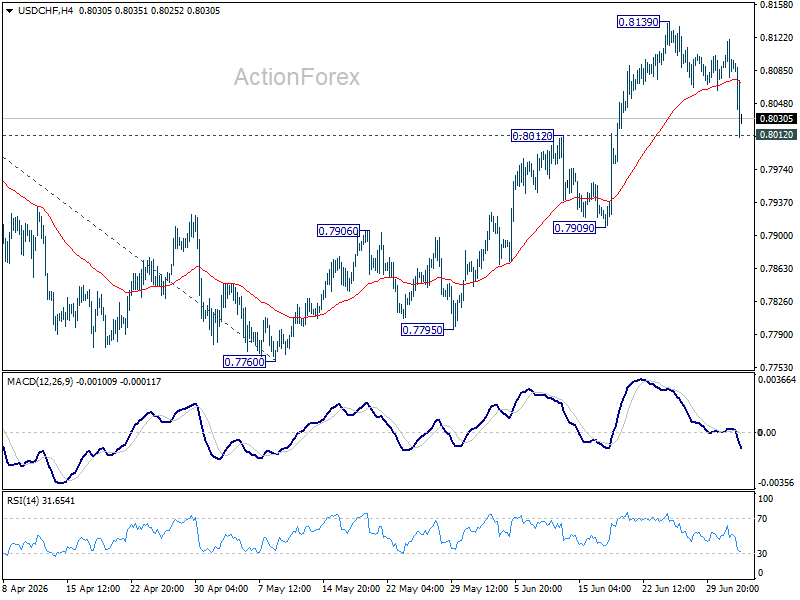
In the bigger picture, while a medium term bottom was formed at 0.7603, it's still early to call for bullish trend reversal. As long as 38.2% retracement of 0.9200 (2025 high) to 0.7603 at 0.8213 holds, the larger down trend could still continue through 0.7603 at a later stage. However, firm break of 0.7603 will argue that the trend has reversed and turn focus to 0.8332 support turned resistance (2023 low) for confirmation.
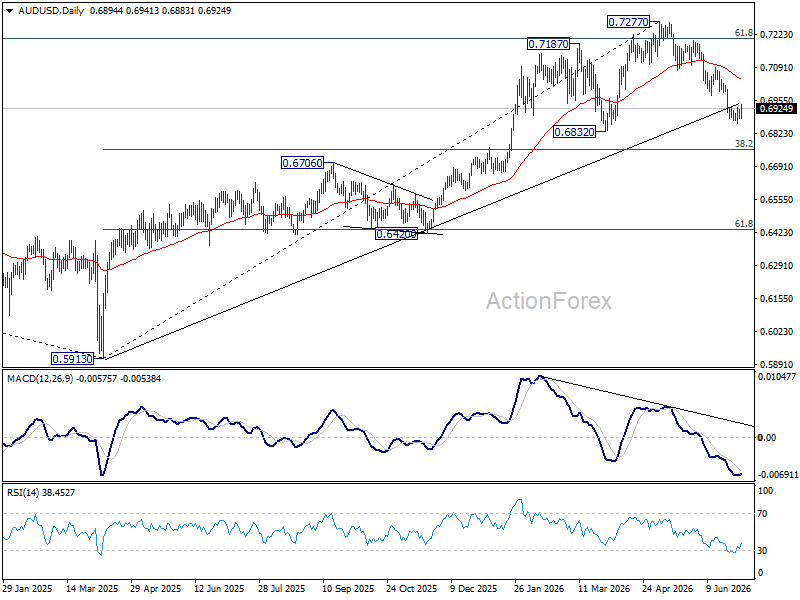
AUD/USD Daily Report
AUD/USD recovers further as consolidations from 0.6864 continues. But upside is limited below 0.6977 support turned resistance. Intraday bias remains neutral, and further decline is in favor. Below 0.6864 will extend the fall from 0.7277 to 0.6832 support. Firm break there will target 0.6756 fibonacci level.
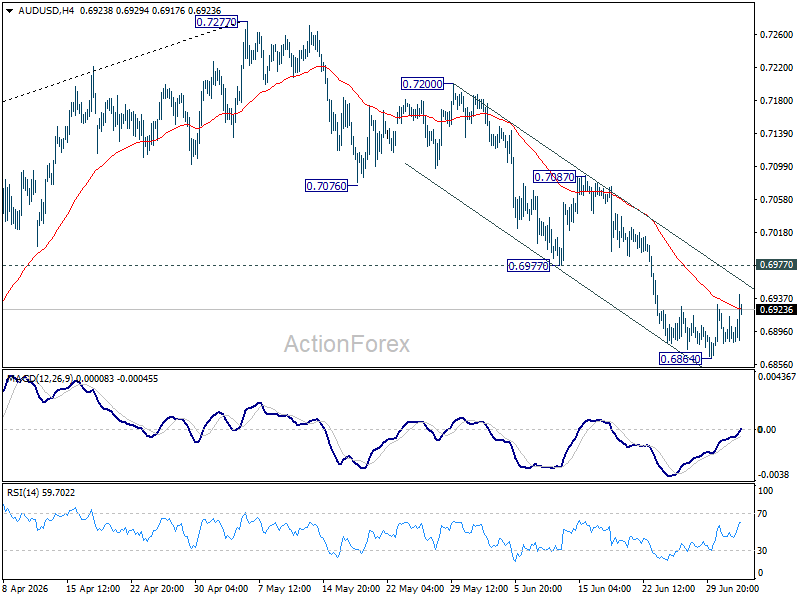
In the bigger picture, considering bearish divergence condition in D MACD, a medium term top could be formed at 0.7277 after failing to sustain above 61.8% retracement of 0.8006 (2021 high) to 0.5913 (2024 low) at 0.7206. Deeper fall could be seen to 38.2% retracement of 0.5913 to 0.7277 at 0.6756 as a correction. But strong support should be seen there to bring rebound. Consolidations would continue below 0.7277 for a while.