
Sample Category Title
AUD/USD Daily Report
Intraday bias in AUD/USD remains neutral at this point. Further decline is expected as long as 0.6977 support turned resistance holds. Below 0.6864 will extend the fall from 0.7277 to 0.6832 support. Firm break there will target 0.6756 fibonacci level. However, sustained break of 0.6977 will bring stronger rebound to 0.7087 resistance instead.
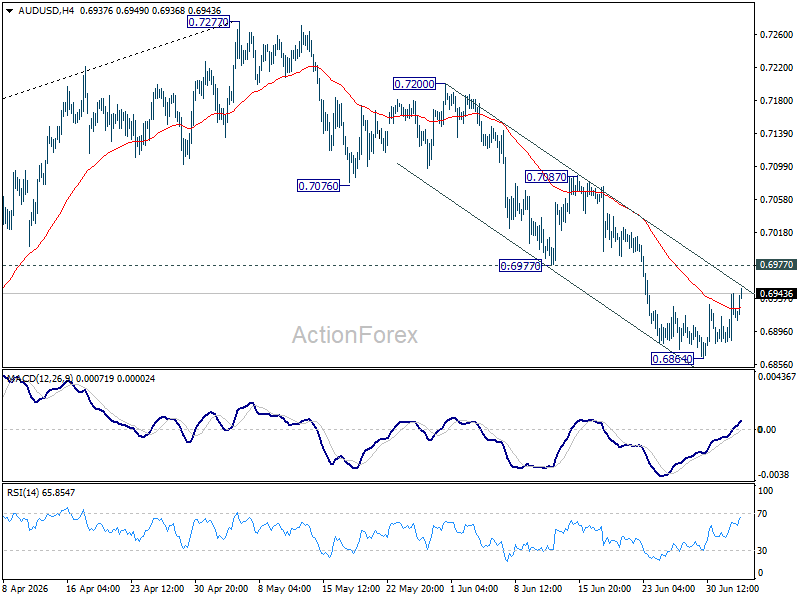
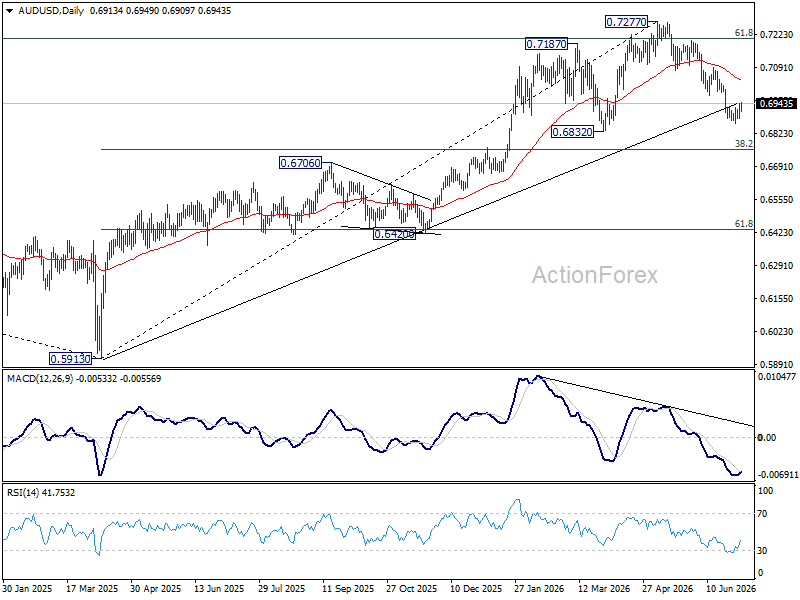
In the bigger picture, considering bearish divergence condition in D MACD, a medium term top could be formed at 0.7277 after failing to sustain above 61.8% retracement of 0.8006 (2021 high) to 0.5913 (2024 low) at 0.7206. Deeper fall could be seen to 38.2% retracement of 0.5913 to 0.7277 at 0.6756 as a correction. But strong support should be seen there to bring rebound. Consolidations would continue below 0.7277 for a while.
USD/CAD Daily Outlook
Intraday bias in USD/CAD remains neutral first. Consolidation form 1.4247 is extending and deeper pullback cannot be ruled out. But downside should be contained above 1.3965 resistance turned support. Above 1.4247 will resume the rally from 1.3480 to 61.8% retracement of 1.4791 to 1.3480 at 1.4290. Firm break there will pave the way back to 1.4791 high.
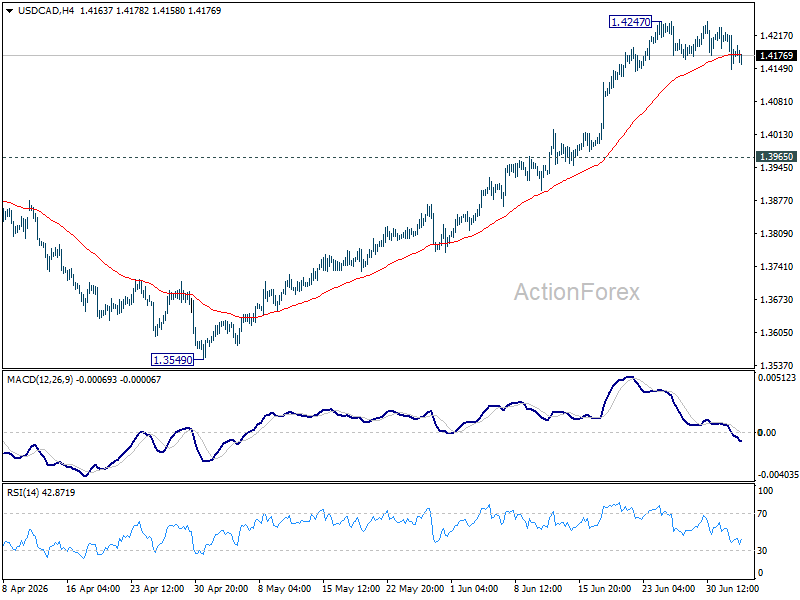
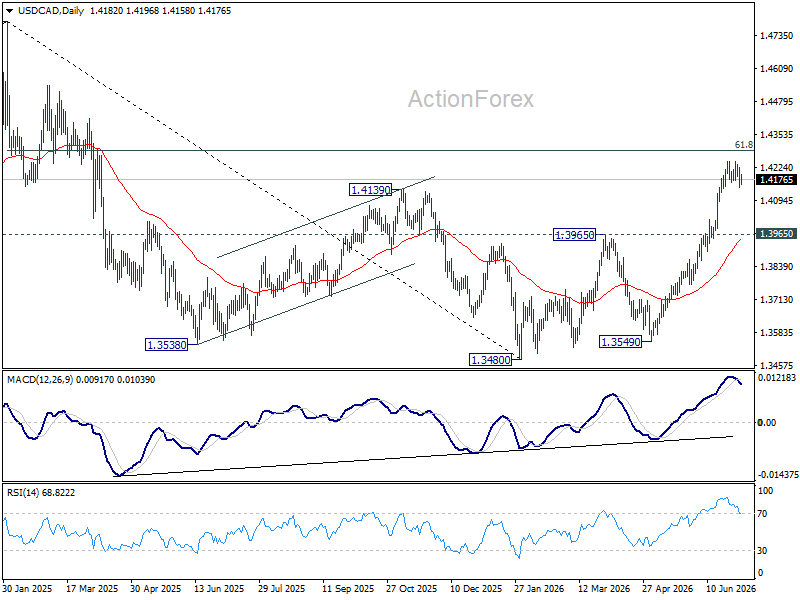
In the bigger picture, current development suggests that fall from 1.4791 has completed as a three wave correction to 1.3480. It's still early to judge if rise from there a corrective bounce, or resumption of the larger up trend from 1.2005 (2021 low). But in either case, retest of 1.4791 high should be seen next.
GBP/JPY Daily Outlook
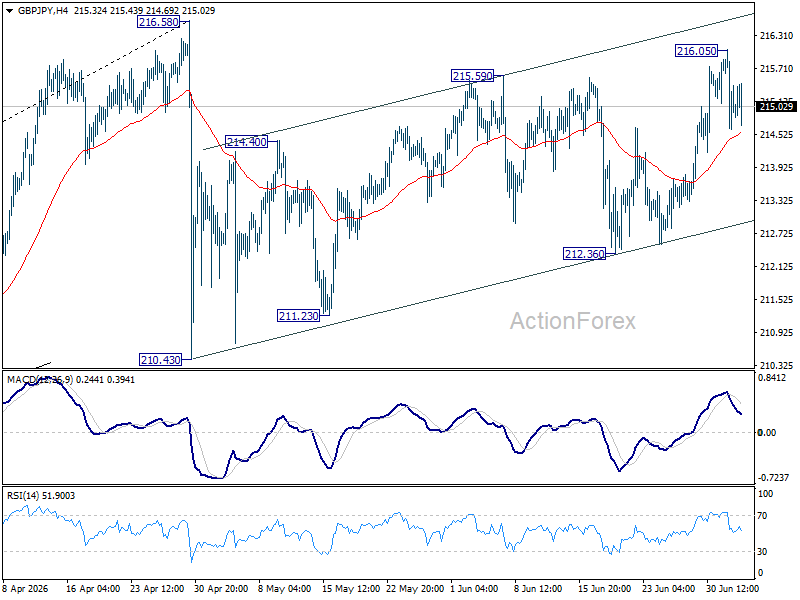
Intraday bias in GBP/JPY remains neutral for the moment. On the upside, above 216.05 will extend the rebound from 210.43 to retest 216.58 high. For now, risk will stay on the upside as long as 212.36 support holds, in case of retreat.
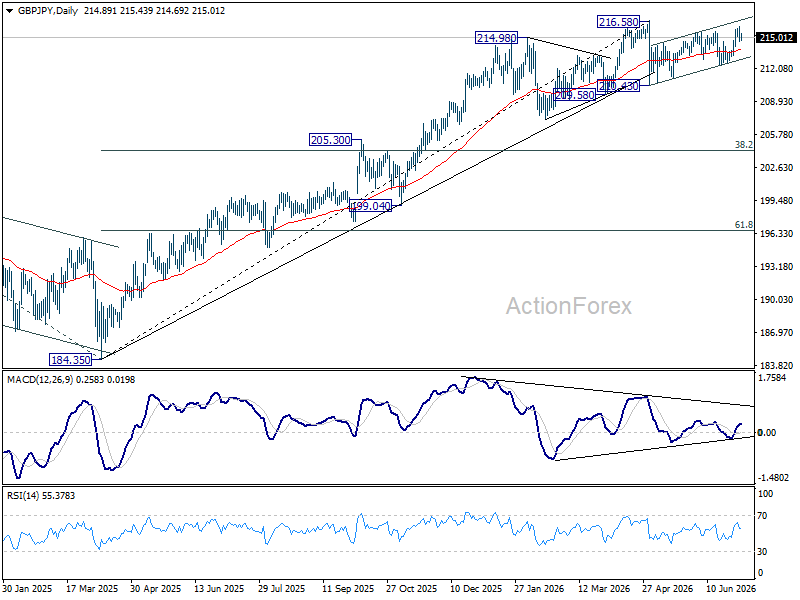
In the bigger picture, there is no clear sign of trend reversal yet. The long term up trend could still extend to 61.8% projection of 148.93 (2022 low) to 208.09 (2024 high) from 184.35 at 220.90 on resumption. However, sustained break of 55 W EMA (now at 207.52) will argue that it's already in medium term down trend for 184.35 support.
EUR/JPY Daily Outlook
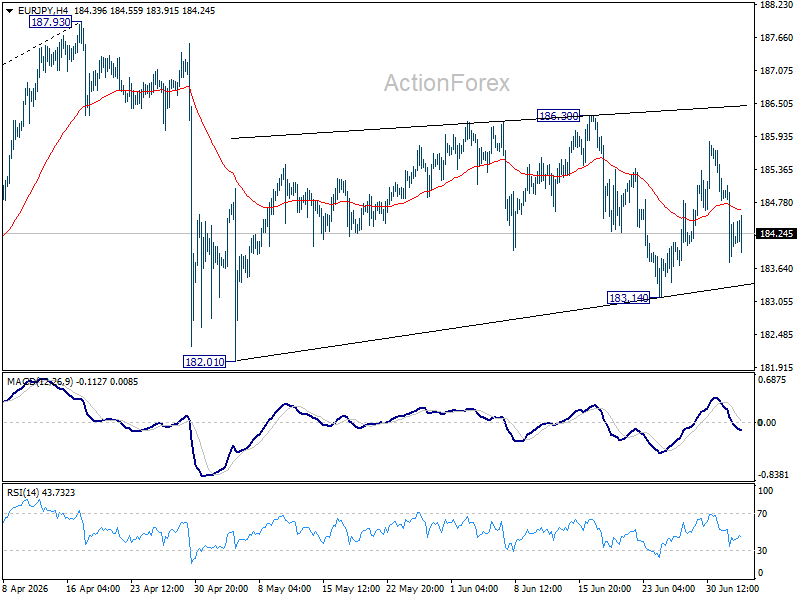
Sideway trading continue in EUR/JPY and intraday bias stays neutral. Risk will remain mildly on the downside as long as 186.30 resistance holds. Below 183.14 will bring retest of 182.01 support first. However, firm break of 186.30 will resume the rebound from 182.01 to retest 187.93 high.
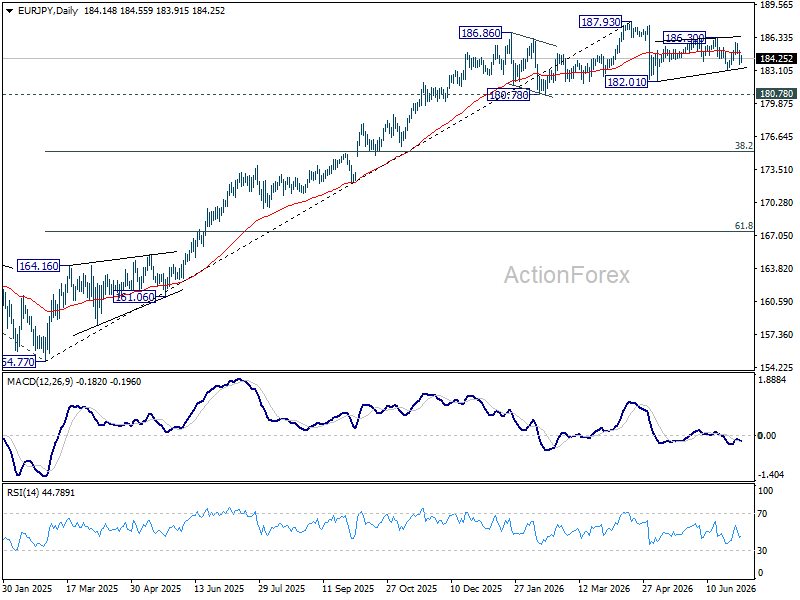
In the bigger picture, there is no sign of reversal yet. Uptrend from 114.42 (2020 low) is still expected to resume at a later stage to 78.6% projection of 124.37 (2022 low) to 175.41 (2025 high) from 154.77 at 194.88. However, sustained break of 55 W EMA (now at 179.37) will argue that it's already in a medium term down trend to 175.41 resistance turned support and below.
EUR/GBP Daily Outlook
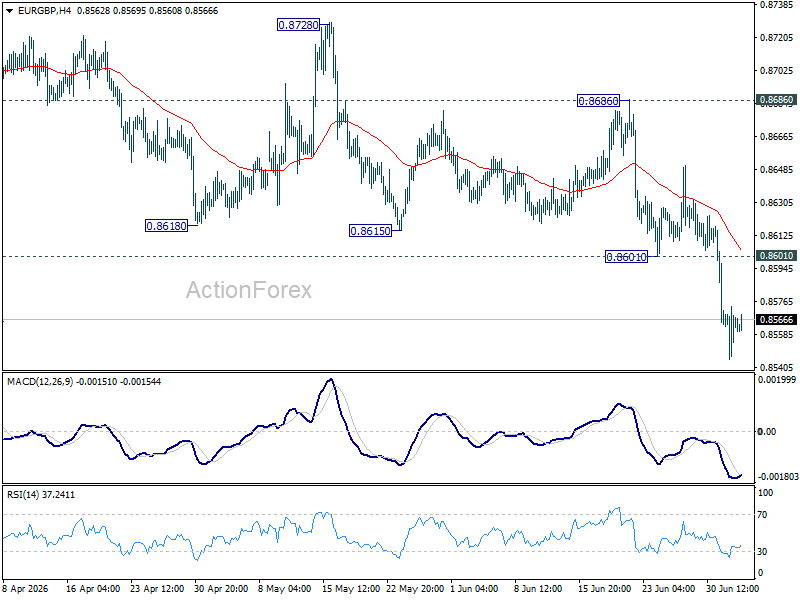
Intraday bias in EUR/GBP stays on the downside at this point. Fall from 0.8863 should target 61.8% retracement of 0.8221 to 0.8863 at 0.8466 at next. On the upside, above 0.8601 minor resistance will turn bias neutral first. But risk will stay on the downside as long as 0.8686 resistance holds, in case of recovery.
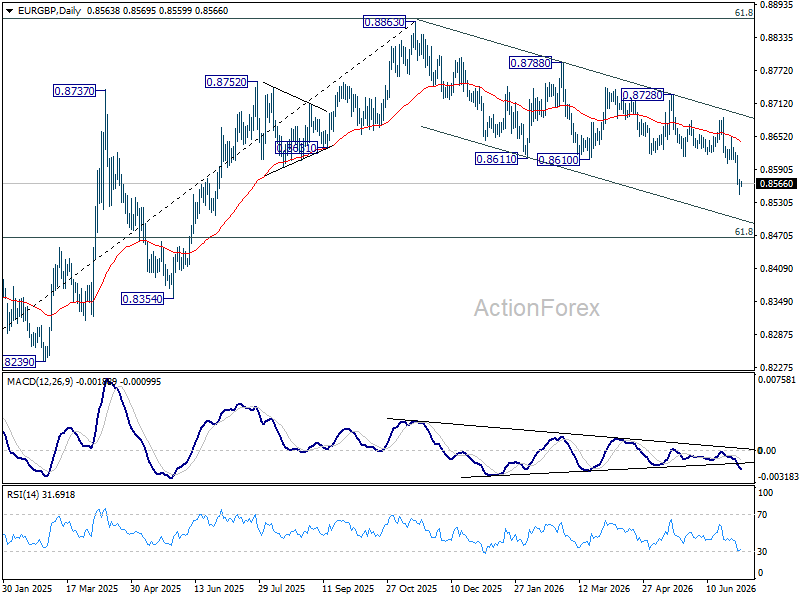
In the bigger picture, current development suggests that rise from 0.8221 (2024 low) has completed at 0.8863, just ahead of 38.2% retracement of 0.8221 (2024 low) to 0.8863 (2025 high) at 0.8618. Deeper fall would be seen back to 0.8201 (2022 low). For now, outlook will be neutral at beast as long as 0.8863 hold.
EUR/AUD Daily Outlook
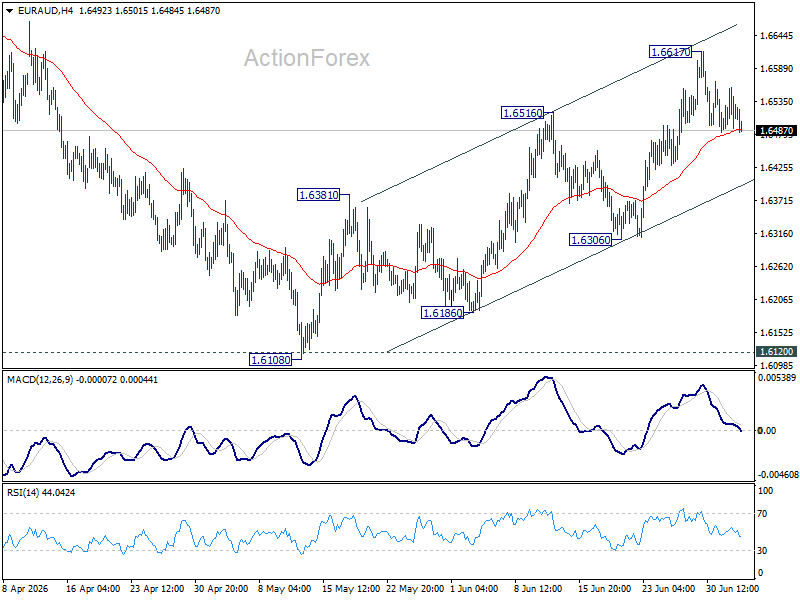
Intraday bias in EUR/AUD remains neutral as consolidations continue below 1.6617. Further rally remains in favor as long as 1.6306 support holds. Break of 1.6617 will resume the rally from 1.6108 towards 1.6842 resistance.
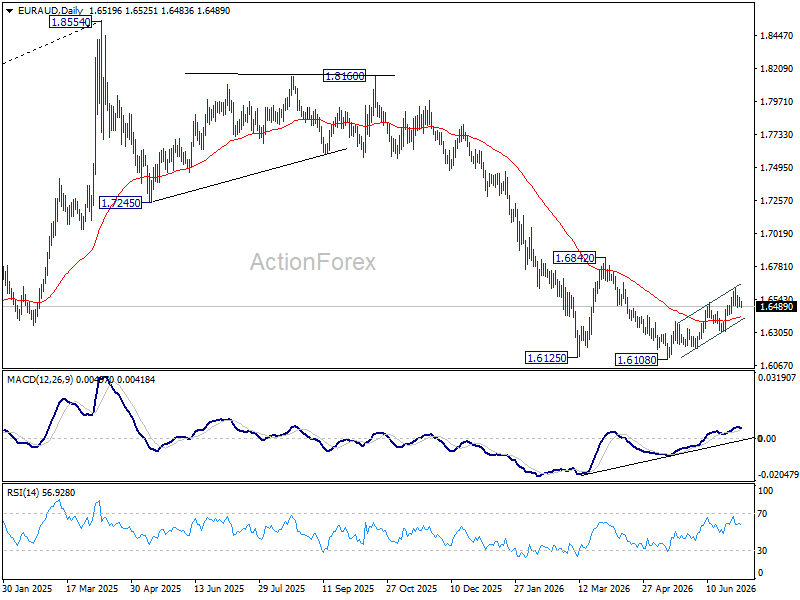
In the bigger picture, outlook will stay bearish as long as 1.6842 resistance holds. Fall from 1.8554 (2025 high) is expected to continue to 61.8% retracement of 1.4281 to 1.8554 at 1.5913. Decisive break there will pave the way back to 1.4281 (2022 low). However, firm break of 1.6842 should confirm medium term bottoming, and bring stronger rally.
EUR/CHF Daily Outlook
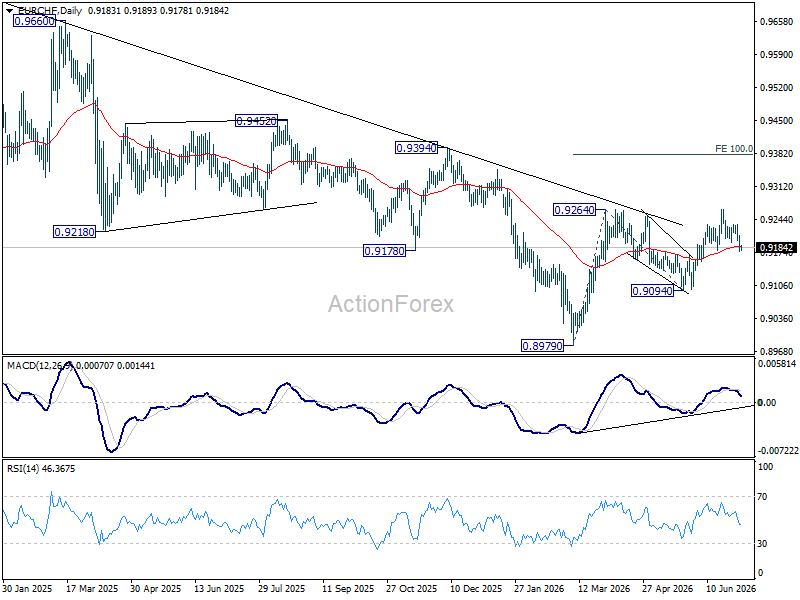
Intraday bias in EUR/CHF remains neutral as it's still defending 0.9179 support. On the upside, above 0.9234 will bring stronger rebound to 0.9265. Firm break there will resume the rally from 0.8979 to 100% projection of 0.8979 to 0.9264 from 0.9094 at 0.9379. However, decisive break of 0.9179 will dampen this bullish view and bring deeper fall back to 0.9094 support instead.
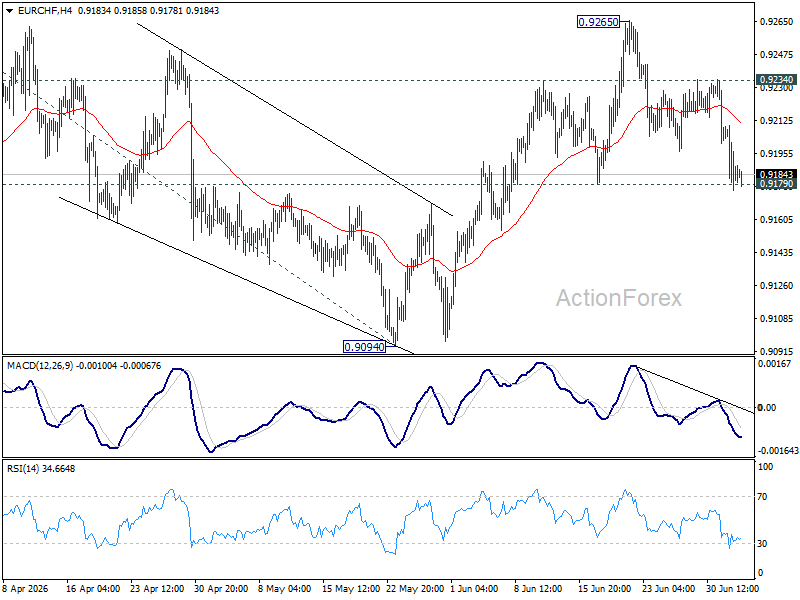
In the bigger picture, the break of medium term falling trend line resistance indicates that 0.8979 is already a medium term bottom. Considering bullish convergence condition in W MACD, rise from there should at least be reversing the fall from 0.9928, with prospect of developing into a medium term up trend. Firm break of 0.9394 resistance will add more credence to this case. For now risk will remain on the upside as long as 0.9094 support holds, in case of retreat.
Eurozone PMI Services Stabilize While Cooling Inflation Supports ECB Pause
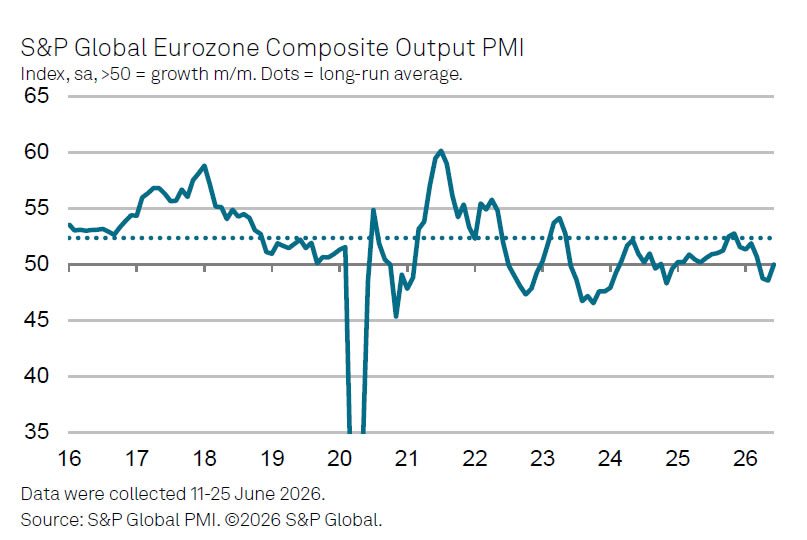
Eurozone business activity stabilized in June as the downturn in the services sector eased and manufacturing continued to expand. The final S&P Global Eurozone Composite PMI Output Index rose to 50.0 from 48.5 in May, a three-month high that marked the end of two consecutive months of declining output. Meanwhile, the Services PMI Business Activity Index improved to 49.4 from 47.7, also a three-month high, although it remained just below the 50 threshold separating expansion from contraction.
According to S&P Global Chief Business Economist Chris Williamson, the improvement reflects a sharp easing in inflationary pressures following the collapse in energy prices after the US-Iran ceasefire. Input cost inflation in the services sector fell at its fastest pace since the survey began in 1998, excluding only the extraordinary declines seen during the COVID-19 lockdowns. The moderation in costs helped revive activity in sectors hit hardest by the Middle East conflict, particularly leisure and tourism, while business confidence strengthened to its highest level since the war began as firms anticipated further improvement in demand.
The survey reinforces the view that the worst of the energy-driven slowdown may be over, but it also strengthens the case for policy patience at the European Central Bank. Williamson noted that the near-unprecedented easing in cost pressures is likely to soften some of the more hawkish views within the Governing Council, reducing the need for additional rate hikes in the near term. With inflation cooling more rapidly and growth beginning to stabilize, policymakers now have greater scope to pause and assess how quickly price pressures continue to fade during the second half of the year.
| Indicator | Previous | Latest |
|---|---|---|
| Composite PMI Output | 48.5 | 50.0 |
| Services PMI Business Activity | 47.7 | 49.4 |
Sunrise Market Commentary
Markets
Yesterday's US payrolls were supposed to deliver key input for the Fed decision making process as Fed Chair Warsh at the start of its mandate promised that the US central bank will deliver on its price stability mandate. Strong US payrolls over previous months suggested that the 'second pillar' of the Fed's mandate, maximum employment, didn't need any Fed attention/support for now. However, the June payrolls missed expectations. One data set of course doesn't change the broader picture, but it also didn't raise the momentum for the Fed to take action. The US in June added a net 57k of jobs vs 113k expected. The numbers of the previous two months also were downwardly revised by 74k. The negative surprise was mainly due to an unexpected negative contribution of leisure and hospitality (-61k). Professional business services (+36k) and private education and health (+69k) contributed positively. The unemployment rate (derived from a different consumer survey) eased from 4.3% to 4.2%, but this was mainly due to decline in labour market participation (labour force declined 720k and employment 'only' declined 507k according to this survey). Average hourly wages at 0.3% M/M and 3.5% Y/Y were as expected. The 'remarkable swings' in some of the underlying data at least suggest that there might be a case for Fed Warsh's initiative to let one of his task forces take a look at the 'use and reliance on existing data sources' when assessing monetary policy. Whatever, the overall message was that the US labour market probably still is in some kind of equilibrium but that there is no need for the Fed to rush to action due to a further tightening of the labour market. The US yield curve steepened even as changes at the end of the day were very limited. The 2-y yield declined 3.7 bps. The 30-y rose slightly (+1.5 bps). Markets now only discounted less than 20% chance of a Fed rate hike at the end of July meeting. Such a 25 bps step is now only fully priced in by the end of the year. Aside from the payrolls, EMU (but also UK and Japanese bond markets) during the day were also captured in a broad steepening move. German yields yesterday rose between 2.3 bps (2-y) and 4.5 bps (30-y). On FX markets, the weaker payrolls pushed the dollar into the defensive. DXY dropped from 101.4 to 100.86. EUR/USD regained the 1.14 big figure (close 1.1432). Even the yen, which was fighting an uphill battle of late, rebounded from Wednesday's multi-year lows against the dollar. USD/JPY dropped from 162.6 to close near 161.1. Equities got a temporary intraday boost after the report, but especially the Nasdaq struggled to hold these gains. The Dow (+1.14%) closed at an all-time high. The Nasdaq lost 0.8% in an apparent rotation move.
Today US markets are closed (long weekend for Independence Day). In Europe and the UK only some second-tier data are on the agenda. One can expect order-driven, technical trading. Yen traders will be on alert for potential yen interventions by Japanese authorities in an environment of lower market liquidity. We also keep an eye on the dollar as headlines suggest that the issue of Fed independence apparently isn't completely muted yet.
News & Views
The Trump administration and its allies are actively exploring ways to remove members of the Fed board and to replace them with the president's own picks, Bloomberg reported citing people familiar with the matter. That followed the Supreme Court's ruling this week that overruled the attempted sacking of governor Cook over alleged mortgage fraud. The Court said president Trump had failed to provide Cook procedures to properly dispute the allegations against her. The administration now sees the decision as providing a procedural roadmap for how to actually remove Cook from the job. Meanwhile, White House frustration is growing again over former chair Powell to stay on as Board member, going against protocol. While the inquiry into the out-of-budget renovation of the Fed headquarters was dropped in April, the investigation remains prone to be reopened. The administration is also zeroing in on regional Fed members. The search for a new Atlanta Fed president after Bostic stepped down in February was said to be halted until the new Fed chair Warsh, a Trump pick, was sworn in so that he would have a say in the process as well.
For some key European leaders, it seems all but inevitable that ships transiting through the Strait of Hormuz will have to pay fees to Iran and Oman, another Bloomberg exclusive reported. While not reflecting the government's official stance, several Gulf states hold the same view. Both Oman and Iran have said there's no way of going back to the pre-war free-for-all situation. Oman is reportedly looking at the Malacca Strait in Asia as a leading example. This key maritime route is managed by Indonesia, Malaysia and Singapore with these countries charging vessels for any navigation and security services needed.
The Weekly Bottom Line: Celebrating America’s Exceptionalism
Our summary of recent economic events and what to expect in the weeks ahead.
Canadian Highlights
- The July 1st CUSMA extension deadline came and went, but this outcome was well telegraphed and the status quo, in terms of U.S. tariffs on Canada, remains.
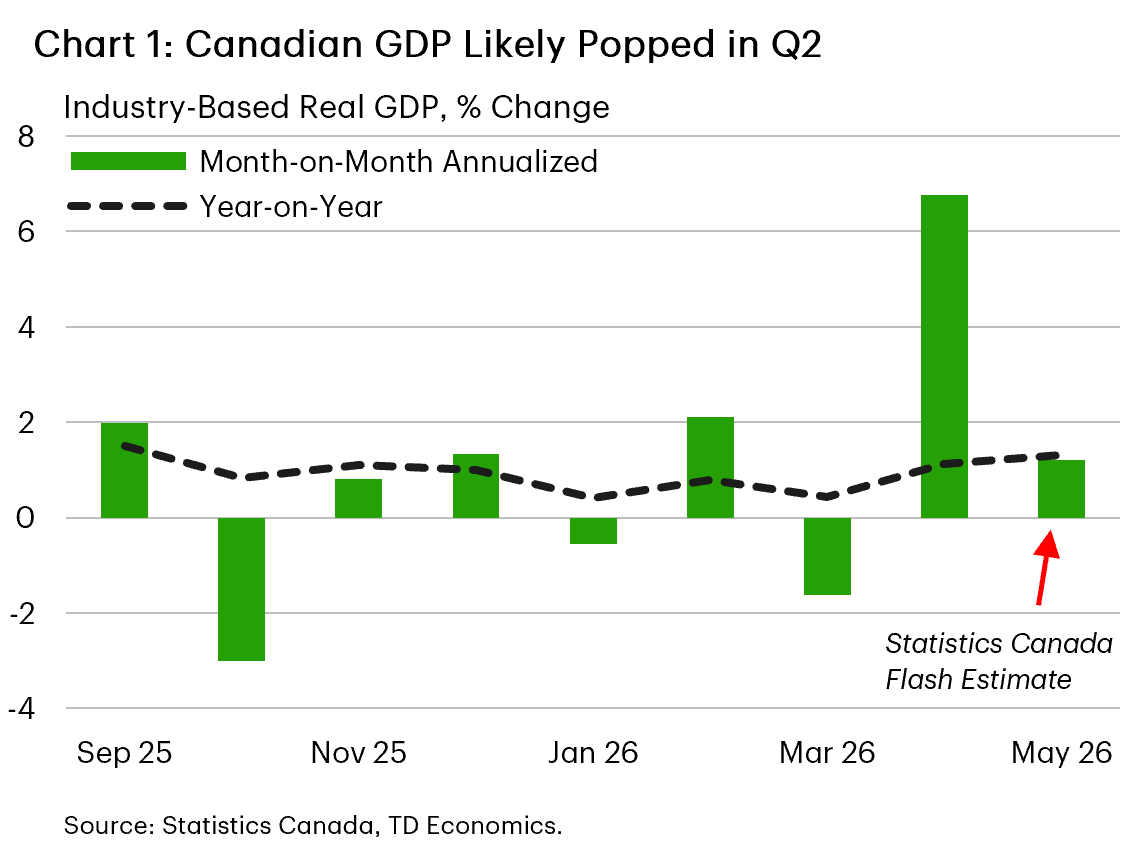
- Canada's economy popped in April and likely grew again in May. This puts Q2 growth on track to print above 2% annualized, easing recession concerns.
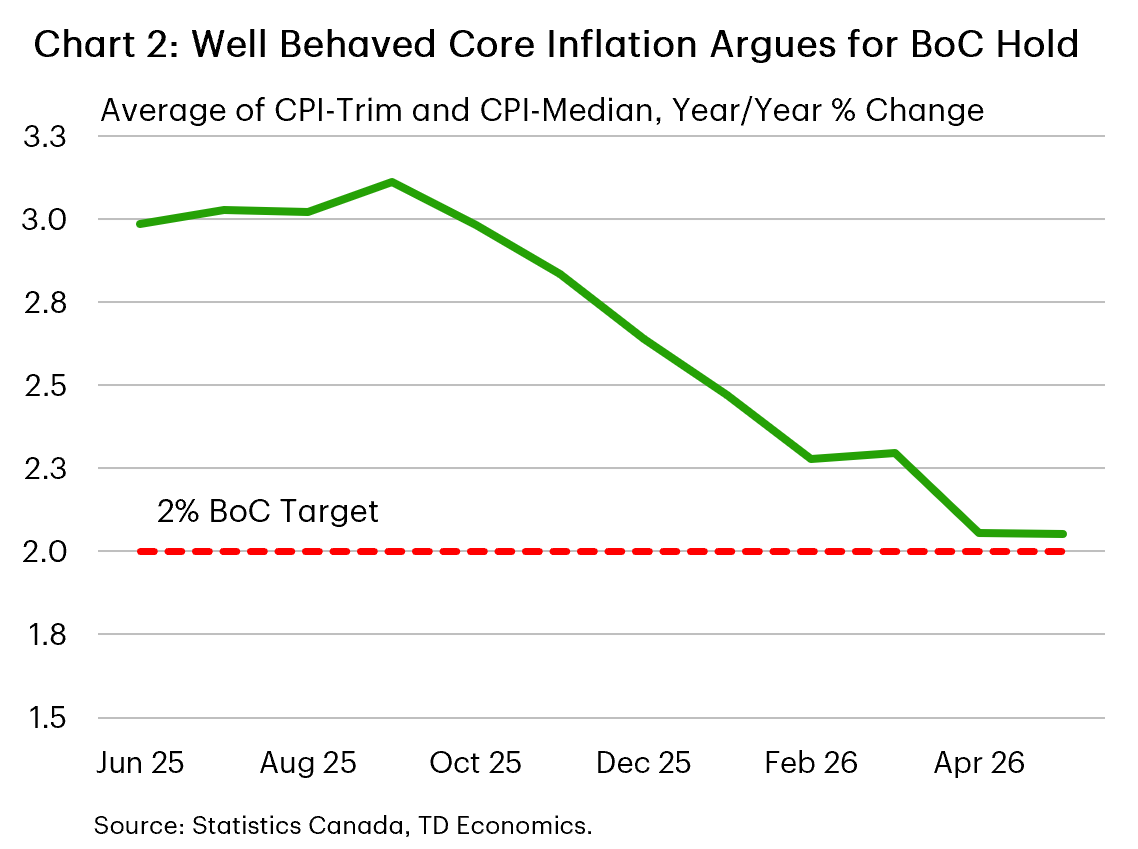
- Lower oil prices should help near-term inflation, while underlying slack and contained core inflation pressures strengthen the case for a Bank of Canada hold stance.
U.S. Highlights
- U.S. equities had a stellar first half performance this year, with the S&P 500 and NASDAQ rising 9.5% and 13%, respectively.
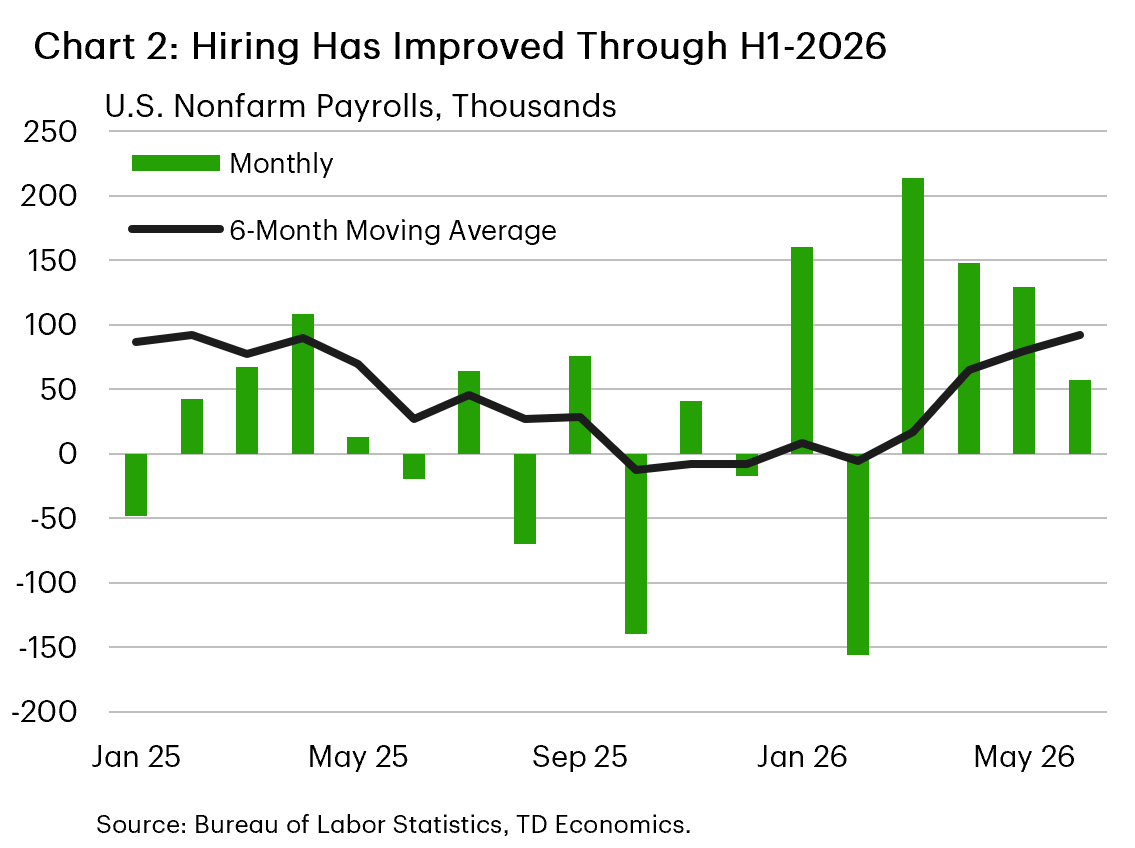
- Nonfarm employment moderated in June, but underlying hiring trends remain reasonably solid. The unemployment rate dipped to a twelve-month low of 4.2%.
- The ISM Manufacturing Index remained in expansionary territory for the sixth month in June, while vehicle sales hit a nine-month high of 16.5 million.
Canada – GDP Fireworks Ahead of Canada Day
In this holiday shortened week, there were still some notable moves in financial markets. Oil slid lower and, more broadly, has plunged since early June on hopes of a U.S.-Iran peace deal and improved traffic through the Strait of Hormuz. Canadian bond yields climbed during the week but eased back a bit today, driven by dynamics in the U.S. For its part, the Canadian dollar was unchanged at about 70 cents U.S. but has been tumbling since early May, pressured by hawkish U.S. central bank messaging.
The recent slide in oil prices is certainly a welcome development from an inflation perspective and will be reflected in June's CPI print. However, there could still be some upside to oil prices after this initial downswing. Global inventory buffers were steadily drawn down during the conflict and the summer driving season is set to ramp up.
Nonetheless, our forecast assumes that oil prices are past their peak. The Bank of Canada will breathe a sigh of relief if that turns out to be true, although policymakers were treated to some fireworks ahead of the Canada Day holiday, courtesy of a well-timed surge in monthly GDP. Indeed, Canadian GDP shook off some winter blues, popping by 0.5% month-on-month in April. This should help quell recession chatter, with April's gain marking the largest such increase since July 2025.
On the less-positive side, the July 1st deadline to extend the CUSMA agreement for another 16 years came and went this week. However, this outcome was telegraphed well ahead of time by Canada, U.S. and Mexico. For now, the status quo remains, with most of Canada's exports to the U.S. tariff-free, but with punishing levies on sectors such as steel, aluminum and autos still in place. The process now moves to annual reviews (which will keep the cloud of uncertainty hanging), although parties can strike a deal at any time. We have tentative evidence that the worst of the trade conflict may be in the rearview. For instance, manufacturing GDP has risen in two of the last three months through April, and may have increased again in May given a pickup in hiring.
Incorporating StatCan's GDP guidance for May, Canada's economy is now on track to grow at a pace above 2% annualized in the second quarter. This is stronger than what the Bank of Canada expected in its April projection. Even still, it doesn't materially change our view on rates. Remember that the bounce back in GDP comes on the heels of several quarters of soft activity, meaning that the economy is still likely in excess supply. Core inflation remains well behaved, with economic slack likely to apply downward pressure. Next week brings a slew of important data, including the Bank of Canada's Business Outlook Survey (BOS) and the June read on the job market. The prior BOS offered evidence that businesses are adjusting to the trade war, while Canadian hiring surged in May (raising the risk of some giveback in next week's report). We'll be monitoring these closely, but it would take some surprises to shake us from the view the Bank will remain on hold this year.
Rishi Sondhi, Economist
U.S. – Celebrating America's Exceptionalism
This weekend will mark America's 250th anniversary, but for financial markets, this holiday shortened week also brought a brief halftime for calendar 2026. It's been an eventful first six months of the year, marked by a flurry of trade deals, further shifts in tariff policies, a new chapter for the Federal Reserve and plenty of geopolitical tensions. Through it all, financial markets have remained remarkably calm. The S&P 500 rose 9.5% through the first half of the year while the NASDAQ was up nearly 13% – or more than double last year's mid-year performance. It remains to be seen whether the run is something to cheer or fear, but one thing is for certain, the AI buildup and the expected productivity enhancements that it could eventually deliver have been pivotal catalysts underpinning the bull rally.
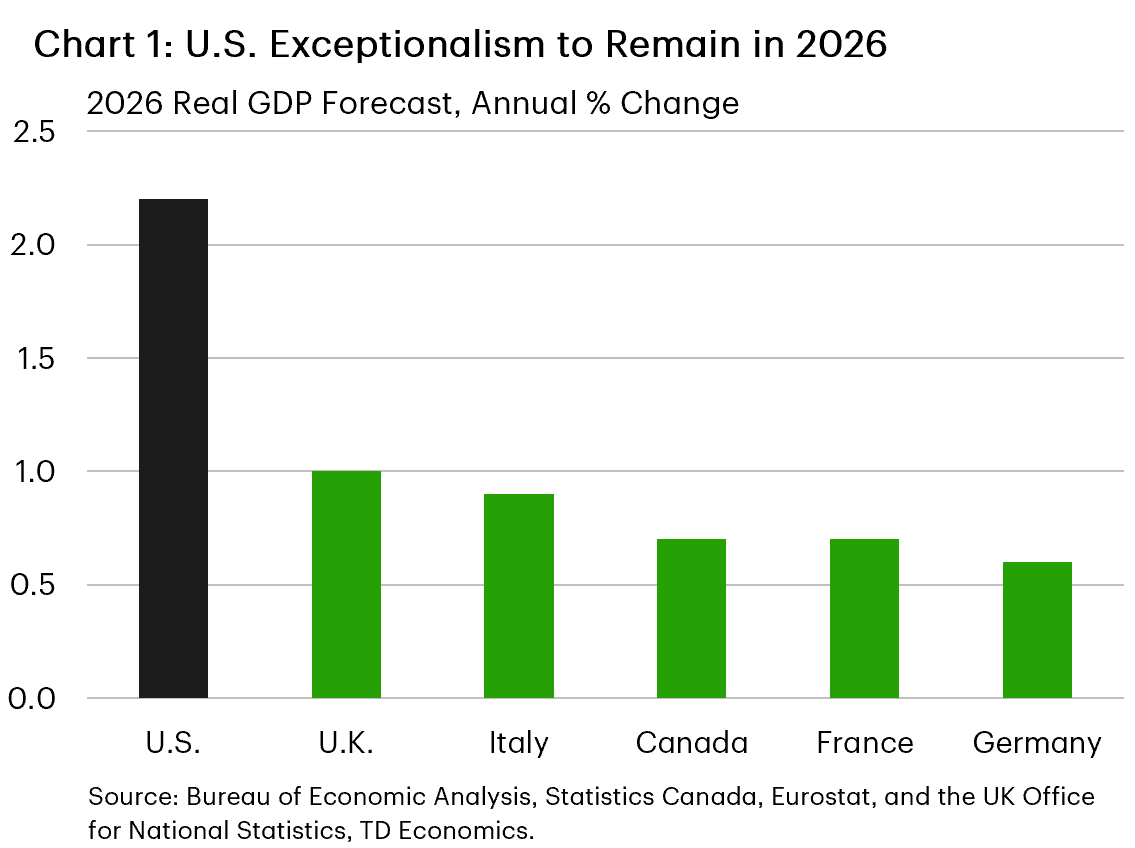
Beyond the AI push, a return to the American exceptionalism trade has also offered a tailwind for equities. U.S. growth is tracking north of 2% for 2026, or a multiple of any of the other G7 nations. And perhaps more encouragingly, the balance of risks for the U.S. outlook feels tilted to the upside. The U.S.-Iran peace deal has quickly returned energy prices to pre-conflict levels, dragging gas prices lower. This is good news for the consumer. At the same time, the labor market has clearly turned a corner after grinding through a soft patch last year. Nonfarm payrolls rose by 57k in June, a moderation from prior months, but a decent print nonetheless. Smoothing through the volatility, hiring has averaged 111k and 92k over the last three and six months, respectively. This is well above the breakeven rate, which helped to push the unemployment rate to a twelve-month low of 4.2%. But it wasn't all good news, a sharp drop in the labor force was entirely driven by a decline of over 800k prime working age individuals (i.e., 25 to 54 years old). It's too early to know what drove the decline or whether it's simply related to volatility. But the magnitude is noteworthy and something worth monitoring in the months ahead.
Other data out this week also reinforced America's economic resilience. June vehicle sales rose to a nine-month high of 16.5M, while the ISM Manufacturing Index remained in expansionary territory for the sixth consecutive month. Importantly, both production and new orders continue to expand at decent clips. And while input prices remain elevated, the sub-index fell to a four-month low, suggesting the worst of the cost pressures stemming from the energy shock are now in the rearview mirror.
This is good news for Fed officials, who are hunting for any signs of slowing price pressures amid continued concerns of elevated inflation. In his first public appearance since the June press conference, Chair Warsh underscored the Fed's commitment to return price stability, but stopped short of giving any forward guidance. While this leaves the impression that every meeting is "live" we would argue that the data released since the last FOMC meeting alongside the sharp pullback in energy prices reduces the odds of the Fed hiking rates this summer.