
Sample Category Title
USD/CAD Daily Outlook
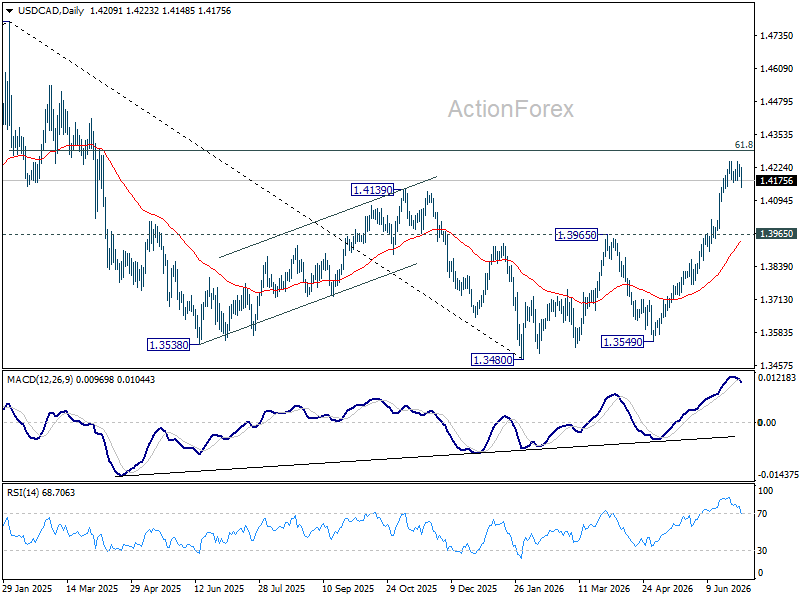
USD/CAD dips again as consolidation from 1.4247 extends. Intraday bias remains neutral. Deeper pullback, but downside should be contained above 1.3965 resistance turned support. Above 1.4247 will resume the rally from 1.3480 to 61.8% retracement of 1.4791 to 1.3480 at 1.4290. Firm break there will pave the way back to 1.4791 high.
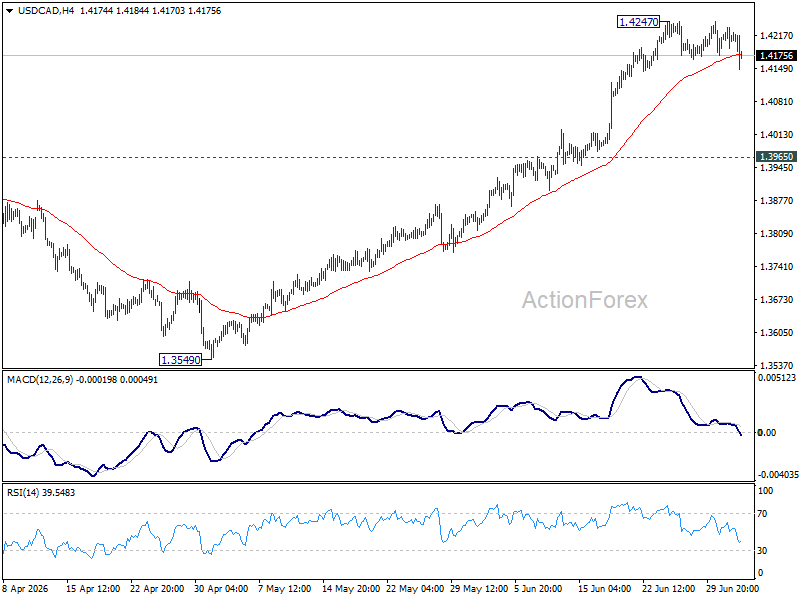
In the bigger picture, current development suggests that fall from 1.4791 has completed as a three wave correction to 1.3480. It's still early to judge if rise from there a corrective bounce, or resumption of the larger up trend from 1.2005 (2021 low). But in either case, retest of 1.4791 high should be seen next.
Fed Hike Bets Retreat After Payrolls Miss, Yen Supported by Tokyo’s New Playbook
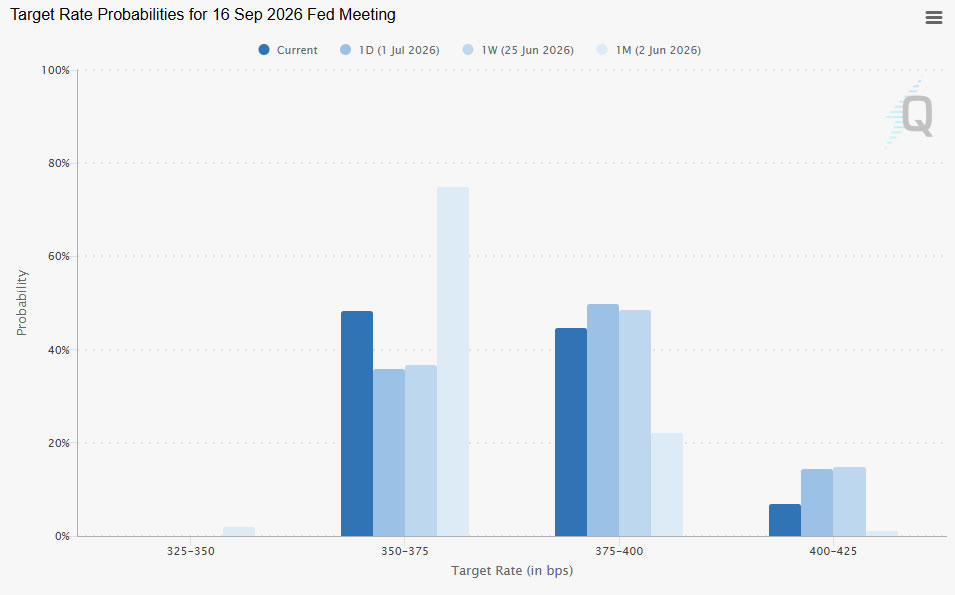
The June non farm payrolls report did not prove the US economy is breaking. It did something more important for markets: it showed the labor market is not hot enough to force the Fed’s hand. Non-Farm Payrolls rose just 57k, far below expectations of 114k, while May was revised down from 172k to 129k. That was enough to push Dollar sharply lower and reduce the market-implied chance of a September hike from about 65% to 52%.
The details were mixed, but the policy message was clear. Unemployment slipped from 4.3% to 4.2%, while wage growth stayed robust at 0.3% mom and rose from 3.4% to 3.5% yoy. Those figures prevent the report from being a clean dovish signal. Still, weak headline hiring gives the Fed more room to wait, especially with oil prices now far below their Q2 highs. If lower energy prices pull inflation down naturally, Chair Kevin Warsh’s Fed may decide that the current 3.50-3.75% policy rate is already restrictive enough.
Yen’s rally added a second major theme to the session. There is no official confirmation of Japanese intervention, but the reported shift toward surprise “ambush” tactics appears to have done what verbal warnings could not: it made traders afraid of holding crowded short-yen positions. The timing was especially effective, coming just before NFP and creating a buffer for Yen before the data. With payrolls then disappointing, Japan may have needed no actual intervention at all.
Currency performance now reflects two different repricings. Dollar has become the week’s weakest major currency as Fed tightening pressure fades, followed by Loonie and Aussie. Sterling leads, followed by Kiwi and Swiss Franc, helped by resilient risk sentiment and relatively firmer domestic policy expectations. Euro and Yen sit in the middle, but for different reasons: Euro is still weighed by softer ECB expectations, while Yen has been support
US NFP Miss Sharply With 57k Growth, Participation Falls and Wage Growth Holds Firm
US employment growth disappointed in June after payrolls rose only 57k, while falling labor force participation helped push the unemployment rate lower. Read More.
USD/JPY's 150 Pips Fall: A Tactical "Intervention" Masterclass by Japan Ahead of NFP
Japan may not have intervened, but it may have achieved the same effect. We explain how strategic uncertainty triggered a 150-pip USD/JPY slide and changed the risk calculus for yen bears ahead of NFP. Read More.
EUR/GBP Accelerates Through Key Support as ECB/BoE Yield Convergence Trade Reverses
EUR/GBP isn't just reacting to softer Eurozone inflation. It's unwinding one of this year's biggest FX trades. We explain why the reversal of ECB/BoE yield convergence could keep the cross under pressure. Read More.
Swiss CPI Slows to 0.6% as Imported Price Pressures Fade Further
Swiss inflation remained subdued in June as CPI held at 0.5% year-over-year and imported price pressures eased sharply, reinforcing Switzerland's low-inflation environment. Read More.
Australia Posts Biggest Trade Deficit Since 2015 as Gold, Iron Ore Exports Slump
Australia posted its largest trade deficit since 2015 in May as exports of gold and iron ore plunged, overwhelming modest import growth and surprising markets. Read More.
USD/JPY Daily Outlook
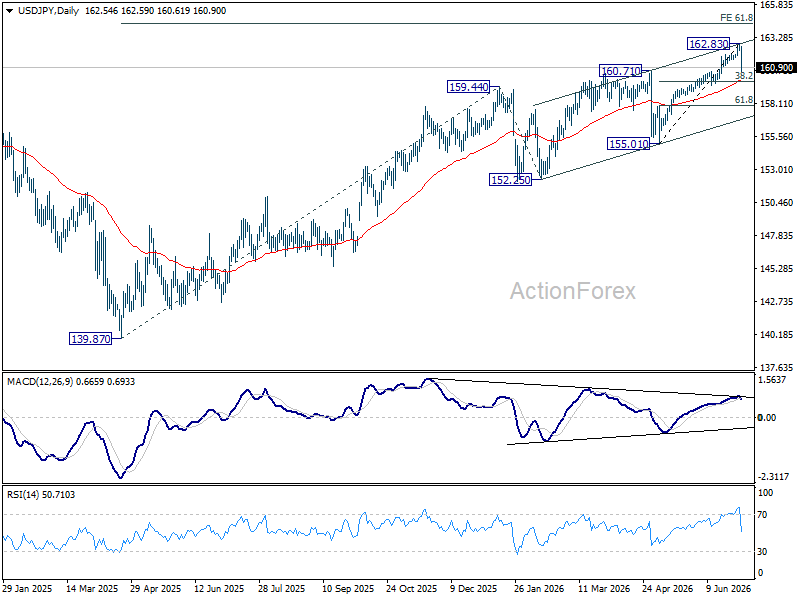
USD/JPY's steep decline and strong break of 161.51 support confirms short term topping at 162.83, on bearish divergence condition in 4H MACD. Intraday bias is back on the downside for 38.2% retracement of 155.01 to 162.83 at 159.84. Since this level is close to 55 D EMA (now at 159.95), strong support should be seen from there to bring rebound. But overall, consolidations should continue below 162.83 for a while.
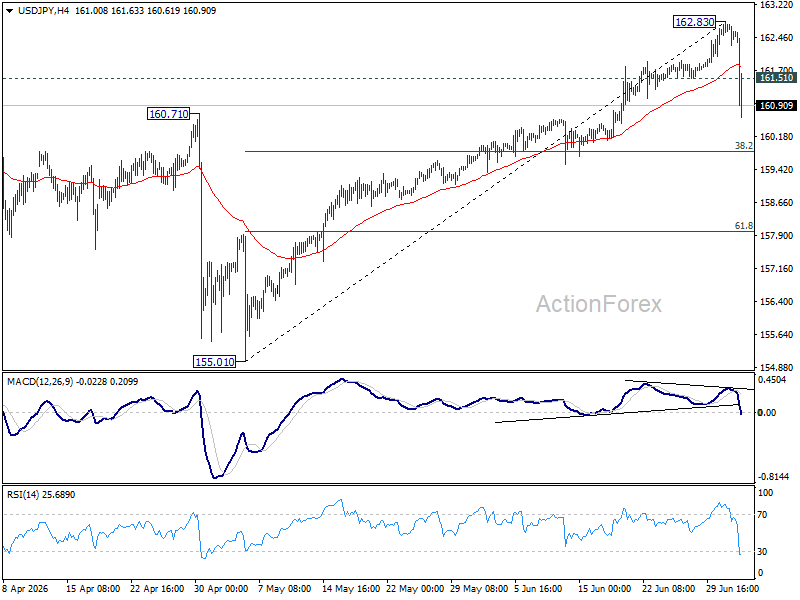
In the bigger picture, rise from 139.87 (2025 low) is seen as another rising leg of the long term up trend. Next target is 61.8% projection of 139.87 to 159.44 from 152.25 at 164.34. For now, outlook will remain bullish as long as 155.01 support holds, even in case of deep pullback.
USD/JPY Daily Outlook
USD/JPY's steep decline and strong break of 161.51 support confirms short term topping at 162.83, on bearish divergence condition in 4H MACD. Intraday bias is back on the downside for 38.2% retracement of 155.01 to 162.83 at 159.84. Since this level is close to 55 D EMA (now at 159.95), strong support should be seen from there to bring rebound. But overall, consolidations should continue below 162.83 for a while.
In the bigger picture, rise from 139.87 (2025 low) is seen as another rising leg of the long term up trend. Next target is 61.8% projection of 139.87 to 159.44 from 152.25 at 164.34. For now, outlook will remain bullish as long as 155.01 support holds, even in case of deep pullback.
US NFP Miss Sharply With 57k Growth, Participation Falls and Wage Growth Holds Firm
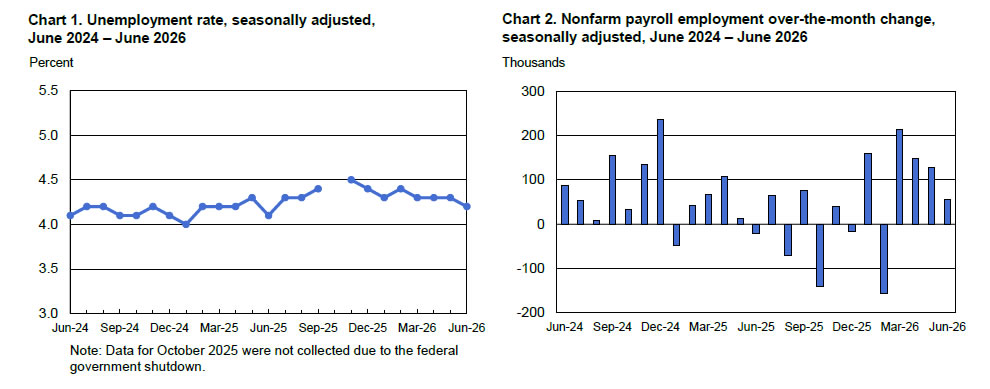
US job growth slowed much more than expected in June, with Non-Farm Payrolls rising just 57k, well below the consensus forecast of 114k. The previous month's gain was also revised sharply lower to 129k from the initially reported 172k, reinforcing signs that labor market momentum has cooled heading into the second half of the year.
Despite the weak headline, the unemployment rate unexpectedly edged down to 4.2% from 4.3%. However, the improvement was largely explained by a decline in labor force participation, which fell 0.3 percentage points to 61.5%, suggesting fewer people were actively seeking work rather than stronger hiring. Meanwhile, average hourly earnings rose 0.3% mom for a second consecutive month, lifting annual wage growth to 3.5% yoy from 3.4% yoy and indicating that wage pressures remain resilient despite softer employment gains.
The report presents a mixed picture for the Federal Reserve. Hiring has clearly lost momentum, but persistent wage growth and a lower unemployment rate do not point to a labor market that is deteriorating rapidly. Markets are therefore likely to view the data as reducing the urgency for another rate hike without completely eliminating the possibility. Attention will now turn to whether subsequent labor market and inflation data confirm that the recent slowdown reflects a broader moderation in economic activity rather than a temporary soft patch.
| Indicator | Previous | Latest | Consensus |
|---|---|---|---|
| Non-Farm Payrolls | 129k | 57k | 114k |
| Average Monthly Job Growth (Past 12 Months) |
— | 36k | — |
| Unemployment Rate | 4.3% | 4.2% | 4.3% |
| Labor Force Participation Rate | 61.8% | 61.5% | — |
| Average Hourly Earnings (MoM) | 0.3% | 0.3% | 0.3% |
| Average Hourly Earnings (YoY) | 3.4% | 3.5% | 3.5% |
GBP/JPY Daily Outlook
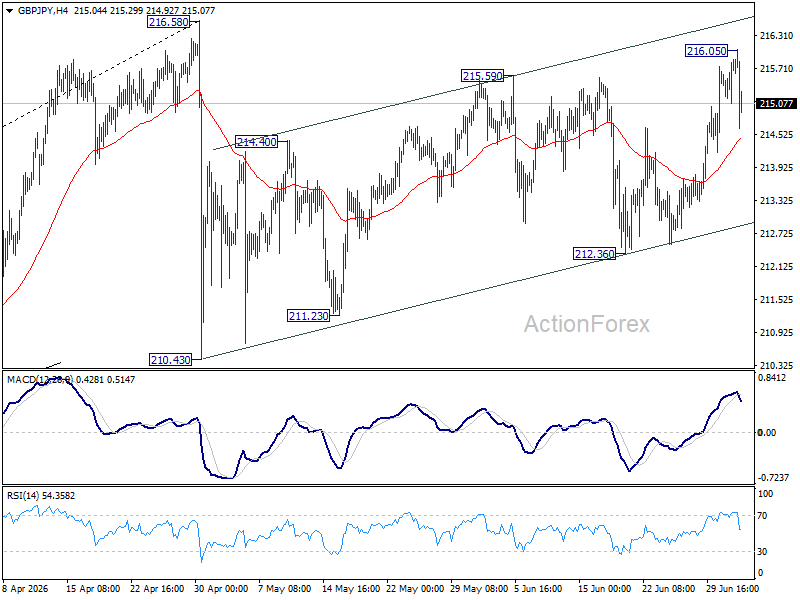
Intraday bias in GBP/JPY is turned neutral with current retreat. On the upside, above 216.05 will extend the rebound from 210.43 to retest 216.58 high. For now, risk will stay on the upside as long as 212.36 support holds, in case of retreat.
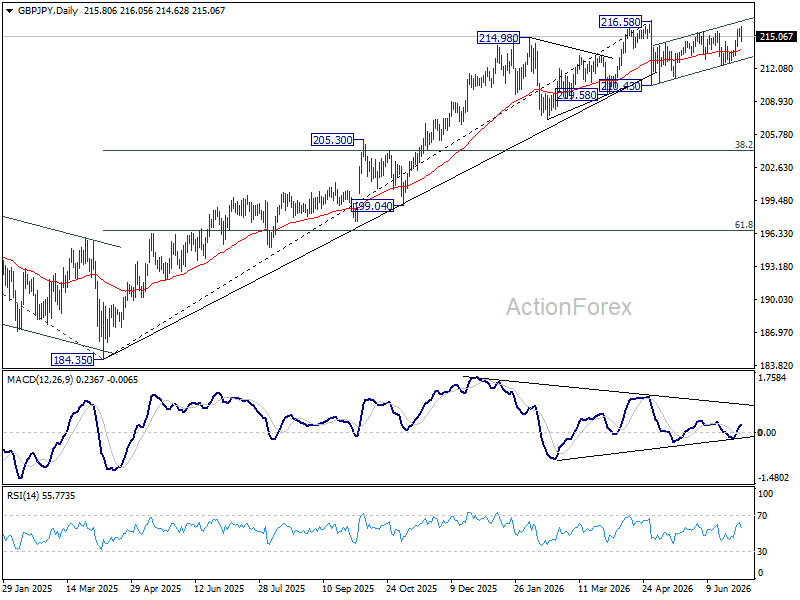
In the bigger picture, there is no clear sign of trend reversal yet. The long term up trend could still extend to 61.8% projection of 148.93 (2022 low) to 208.09 (2024 high) from 184.35 at 220.90 on resumption. However, sustained break of 55 W EMA (now at 207.52) will argue that it's already in medium term down trend for 184.35 support.
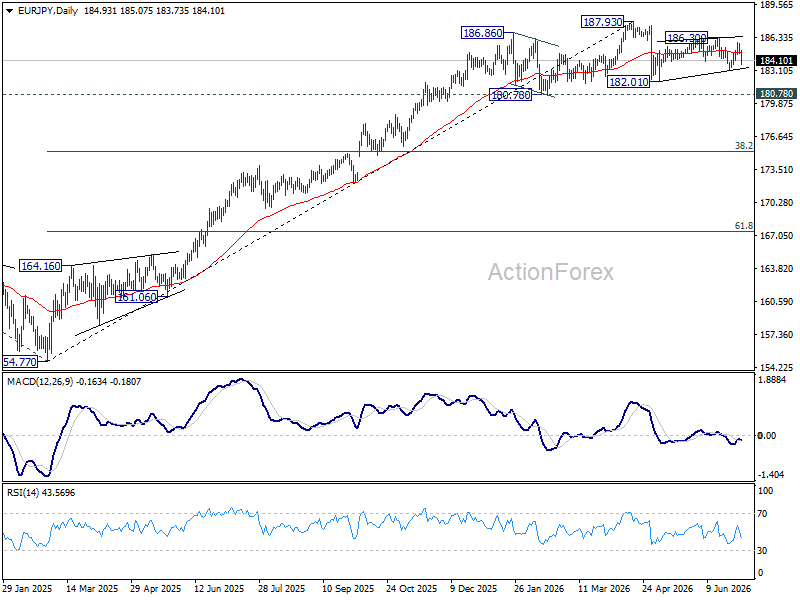
EUR/JPY Daily Outlook
Range trading continues in EUR/JPY and intraday bias remains neutral. Risk will remain mildly on the downside as long as 186.30 resistance holds. Below 183.14 will bring retest of 182.01 support first. However, firm break of 186.30 will resume the rebound from 182.01 to retest 187.93 high.
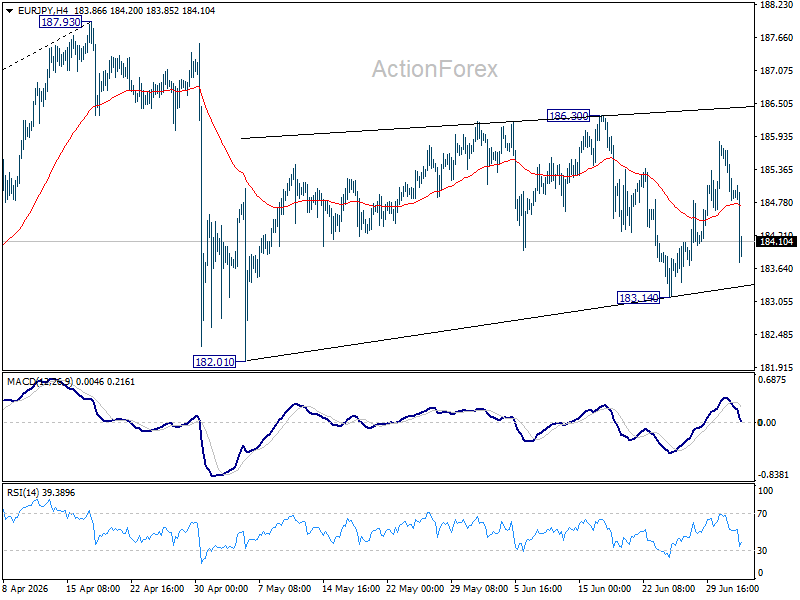
In the bigger picture, there is no sign of reversal yet. Uptrend from 114.42 (2020 low) is still expected to resume at a later stage to 78.6% projection of 124.37 (2022 low) to 175.41 (2025 high) from 154.77 at 194.88. However, sustained break of 55 W EMA (now at 179.37) will argue that it's already in a medium term down trend to 175.41 resistance turned support and below.
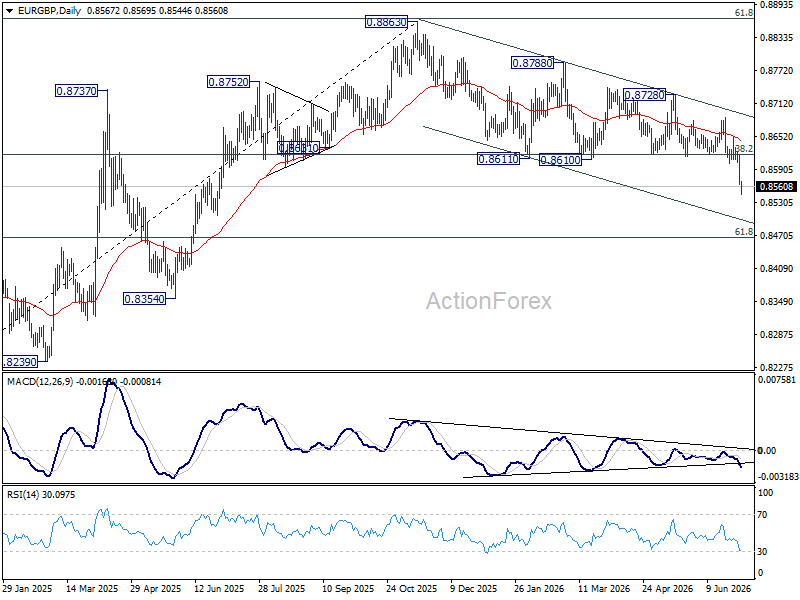
EUR/GBP Daily Outlook
EUR/GBP's downside acceleration and strong break of 38.2% retracement of 0.8221 to 0.8863 at 0.8618 should confirm that rise form 0.8221 has completed at 0.8863. Intraday bias stays on the downside for 61.8% retracement at 0.8466 at next. On the upside, above 0.8601 minor resistance will turn bias neutral first. But risk will stay on the downside as long as 0.8686 resistance holds, in case of recovery.
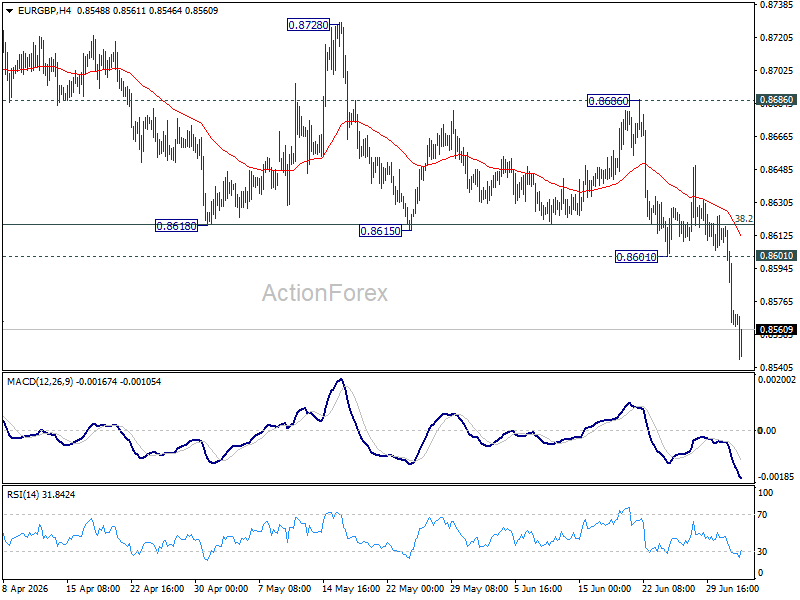
In the bigger picture, current development suggests that rise from 0.8221 (2024 low) has completed at 0.8863, just ahead of 38.2% retracement of 0.8221 (2024 low) to 0.8863 (2025 high) at 0.8618. Deeper fall would be seen back to 0.8201 (2022 low). For now, outlook will be neutral at beast as long as 0.8863 hold.
EUR/AUD Daily Outlook
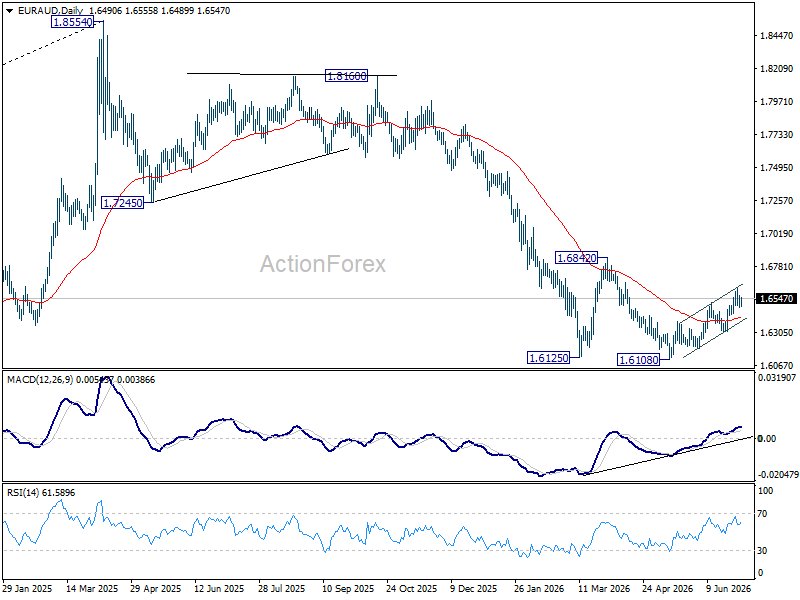
EUR/AUD is staying in consolidations below 1.6617 and intraday bias remains neutral at this point. Further rally remains in favor as long as 1.6306 support holds. Break of 1.6617 will resume the rally from 1.6108 towards 1.6842 resistance.
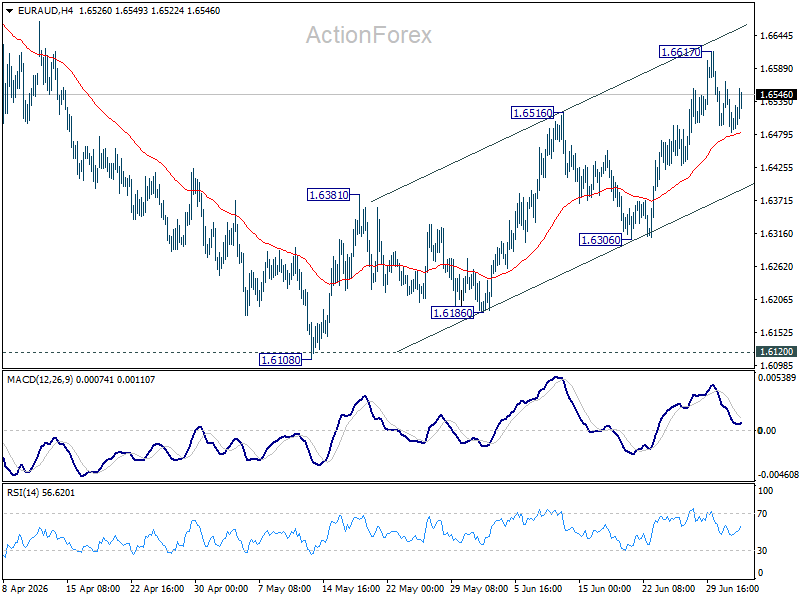
In the bigger picture, outlook will stay bearish as long as 1.6842 resistance holds. Fall from 1.8554 (2025 high) is expected to continue to 61.8% retracement of 1.4281 to 1.8554 at 1.5913. Decisive break there will pave the way back to 1.4281 (2022 low). However, firm break of 1.6842 should confirm medium term bottoming, and bring stronger rally.
EUR/CHF Daily Outlook
EUR/CHF's correction from 0.9265 extended lower today, but it stays above 0.9179 support. Intraday bias remains neutral first, and further rally is in still in favor. Above 0.9234 will bring stronger rebound to 0.9265. Firm break there will resume the rally from 0.8979 to 100% projection of 0.8979 to 0.9264 from 0.9094 at 0.9379. However, decisive break of 0.9179 will dampen this bullish view and bring deeper fall back to 0.9094 support instead.
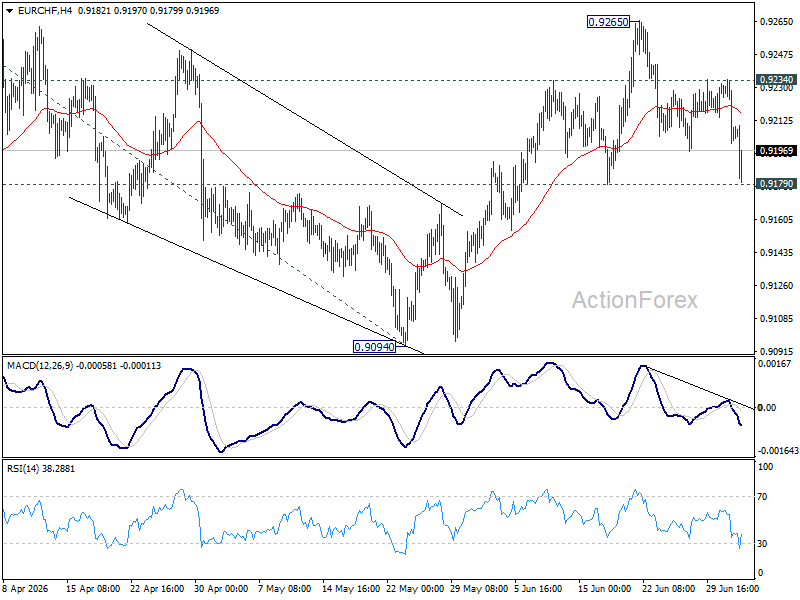
In the bigger picture, the break of medium term falling trend line resistance indicates that 0.8979 is already a medium term bottom. Considering bullish convergence condition in W MACD, rise from there should at least be reversing the fall from 0.9928, with prospect of developing into a medium term up trend. Firm break of 0.9394 resistance will add more credence to this case. For now risk will remain on the upside as long as 0.9094 support holds, in case of retreat.
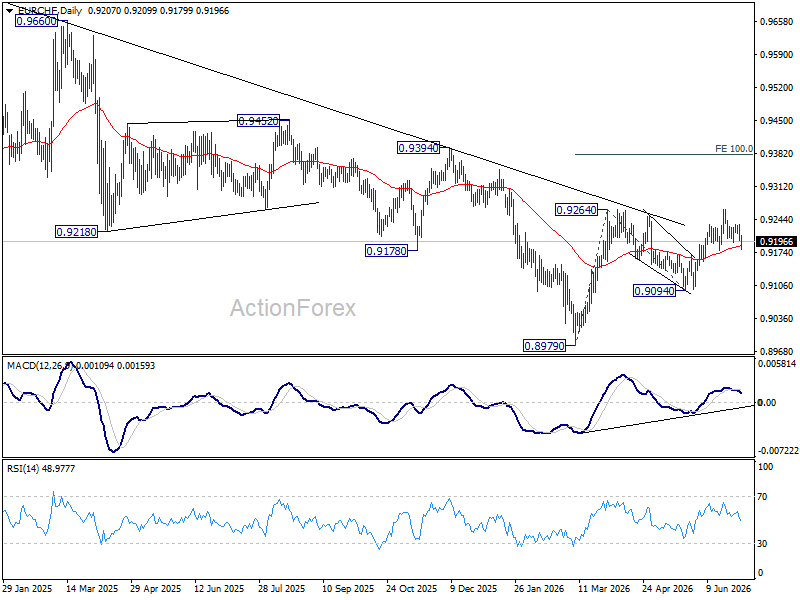
Chart Alert: USD/JPY Plummeted 0.5% on Suspected Deliberate Intervention, Key Levels to Watch Ahead of NFP
Key takeaways
- USD/JPY's sharp intraday reversal bears the hallmarks of official intervention. The sudden 0.5% decline during the Asian-London session, coupled with reports that Japanese authorities may be shifting toward less predictable intervention tactics, suggests policymakers are attempting to curb speculative yen selling without fundamentally altering the prevailing uptrend.
- Interest-rate differentials continue to favour a stronger US dollar. The widening 2-year US Treasury-JGB yield spread and expectations for a resilient US labour market remain supportive of USD/JPY. A stronger-than-expected US non-farm payrolls report could reinforce expectations of further Federal Reserve tightening and renew upward pressure on the pair.
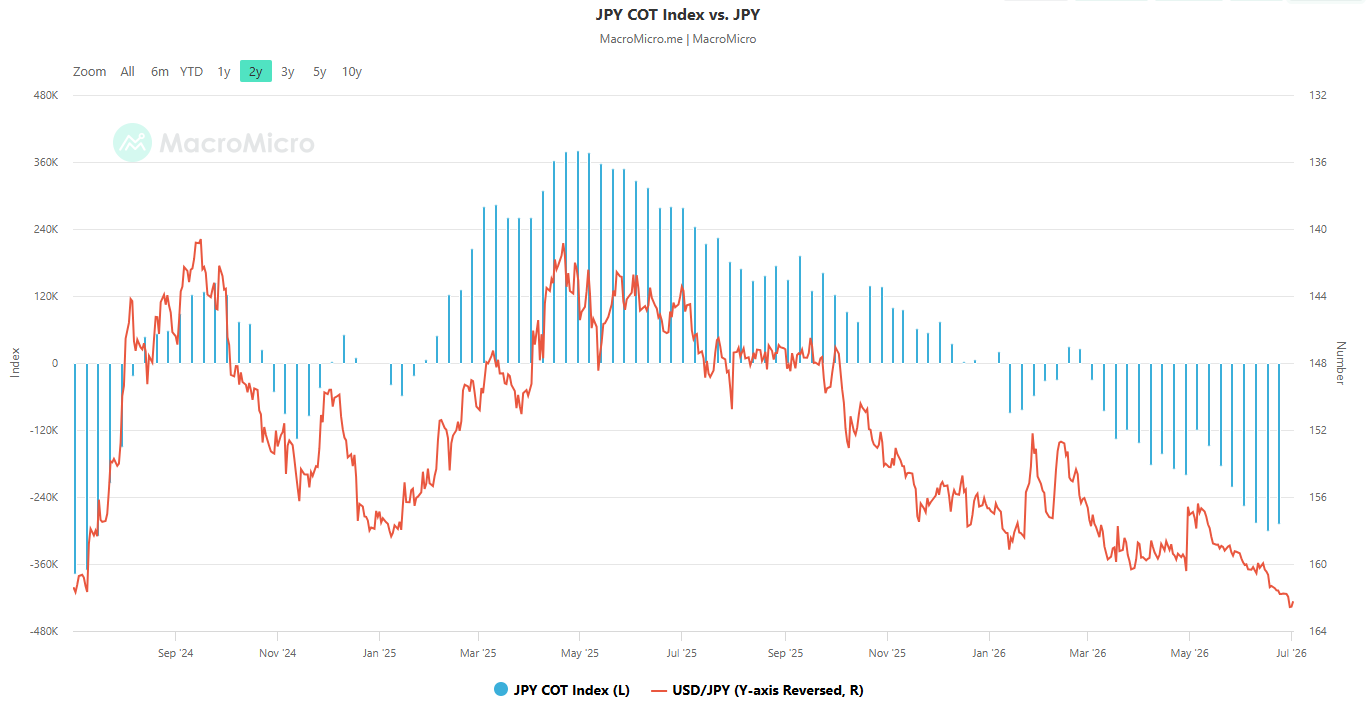
- Crowded speculative positioning raises the risk of sharp squeezes. Net short positions in Japanese yen futures remain near two-year highs, increasing the likelihood that targeted intervention or even the threat of intervention could trigger rapid short-covering rallies without necessarily reversing the broader trend.
- The 160.90 level is the key technical line in the sand. Holding above this support keeps the medium-term bullish outlook for USD/JPY intact, while a decisive break below it would signal that intervention has evolved from a temporary squeeze into a deeper corrective phase.
Out of the blue, the Japanese yen recovered sharply by 0.5% against the US dollar on Thursday, 2 July 2029, at 2 pm SG time (the Asian-to-London handover period).
The USD/JPY staged a steep intraday decline of 0.5% to trade at 161.70 at the time of writing, back below the prior 161.95 (former major resistance from early July 2024 swing highs and prior BoJ intervention).
This type of swift movement smells like FX intervention. So far, there are no official announcements from Japanese authorities, except for a report from Reuters that stated that “Japanese officials are abandoning their habit of telegraphing intervention risks, instead signalling a more targeted campaign to squeeze speculators and raise the cost of betting against the battered yen,” according to sources.
Could it be a deliberate attempt to smooth speculative activities ahead of NFP?
Fig. 1: 2-YR US Treasuries/JGBs yield spread with USD/JPY as of 2 Jul 2026 (Source: TradingView). The information presented is historical information, and past performance is not indicative of future performance.
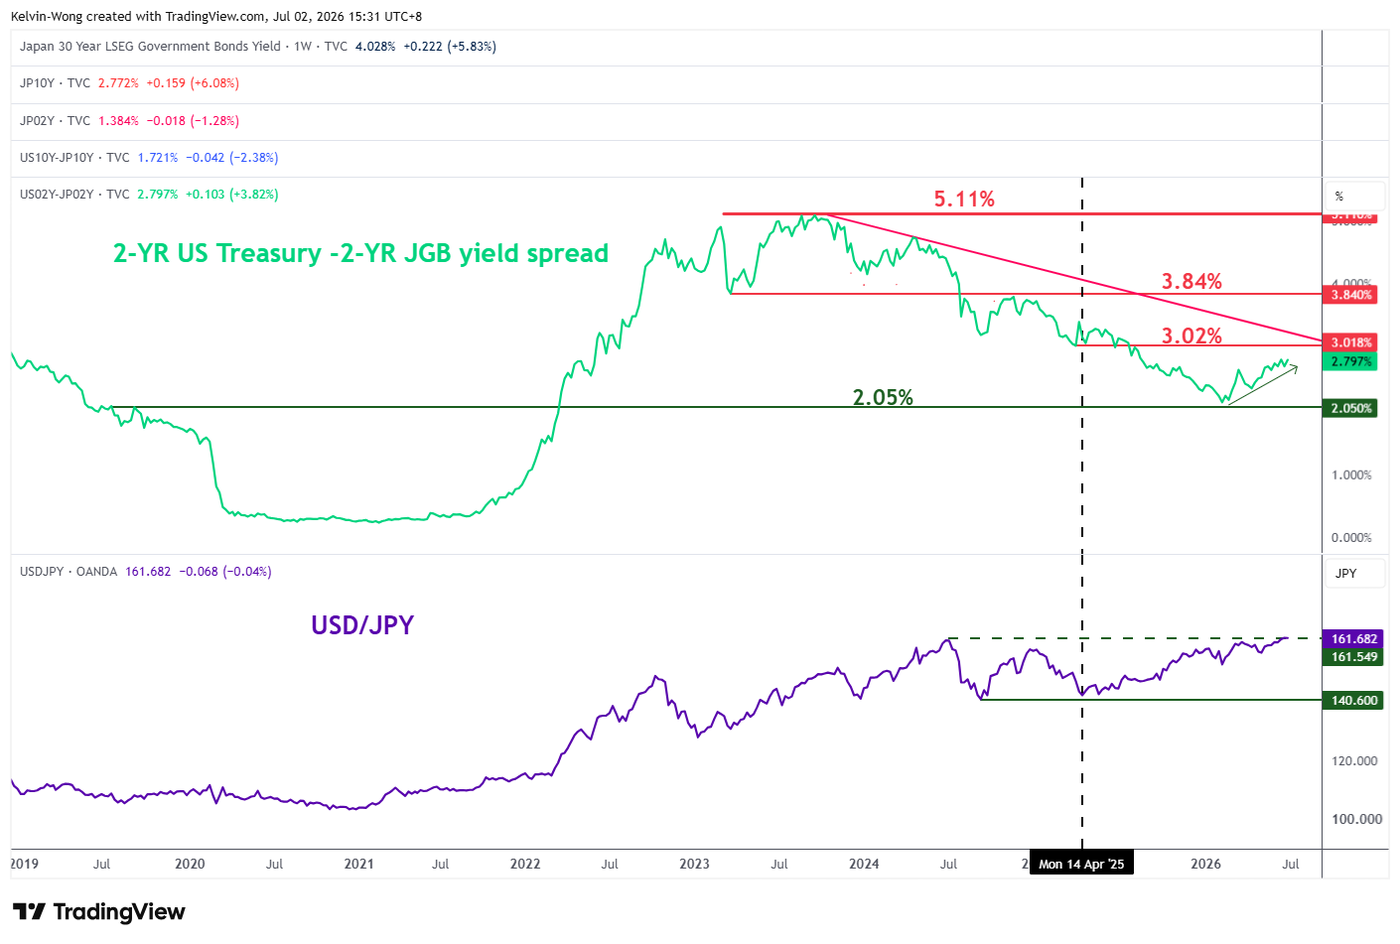
Fig. 2: Commitment of Traders’ net short positions of JPY futures as of 23 June 2026 (Source: MacroMicro). The information presented is historical information, and past performance is not indicative of future performance.
So far, fundamentals have been supportive of a weaker Japanese yen, in line with softer oil prices, where benchmark crude oil, Brent and WTI have fallen to below $75 per barrel, keeping a lid on the Japanese inflation trend, in turn, reducing the hawkish rhetoric from the Bank of Japan (BoJ).
All these factors allow the monetary policy sensitive 2-year yield spread between the US Treasury Notes and the Japanese Government Bonds (JGBs) to widen further, as the yield premium is now inching higher to 2.79% at this time of writing, making short-term US fixed income more attractive than Japanese ones, in turn, putting upside pressure on the USD/JPY (see Fig. 1).
Hence, a red-hot US non-farm payrolls data for June (above consensus of 110k, and 172K in May) later is likely to increase a more hawkish pricing of the US Federal Reserve’s future monetary policy, pushing up the 2-year US Treasury and JGB yield spread higher above 2.79%, in turn, triggering more speculators to take on short positions on the Japanese yen.
A swift weakening of the Japanese yen may create some “undesirable fundamental” impact on the Japanese economy, such as softening domestic spending and consumer confidence, offsetting the marginal benefits gained from Japanese automobile exporters.
Also, large speculator net short Japanese yen positions in the FX futures market have reached a 2-year high, making a “deliberate intervention” more effective as the exit door is narrowing due to overcrowded short positions on the yen.
According to the latest data from the Commitment of Traders report as of 23 June 2026, the net short portion of JPY futures (large speculators less large commercials) has remained steady at -288,485 contracts, more than the 02 June 2026 print of -257,335 (see Fig 2.)
Hence, the Japanese authorities may use the Reuters news report to reduce speculative positions but not alter the major uptrend phase of USD/JPY (i.e., the Japanese yen’s major downtrend).
Watch the 160.90 support on the USD/JPY
Fig. 3: USD/JPY minor trend as of 2 Jul 2026 (Source: TradingView). The information presented is historical information, and past performance is not indicative of future performance.
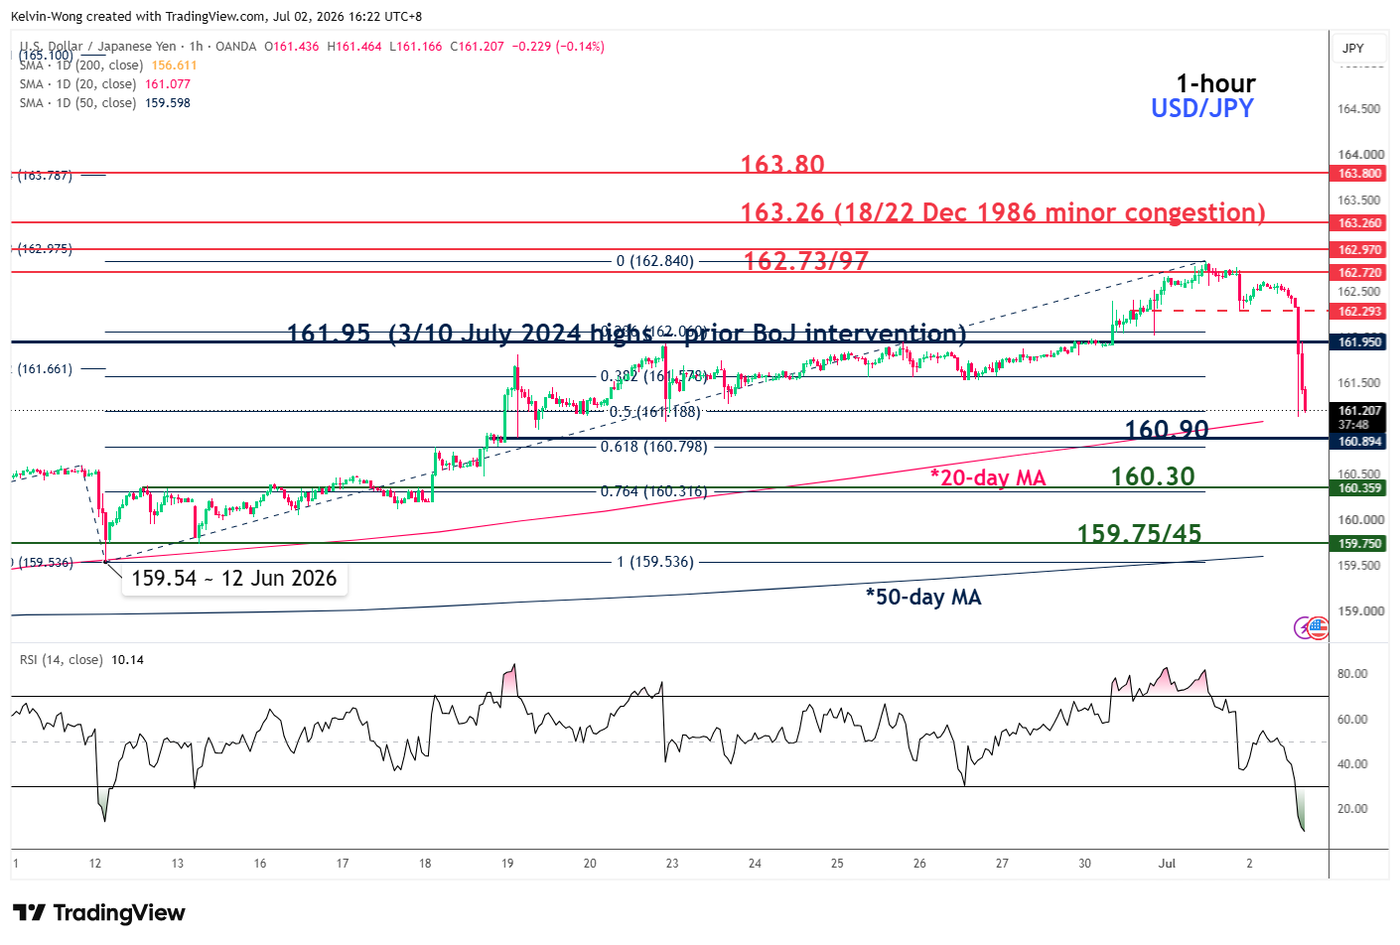
The latest bout of selling in USD/JPY (-0.7% intraday) remains above 160.90 key intermediate support (also the 20-day moving average, above it since 15 May 2026).
Only a break and an hourly close below 160.90 may trigger an intraday minor decline towards the next intermediate support at 160.30 and even a test on the 159.75/45 key medium-term support zone (also the 50-day moving average) (see Fig. 3).
On the flip side, a clearance and an hourly close above 161.95 reinstate the bullish tone on USD/JPY, targeting a retest of 162.73/97 before an assault on the next intermediate resistance at 163.26.