Sample Category Title
Sunset Market Commentary
Markets
More quotes from ECB governors at the sidelines of the Sintra symposium hit the wires. Germany's Buba president Nagel keeps his options open for July and September, citing above-target inflation through 2027 and the risk that it may trigger second-round effects. He's not seeing them currently but it is too early to write it off. ECB Wunsch said he would need to see such second-round effects to tighten monetary policy further. If not, the June hike could suffice. Austria's Kocher said "The inflation threat hasn't been completely contained yet, but it has definitely diminished, at least in the short term." The all in all balanced quotes from the hawks triggered a temporary downleg in European yields. Sub-par inflation numbers, while not a surprise after Germany's, France's and Italy's miss yesterday, reinforced the move. Headline CPI came in at 2.8%, easing from May's 3.2% on a continued energy price drop (-1.7% m/m) and missing the 3% consensus view. Core CPI decelerated more than expected, from 2.6% to 2.5%. Services inflation fell from 3.5% to 3.2% and non-energy industrial goods inflation printed 0.9%, the same as in May. German front-end yields eventually trade 1.5-4.7 bps higher on the day going into the Sintra panel discussion. US rates add 1.6-3 bps across the curve. The ADP job report (98k) fell short of the 120k employment growth expected but barely left a trace on markets with the more important payrolls on tap tomorrow. UK gilts underperform, pushing rates 3.3-6.3 bps higher in a bear steepener. The US dollar gained against its most important peers. EUR/USD is struggling around 1.14. USD/JPY edges further north to 162.7. DXY moves higher towards the 101.5 area. EUR/GBP briefly fell through the 0.86 area.
The panel discussion between the heads of the ECB, Fed, BoE and BoC marks the end of the ECB symposium. Focus in particular went to Warsh but, as expected, he immediately deflected a question on a potential rate hike in July. He sided with Lagarde's criticism towards forward guidance in the current more uncertain world, so he refused to give any in an echo to his debut as Fed chair in June. His comments generally held little value as a result. That appeared to disappoint some. US yields swapped gains for losses and the dollar pared its earlier advance. Governor Bailey doubled down on the dovish side, reiterating that the economy is softening and is encouraged by the recent fall in energy prices. His comments weighed more on UK yields than on GBP. ECB's Lagarde defended the June rate hike but refrained from offering hints going forward. She did say that risks to inflation and growth became a bit more balanced. It was perhaps the only noteworthy comment. Money markets are no longer fully pricing in another hike this year. Front-end European yields wipe out their previous gains.
News & Views
The Czech manufacturing PMI showed output growth accelerating as new orders rose at a faster pace in June. The PMI hit a cycle high at 53.9, up from 52.2 (vs 52.0 consensus). Pre-production inventories were built at a faster rate despite a continued decline in vendor performance. Supplier delays also spurred a steeper rise in backlogs of work. At the same time, inflationary pressures eased from their recent highs though remain well above series averages. Following five successive monthly contractions, and a solid drop in headcounts in May, June data signalled a broad stabilisation in staffing numbers at Czech manufacturers. Finally, businesses remained optimistic for the coming year. Hopes were pinned on stronger demand conditions and expectations of greater geopolitical stability. EUR/CZK is going nowhere at 24.25 today. The Czech 2y swap rate (4.1%) holds above the 4% support area as markets don't rule out another potential rate hike. CNB deputy governor Zamrazilova yesterday labelled the June move fine-tuning of policy restriction and not the beginning of a reversal toward a cycle of rate hikes.
The Flemish Community launched its second new benchmark deal of the year today, raising €1bn via short 15-yr bond (Mar2041). They already did a 10-yr benchmark (€2bn Jun2036) at the start of the year. Adding funds collected via private placements (also taps of existing bonds), brings this year's total to €3.95bn. This compares with a total financing need of €8.98bn. Main funding instruments to reach that goal are regular benchmarks (€3-4bn), sustainability benchmarks (€2-2.5bn), private placements (€1-1.5bn) and increased short term funding. Total new funding needs are forecasted to remain constant in the 2027-2030 period at €5-5.33bn. Including bond redemptions results in gross borrowing needs of €6.36bn-6.88bn in 2027, 2028 & 2030 and €7.6bn in 2029.
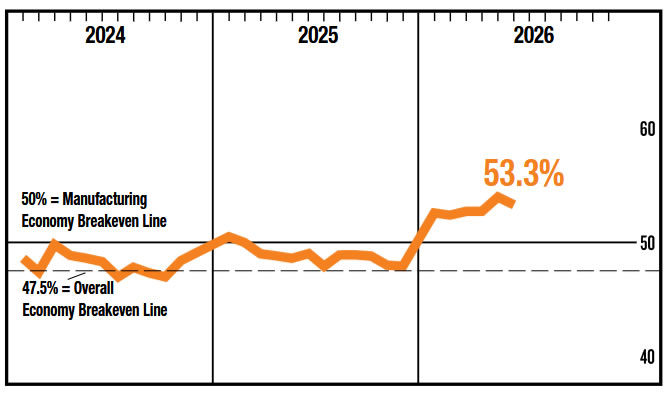
US ISM Manufacturing Slows as Inflation Pressures Ease Sharply
US manufacturing activity remained in expansion territory in June but lost some momentum, with the ISM Manufacturing PMI easing from 54.0 to 53.3, below expectations of 54.2. The report pointed to slower growth in both demand and production, though the headline reading continued to signal a healthy pace of activity consistent with an economy that is still expanding.
The details showed new orders edging down from 56.8 to 56.0 and the production index falling from 54.3 to 52.2, suggesting manufacturing growth moderated after a strong second quarter. The employment index improved from 48.6 to 49.7 but remained below the 50 threshold for a 33rd consecutive month, highlighting that manufacturers continue to rely on productivity gains rather than broad-based hiring. ISM noted that a Manufacturing PMI of 53.3 historically corresponds to annualized real GDP growth of around 2%.
The most notable development came from prices. The Prices Index fell sharply from 82.1 to 73.0, well below expectations of 79.0 and marking the largest monthly decline since July 2022. The data suggest that the easing in oil prices during June is beginning to feed through to manufacturers' costs, reinforcing evidence that the second-quarter energy shock has not generated broader inflation pressures.
| Indicator | Previous | Latest | Consensus |
|---|---|---|---|
| ISM Manufacturing PMI | 54.0 | 53.3 | 54.2 |
| New Orders | 56.8 | 56.0 | — |
| Production | 54.3 | 52.2 | — |
| Employment | 48.6 | 49.7 | — |
| Prices | 82.1 | 73.0 | 79.0 |
Euro Stumbles as Cooling Inflation Shifts Focus From ECB Hikes to Future Rate Cuts
The Euro weakened broadly after June inflation data came in softer than expected, reinforcing the view that the European Central Bank has won an important battle against the recent energy-driven inflation shock. Headline inflation slowed from 3.2% to 2.8%, while core inflation eased from 2.6% to 2.4%, both undershooting market expectations. The figures suggest the surge in oil prices during the second quarter failed to generate meaningful second-round inflation pressures, significantly reducing the urgency for further monetary tightening.
For markets, the implications extend well beyond the ECB's July meeting. A pause next month was already widely anticipated, but the latest inflation data have also substantially lowered the probability of another rate hike in September. If inflation continues to moderate over the coming months, investors may soon begin shifting their focus toward the possibility of ECB rate cuts early next year. Such a repricing would remove one of the Euro's key sources of support, particularly as the Federal Reserve continues to maintain a comparatively hawkish stance.
The Dollar, meanwhile, held firm despite June ADP employment growth slowing to 98k from 112k and falling short of expectations. Traders largely dismissed the report, reflecting the increasingly weak relationship between ADP employment and the official Non-Farm Payrolls data. Attention has instead shifted to Federal Reserve Chair Kevin Warsh's appearance at the ECB Forum in Sintra. While Warsh is unlikely to offer explicit forward guidance, reaffirming his commitment to restoring price stability could reinforce the Dollar ahead of Thursday's payrolls report, which remains the week's defining event for Fed expectations.
Elsewhere, the Japanese Yen continued to underperform, falling to fresh four-decade lows against the Dollar as Tokyo refrained from escalating its verbal intervention campaign. The Canadian Dollar was the second weakest performer, followed by the Swiss Franc. At the other end of the spectrum, the New Zealand Dollar led gains, supported by resilient risk appetite, with Sterling and the Australian Dollar also outperforming. The Dollar and Euro sat near the middle of the weekly rankings, but for very different reasons—the Dollar gradually climbing as markets looked ahead to payrolls, while the Euro slipped as expectations for further ECB tightening faded.
Why Fed's Warsh Could Trigger Silver's Next Selloff Without Saying Much
Silver may not need a hot payrolls report to fall further. We explain why Fed Chair Kevin Warsh's "talk less" philosophy could tighten financial conditions—and trigger the next leg lower—even without announcing a single policy change. Read More
NASDAQ Has Finished Consolidating. Now It Needs Permission from Goldilocks NFP
The NASDAQ may already have finished consolidating after its strongest quarter in six years. We explain why a Goldilocks Non-Farm Payrolls report could be the final green light for another push to record highs. Read More.
US ADP Employment: Hiring Slows While Wage Growth Holds Firm
US ADP employment rose just 98k in June, missing forecasts as hiring slowed ahead of Non-Farm Payrolls, while wage growth remained resilient. Read More.
Eurozone CPI Slows to 2.8%, Strengthening Case for ECB Pause
Eurozone inflation slowed more than expected in June as headline CPI fell to 2.8% and core inflation eased to 2.4%, strengthening the case for the ECB to keep interest rates unchanged. Read More.
Eurozone PMI Manufacturing Shows Resilience, but Inventory Tailwind May Be Ending
Eurozone factory activity continues to expand, supported by cheaper energy and improving supply chains. Find out why the next stage of the recovery will depend more on genuine demand than inventory building. Read More.
UK Manufacturing PMI Slips from Four-Year High as Stockpiling Boost Fades
UK Manufacturing PMI eased to 52.5 in June as client stockpiling began to fade, though factory output remained strong and lower energy prices helped cool inflation pressures. Read More.
BoJ Tankan: Manufacturing Sentiment Climbs to Highest Since 2018, Outlook Turns More Cautious
The latest BoJ Tankan survey delivered another upside surprise, but the strongest business confidence since 2018 comes with a notable warning about the months ahead. Read More.
Japan Manufacturing PMI Hits 12-Year Quarterly High as AI Demand Drives Growth
Japan's manufacturers just delivered their strongest quarter in more than a decade—but not all of the strength may be sustainable. We explain why booming AI demand and temporary stockpiling are telling two very different stories about the outlook. Read More.
Australia Manufacturing PMI Finalized at Five-Month High Despite Middle East Disruptions
Australia's manufacturers are looking beyond today's supply disruptions. Despite higher costs and delivery delays, firms continued hiring and building inventories, positioning themselves for a stronger recovery once demand improves. Read More.
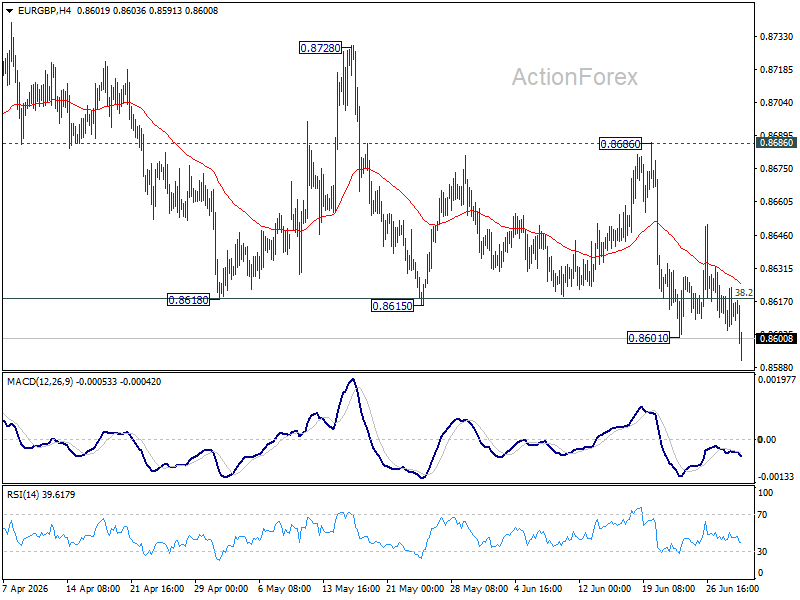
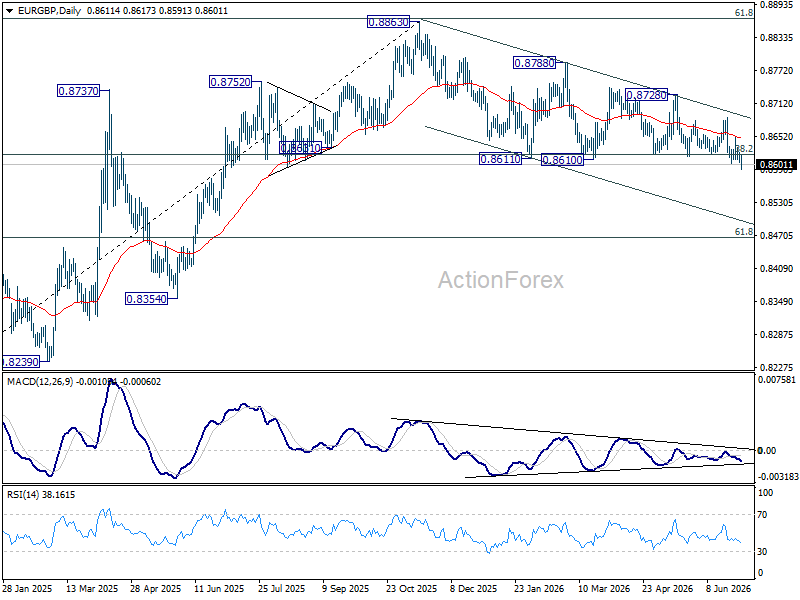
EUR/GBP Daily Outlook
Intraday bias in EUR/GBP is back on the downside with break of 0.8601 support. Sustained trading below 0.8618 fibonacci level should confirm bearish reversal. Next target is 0.8466. For now, risk will stay on the downside as long as 0.8686 resistance holds.
In the bigger picture, focus is staying on 38.2% retracement of 0.8221 to 0.8863 at 0.8618. Strong rebound from there will retain medium term bullishness. Rise from 0.8221 should resume through 0.8863 at a later stage. Nevertheless, sustained break of 0.8618 will confirm that whole rise from 0.8221 has completed at 0.8863. Deeper decline should then be seen to 61.8% retracement at 0.8466 at least.
US ADP Employment: Hiring Slows While Wage Growth Holds Firm
US private-sector hiring slowed more than expected in June, with ADP employment rising by 98k, below the consensus forecast of 118k and down from May's 122k. The report points to a gradual cooling in labor demand ahead of Thursday's closely watched Non-Farm Payrolls release, though wage growth remained relatively resilient.
Hiring continued to be driven by the services sector, which added 96k jobs, while goods-producing industries contributed just 2k. Employment gains were broad-based across business sizes, led by small firms with 53k new jobs, followed by medium-sized businesses with 29k and large companies with 25k.
ADP Chief Economist Nela Richardson said the hiring trend reflects "both supply and demand," noting that while job seekers are taking longer to find work, labor shortages persist in some industries. "For now, the overall effect is a slowdown in job creation," she added.
The report offered a mixed signal on wage pressures. Median annual pay growth for workers staying in their jobs was unchanged at 4.4%, while pay gains for job changers accelerated to 6.6%.
| Indicator | Previous | Latest | Consensus |
|---|---|---|---|
| ADP Employment Change | 112k | 98k | 118k |
| Goods-Producing Employment | 2k | ||
| Service-Providing Employment | 96k | ||
| Small Establishments | 53k | ||
| Medium Establishments | 29k | ||
| Large Establishments | 25k | ||
| Job-Stayer Pay Growth (YoY) | 4.4% | ||
| Job-Changer Pay Growth (YoY) | 6.6% |
Eurozone Inflation Falls More Than Expected in June, Eases Pressure on ECB for Further Tightening
Eurozone inflation eased to 2.8% in June from 3.2% in May and fell below expectations for 3.0% rise, while core inflation, that excludes the most volatile components, fell to 2.4% last month from 2.6% in May and undershot 2.5% forecast.
Lower prices of energy and food were mainly behind June’s better than expected numbers that eases pressure on the European Central Bank to raise interest rates again amid increased price pressures.
Although the bloc’s inflation remains well above the central bank’s 2% target, growing optimism over the recent decline in oil prices on prospects for a peace deal between the US and Iran, has raised hopes that inflation would continue to ease.
In the latest comments, ECB policymakers highlighted that there is no rush for the central bank to follow up 25 basis points rate hike on June 11 policy meeting, as June CPI numbers provide relief and more time for further evaluation of price pressure dynamics.
However, many economists think that the ECB is likely to raise rates again in September or October, as energy prices remain above pre-war levels and overall situation is still fragile, with renewed tensions to keep the price outlook volatile.
EUR/USD Daily Outlook
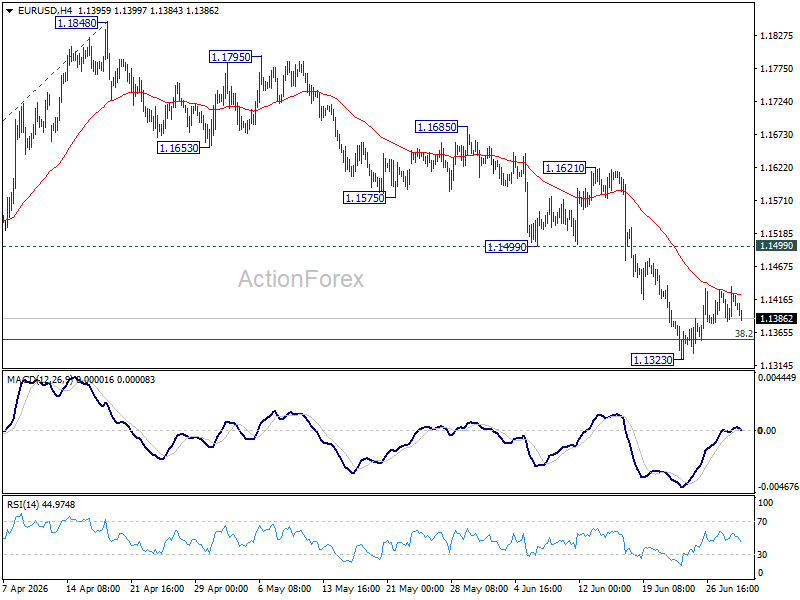
Intraday bias in EUR/USD remains neutral and more consolidations could be seen above 1.1323. Further fall is expected as long as 1.1499 support turned resistance holds. Break of 1.1323 will resume the fall from 1.2081 to 100% projection of 1.2081 to 1.1408 from 1.1848 at 1.1175.
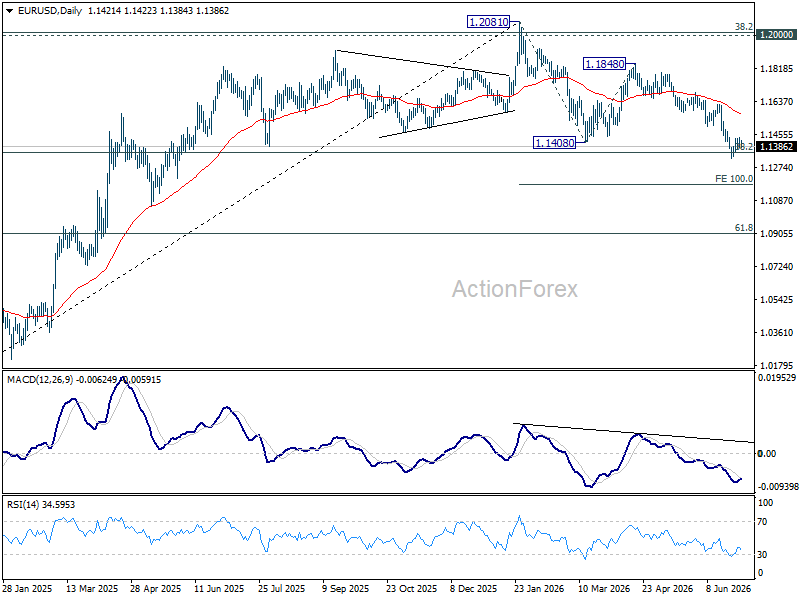
In the bigger picture, focus is back on 38.2% retracement of 1.0176 to 1.2081 at 1.1353. Decisive break there will revive the case of medium term bearish trend reversal after rejection by 1.2 key cluster resistance level. Further fall should be seen to 61.8% retracement at 1.0904. Nevertheless, strong rebound from 1.1353, followed by break of 1.1621 resistance, will retain medium term bullishness.
USD/JPY Daily Outlook
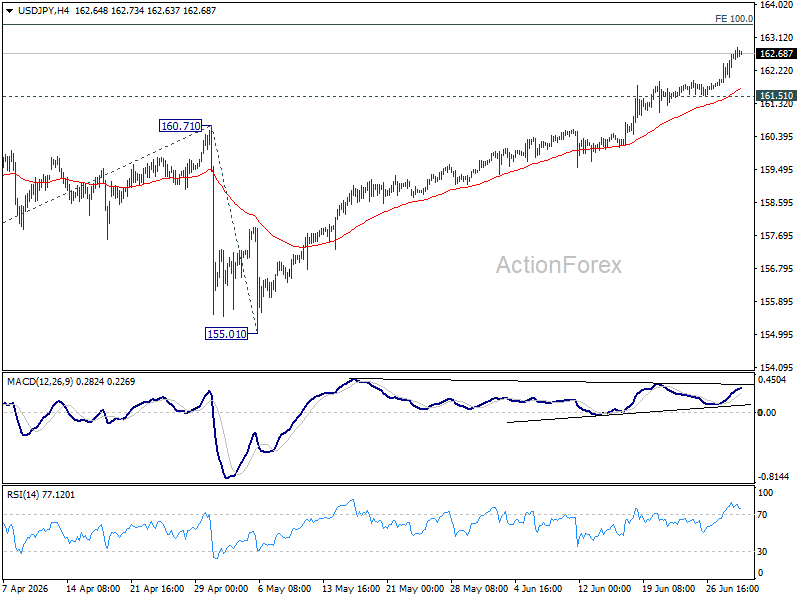
Intraday bias in USD/JPY remains on the upside at this point. Current up trend should target 100% projection of 152.25 to 160.71 from 155.01 at 163.47 next. On the downside, below 161.51 minor support will turn intraday bias neutral again first.
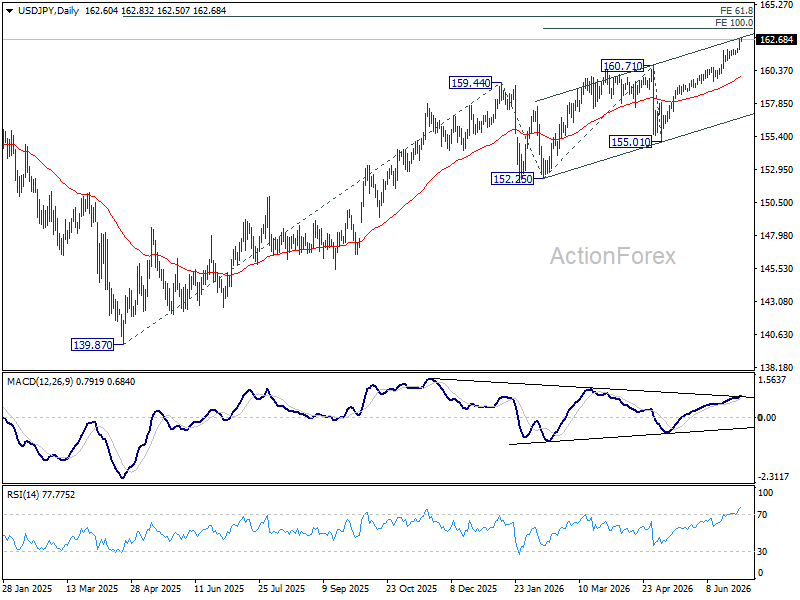
In the bigger picture, rise from 139.87 (2025 low) is seen as another rising leg of the long term up trend. Next target is 61.8% projection of 139.87 to 159.44 from 152.25 at 164.34. For now, outlook will remain bullish as long as 155.01 support holds, even in case of deep pullback.
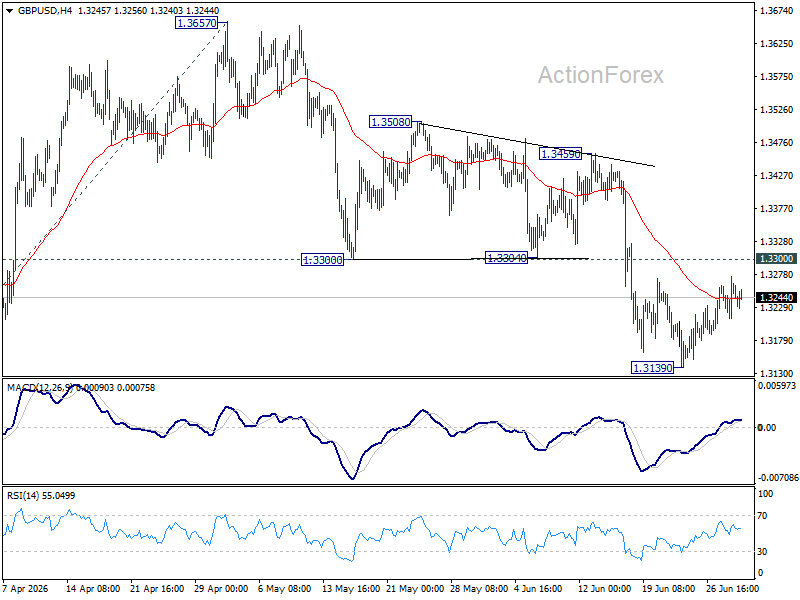
GBP/USD Daily Outlook
Intraday bias in GBP/USD stays neutral as consolidations continue above 1.3139. Upside should be limited by 1.3300 support turned resistance. Below 1.3139 will resume the fall from 1.3657 and target 100% projection of 1.3867 to 1.3158 from 1.3657 at 1.2948.
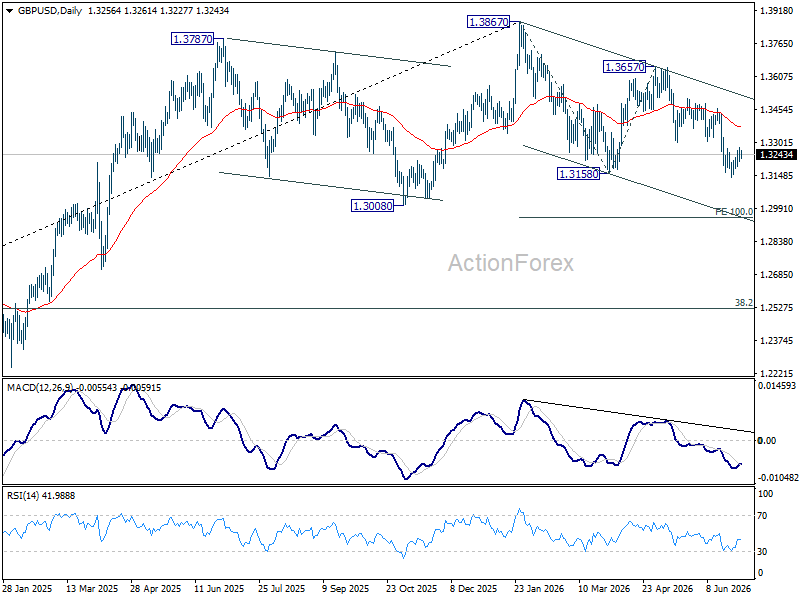
In the bigger picture, price actions from 1.3867 are a corrective pattern within the broader up trend from 1.0351 (2022 low). With 1.3008 support intact, medium term bullishness is maintained and break of 1.3867 is in favor for a later stage, towards 1.4248 key resistance (2021 high). However, firm break of 1.3008 will at least bring deeper fall to 38.2% retracement of 1.0351 to 1.3867 at 1.2524, with increased risk of bearish reversal.
USD/CHF Daily Outlook
Intraday bias in USD/CHF remains neutral and more consolidations could be seen below 0.8139. Downside should be contained by 0.8012 resistance turned support to bring another rally. Above 0.8139 will target 100% projection 0.7603 to 0.8041 from 0.7600 at 0.8198 next.
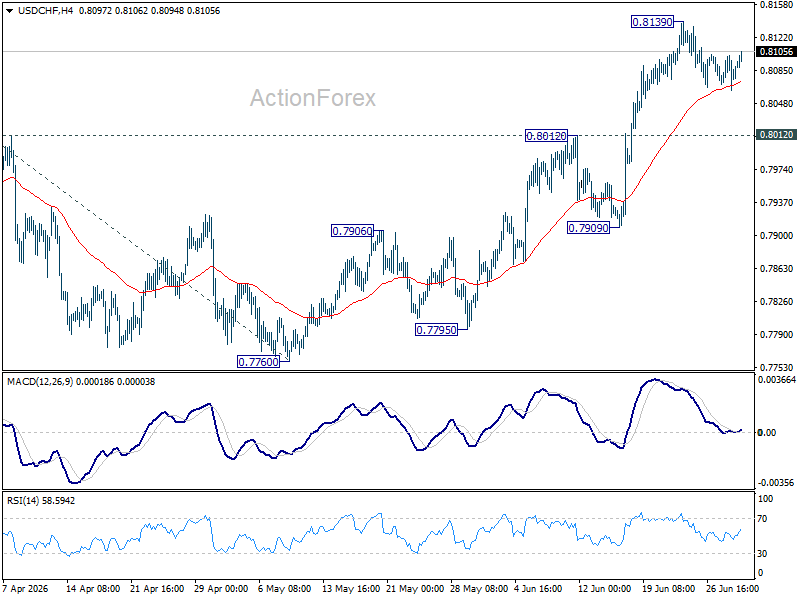
In the bigger picture, while a medium term bottom was formed at 0.7603, it's still early to call for bullish trend reversal. As long as 38.2% retracement of 0.9200 (2025 high) to 0.7603 at 0.8213 holds, the larger down trend could still continue through 0.7603 at a later stage. However, firm break of 0.7603 will argue that the trend has reversed and turn focus to 0.8332 support turned resistance (2023 low) for confirmation.

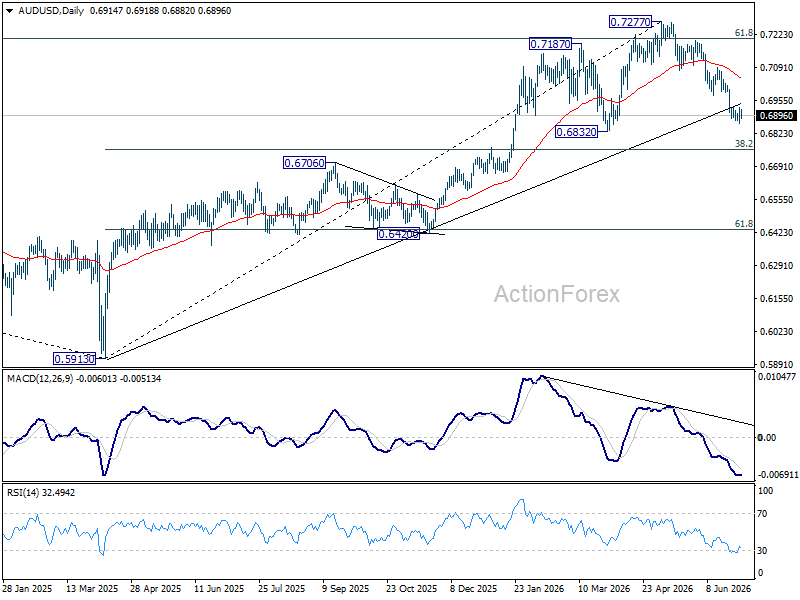
AUD/USD Daily Report
Intraday bias in AUD/USD is turned neutral first with current recovery, and some consolidations could be seen. Further decline is expected as long as 0.6977 support turned resistance holds. Below 0.6864 will extend the fall from 0.7277 to 0.6832 support. Firm break there will target 0.6756 fibonacci level.
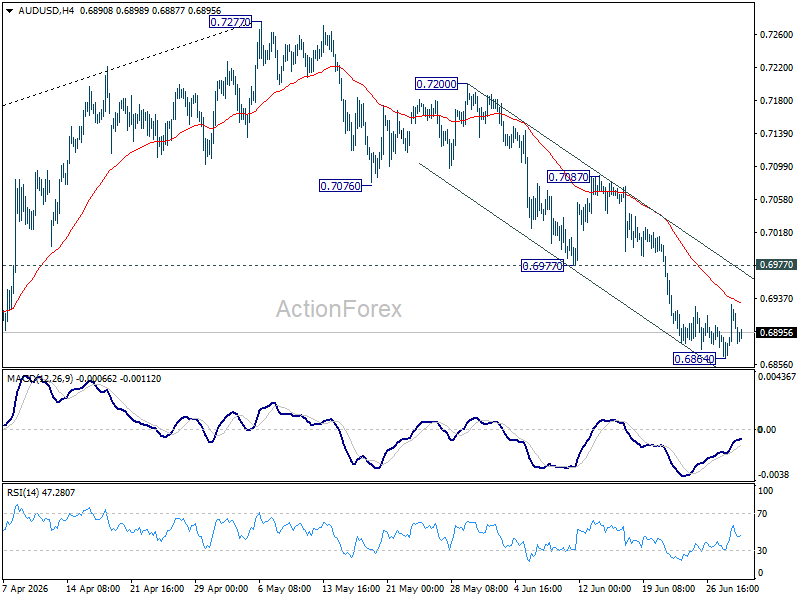
In the bigger picture, considering bearish divergence condition in D MACD, a medium term top could be formed at 0.7277 after failing to sustain above 61.8% retracement of 0.8006 (2021 high) to 0.5913 (2024 low) at 0.7206. Deeper fall could be seen to 38.2% retracement of 0.5913 to 0.7277 at 0.6756 as a correction. But strong support should be seen there to bring rebound. Consolidations would continue below 0.7277 for a while.