
Sample Category Title
AUD/USD Daily Report
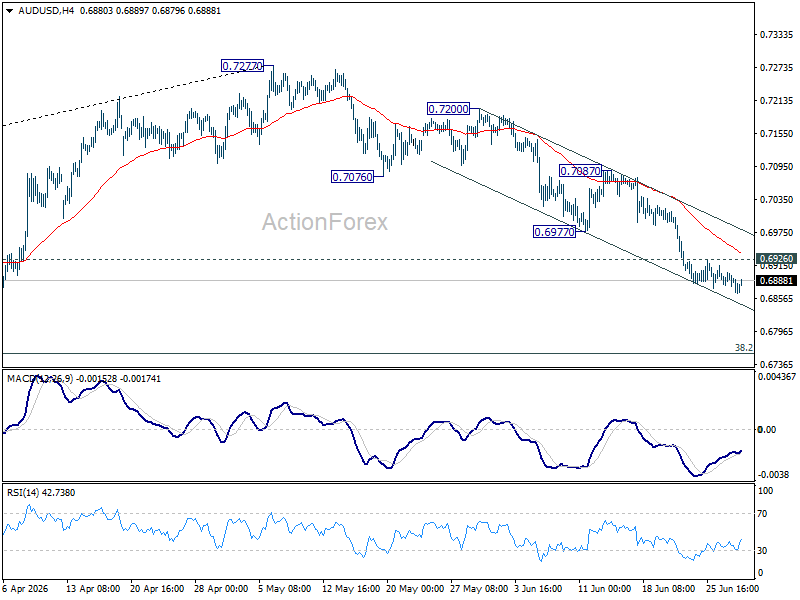
Intraday bias in AUD/USD stays mildly on the downside. Fall from 0.7277 should continue to 0.6832 support. Firm break there will target 0.6756 fibonacci level. On the upside, above 0.6926 minor resistance will turn intraday bias neutral again first.
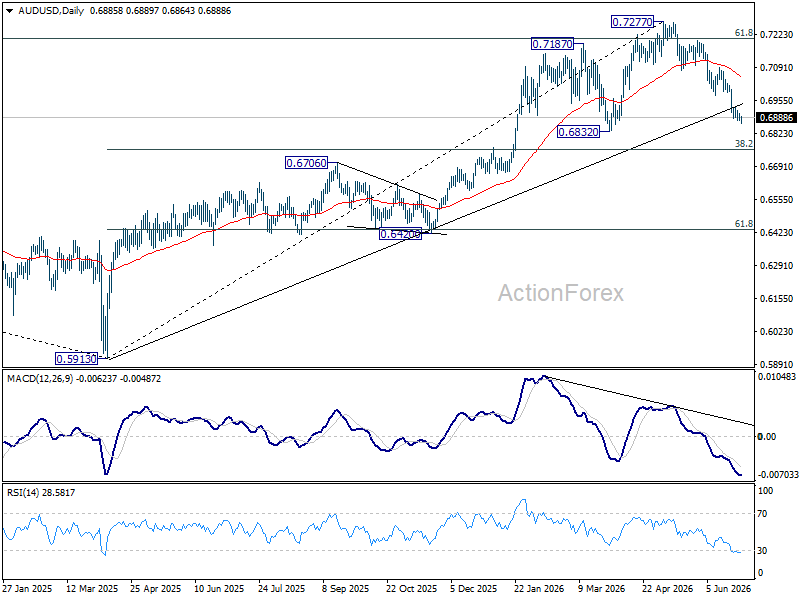
In the bigger picture, considering bearish divergence condition in D MACD, a medium term top could be formed at 0.7277 after failing to sustain above 61.8% retracement of 0.8006 (2021 high) to 0.5913 (2024 low) at 0.7206. Deeper fall could be seen to 38.2% retracement of 0.5913 to 0.7277 at 0.6756 as a correction. But strong support should be seen there to bring rebound. Consolidations would continue below 0.7277 for a while.
USD/CAD Daily Outlook
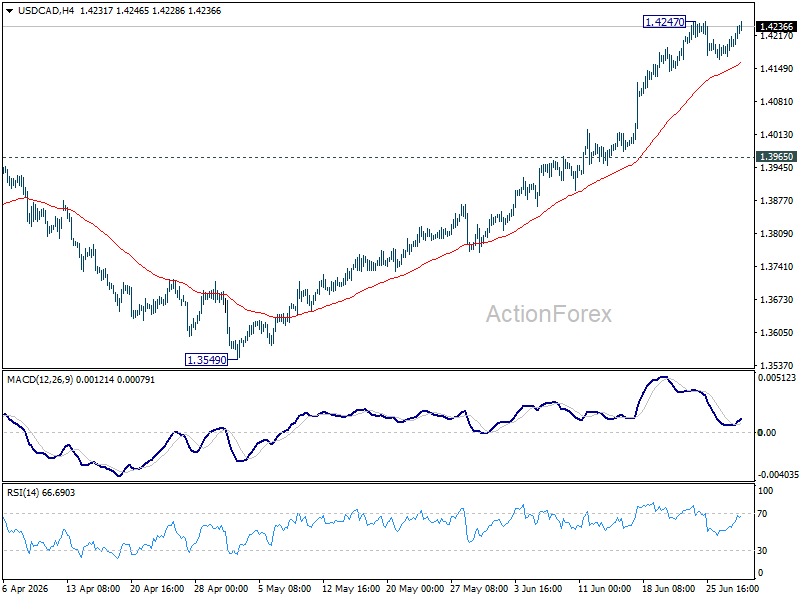
Intraday bias in USD/CAD remains neutral. Consolidations from 1.4247 could extend with another falling leg. But downside should be contained above 1.3965 resistance turned support. Above 1.4247 will resume the rally from 1.3480 to 61.8% retracement of 1.4791 to 1.3480 at 1.4290. Firm break there will pave the way back to 1.4791 high.
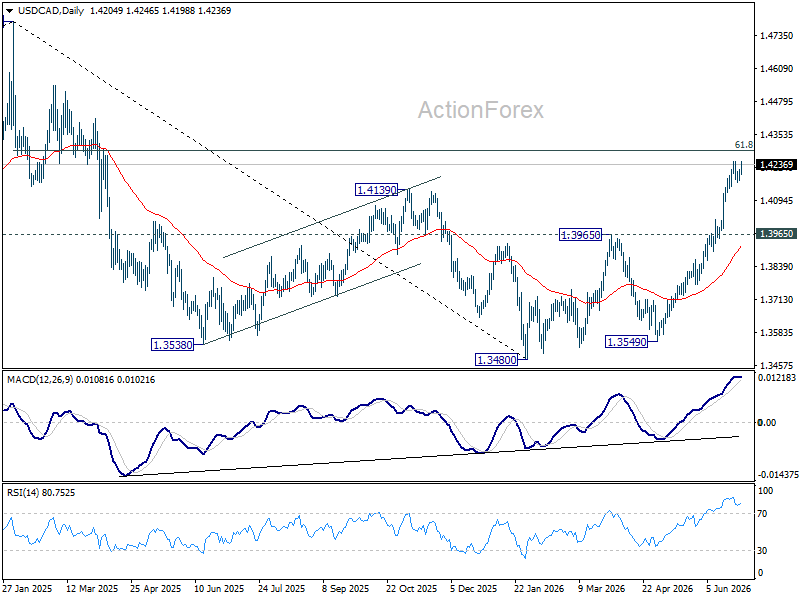
In the bigger picture, current development suggests that fall from 1.4791 has completed as a three wave correction to 1.3480. It's still early to judge if rise from there a corrective bounce, or resumption of the larger up trend from 1.2005 (2021 low). But in either case, retest of 1.4791 high should be seen next.
GBP/JPY Daily Outlook
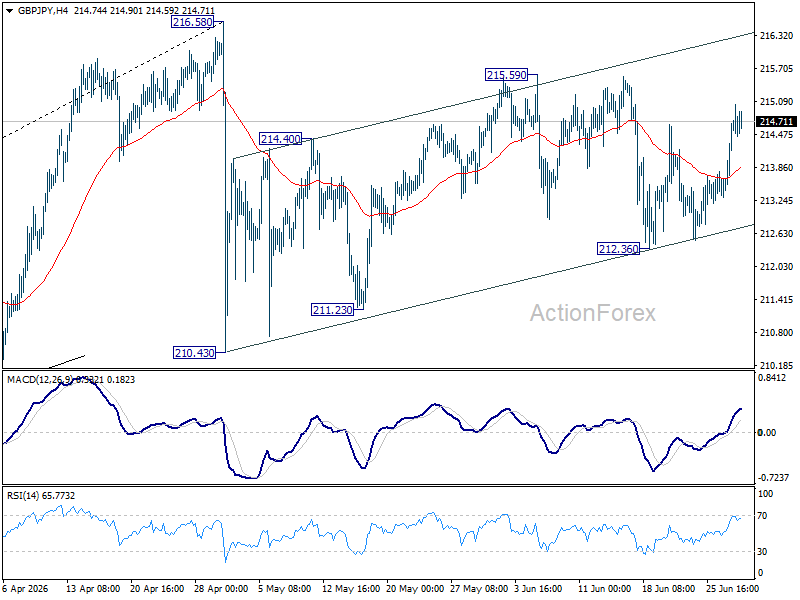
Intraday bias in GBP/JPY remains neutral at this point. On the downside, below 212.36 will affirm the case that rebound from 210.43 has completed as a correction. Deeper fall would be seen to 211.23 support first. However, break of 215.59 will resume the rebound from 210.43 to retest 216.58.
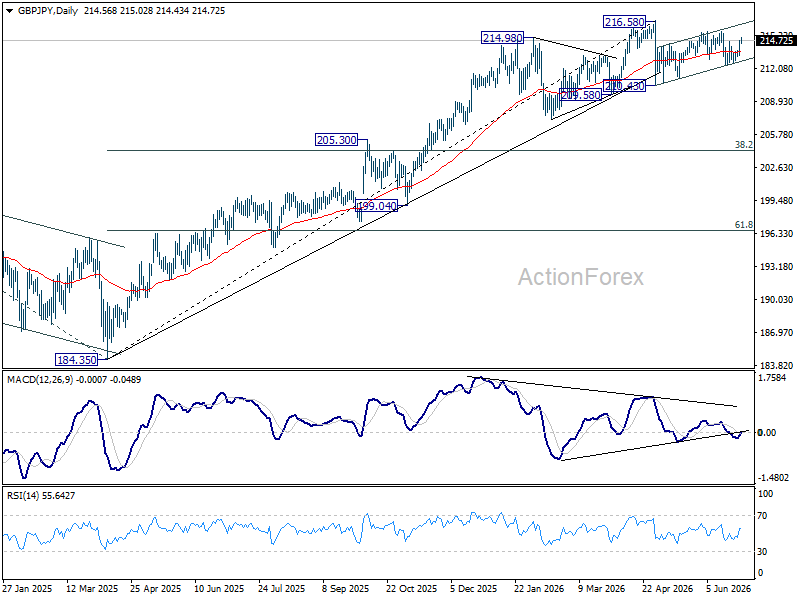
In the bigger picture, there is no clear sign of trend reversal yet. The long term up trend could still extend to 61.8% projection of 148.93 (2022 low) to 208.09 (2024 high) from 184.35 at 220.90 on resumption. However, sustained break of 55 W EMA (now at 207.52) will argue that it's already in medium term down trend for 184.35 support.
EUR/JPY Daily Outlook
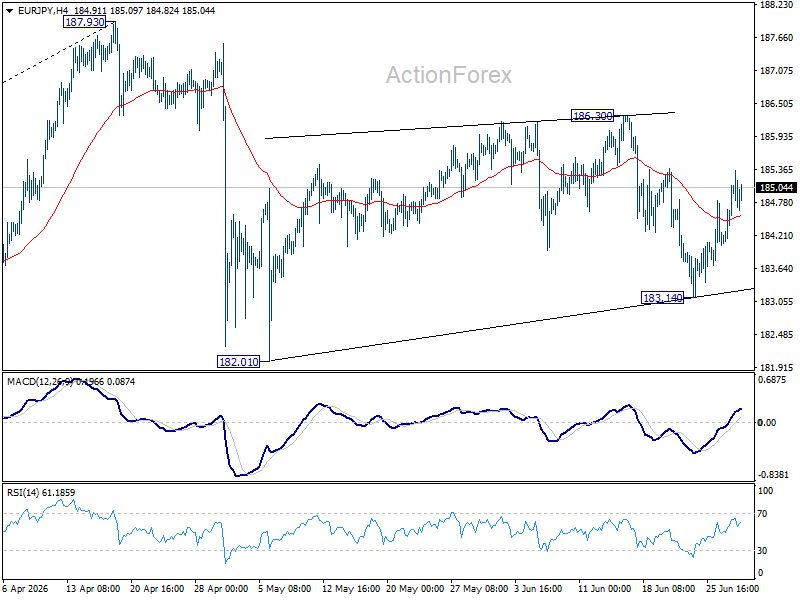
Intraday bias in EUR/JPY remains neutral at this point. Risk will remain mildly on the downside as long as 186.30 resistance holds. Below 183.14 will bring retest of 182.01 support first. However, firm break of 186.30 will resume the rebound from 182.01 to retest 187.93 high.
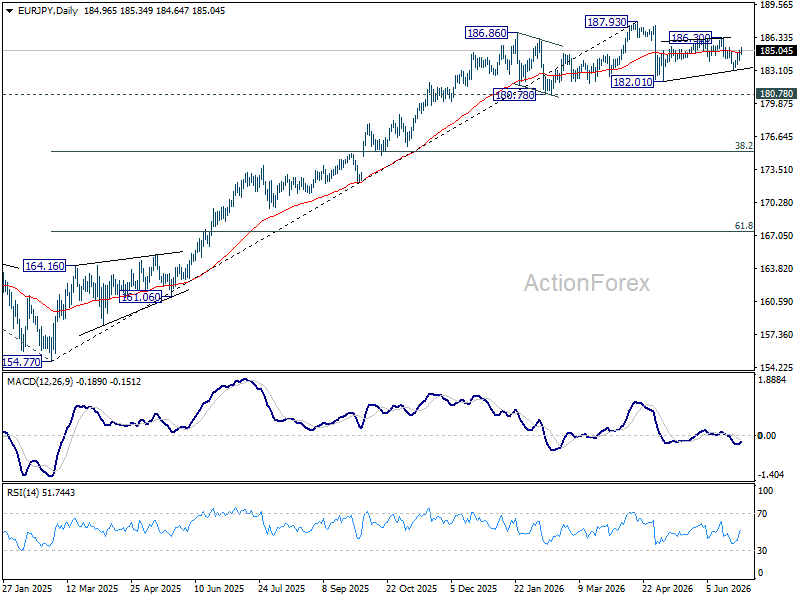
In the bigger picture, there is no sign of reversal yet. Uptrend from 114.42 (2020 low) is still expected to resume at a later stage to 78.6% projection of 124.37 (2022 low) to 175.41 (2025 high) from 154.77 at 194.88. However, sustained break of 55 W EMA (now at 179.37) will argue that it's already in a medium term down trend to 175.41 resistance turned support and below.
EUR/GBP Daily Outlook
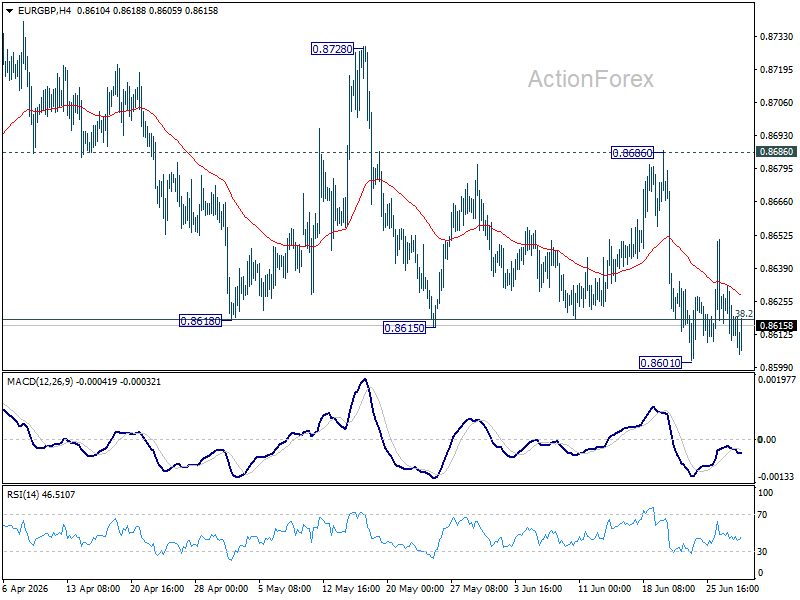
No change in EUR/GBP's outlook and intraday bias stays neutral. Risk will remain mildly on the downside as long as 0.8686 resistance holds. Firm break of 0.8601 will revive the case of bearish trend reversal. However, break of 0.8686 will turn bias back to the upside for 0.8728 resistance instead.
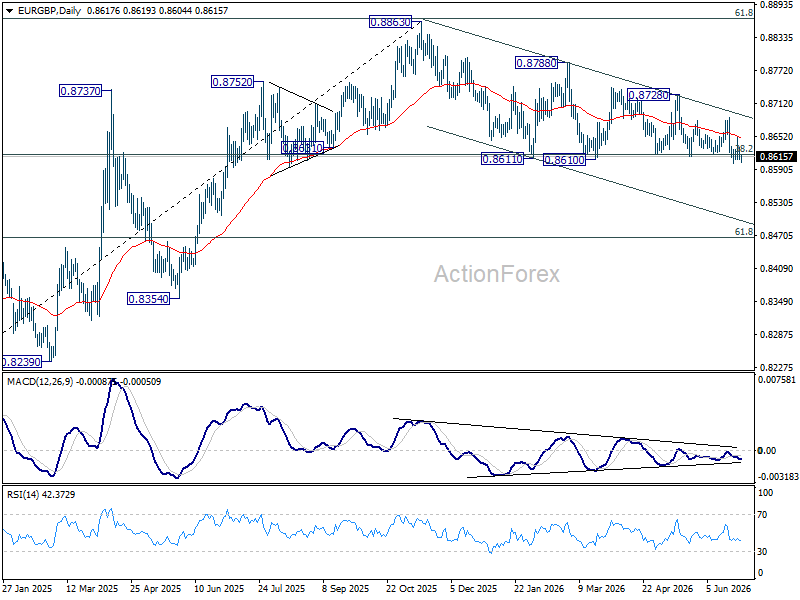
In the bigger picture, focus is staying on 38.2% retracement of 0.8221 to 0.8863 at 0.8618. Strong rebound from there will retain medium term bullishness. Rise from 0.8221 should resume through 0.8863 at a later stage. Nevertheless, sustained break of 0.8618 will confirm that whole rise from 0.8221 has completed at 0.8863. Deeper decline should then be seen to 61.8% retracement at 0.8466 at least.
EUR/AUD Daily Outlook
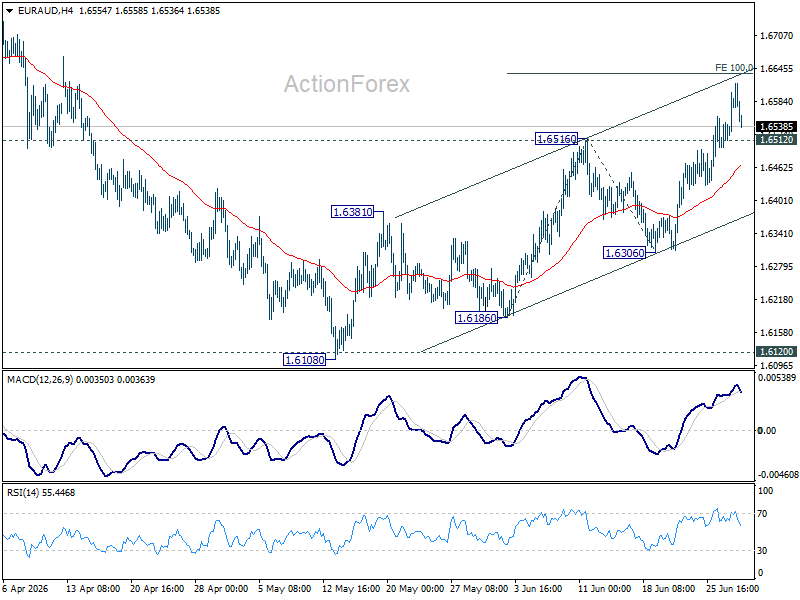
Intraday bias in EUR/AUD remains on the upside, and rise from 1.6108 should target 100% projection of 1.6186 to 1.6516 from 1.6306 at 1.6636 next. On the downside, below 1.6512 minor support will turn intraday bias neutral. But further rise will remain mildly in favor as long as 1.6306 support holds, in case of retreat.
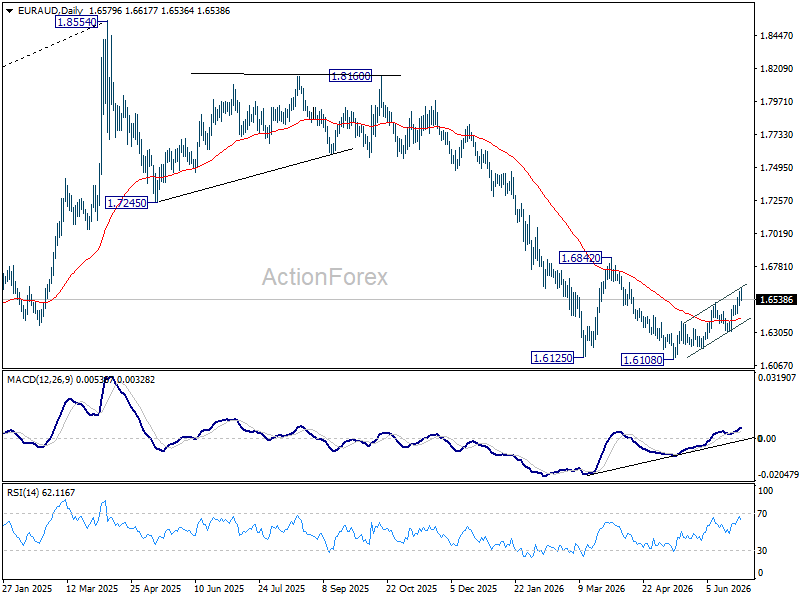
In the bigger picture, outlook will stay bearish as long as 1.6842 resistance holds. Fall from 1.8554 (2025 high) is expected to continue to 61.8% retracement of 1.4281 to 1.8554 at 1.5913. Decisive break there will pave the way back to 1.4281 (2022 low). However, firm break of 1.6842 should confirm medium term bottoming, and bring stronger rally.
EUR/CHF Daily Outlook
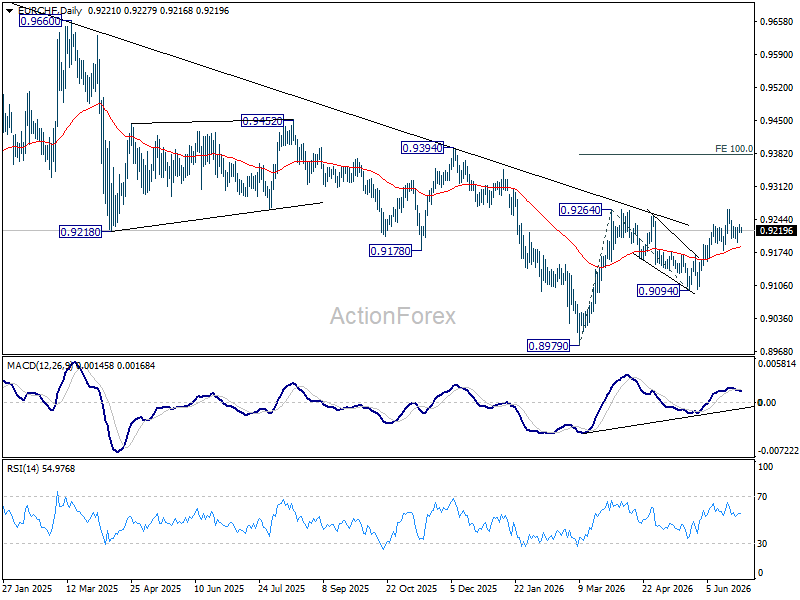
EUR/CHF's consolidation from 0.9265 is still extending, and intraday bias remains neutral. Further rally is expected as long as 0.9179 support holds. On the upside,firm break of 0.9264/5 will resume the rally from 0.8979 to 100% projection of 0.8979 to 0.9264 from 0.9094 at 0.9379.
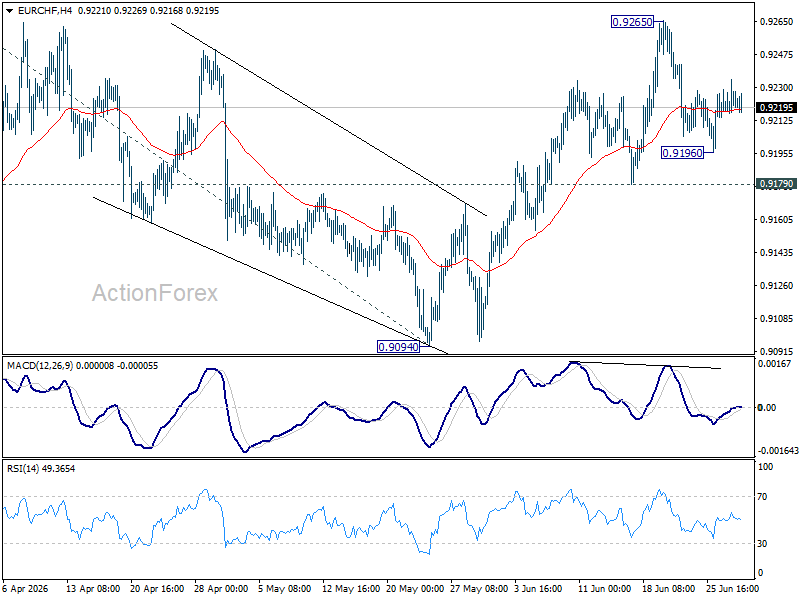
In the bigger picture, the break of medium term falling trend line resistance indicates that 0.8979 is already a medium term bottom. Considering bullish convergence condition in W MACD, rise from there should at least be reversing the fall from 0.9928, with prospect of developing into a medium term up trend. Firm break of 0.9394 resistance will add more credence to this case. For now risk will remain on the upside as long as 0.9094 support holds, in case of retreat.
Gold: Heading for $3,600?
- Easing concerns over the Fed’s independence have bolstered the Dollar.
- Fears of high interest rates are weighing on gold.
The US dollar rose after a three-day decline, thanks to growing investor confidence in the Fed’s independence, anticipation of Kevin Warsh’s speech in Sintra, Portugal, and the realisation that the situation in the Middle East must be taken seriously. The US is attempting to de-escalate the conflict and has announced talks, but Iran insists on maintaining control over the Strait of Hormuz. The positions of the two sides remain far apart, heightening geopolitical risks and boosting demand for the greenback as a safe-haven asset.
The US dollar received a boost from the Supreme Court’s ruling that Donald Trump cannot dismiss Lisa Cook from her post at the Fed. Had the situation been different, the White House would have filled the Committee with doves and pushed for a rate cut. Such a scenario would have put pressure on the US dollar due to fears that the Fed might lose its independence. Now that this threat has been removed, it is having a positive impact on the USD index.
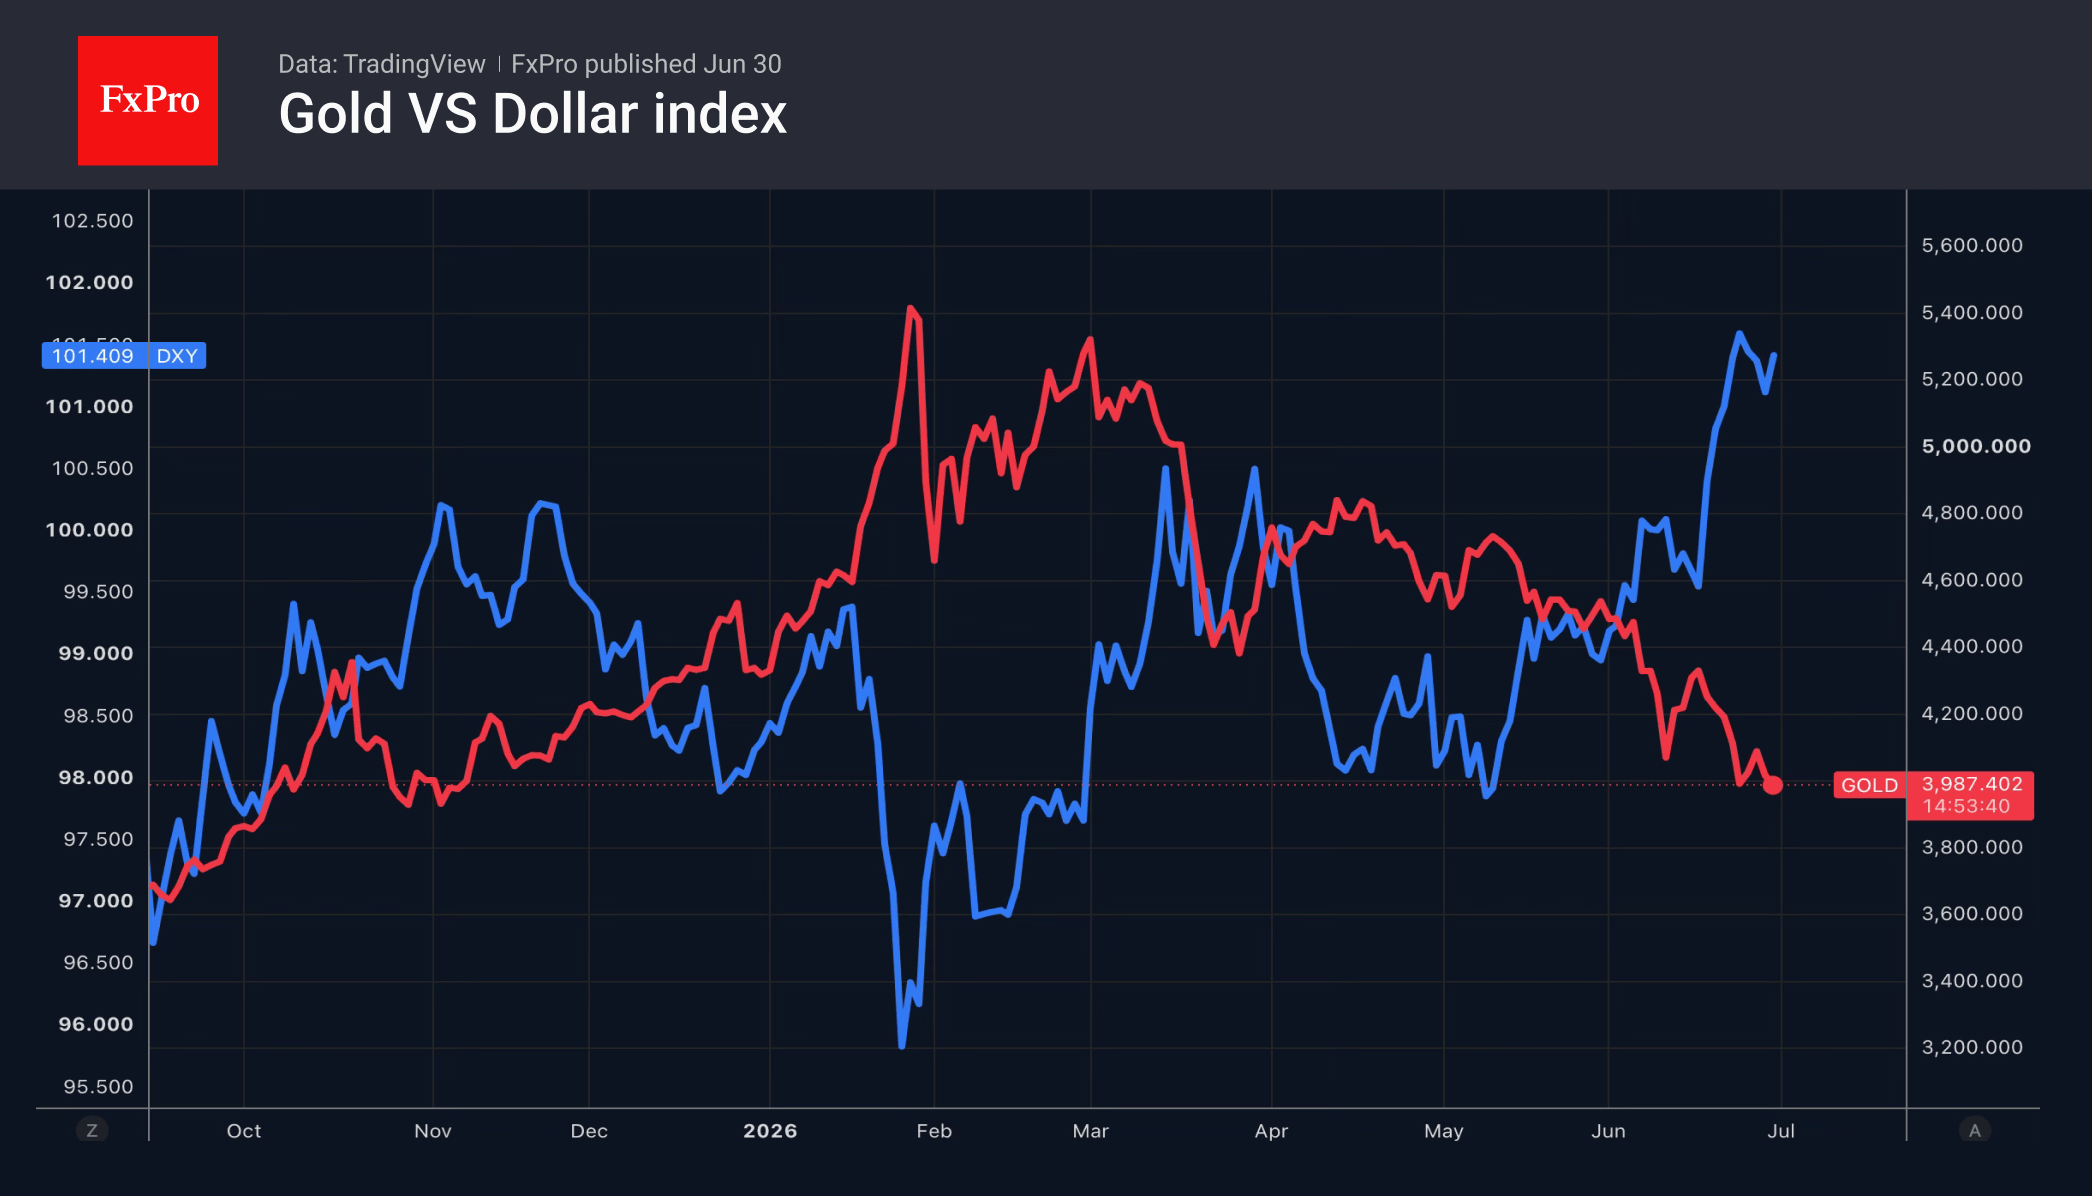
The strengthening of the US dollar has created headwinds for gold, pushing it back below $4,000 per ounce. While the fall in oil prices is reducing inflationary risks, the market remains fixated on the possibility of a Fed rate hike and a stronger dollar.
Precious metals have seen a brief resurgence amid a reduced likelihood of monetary tightening. The probability of monetary tightening in September has fallen over the past week from over 70% to 62%, whilst the likelihood of two federal funds rate hikes in 2026 has dropped from 50% to 38%. Nevertheless, investors’ attention is focused more on the persistence of relatively high interest rates, causing non-yielding gold to lose ground.
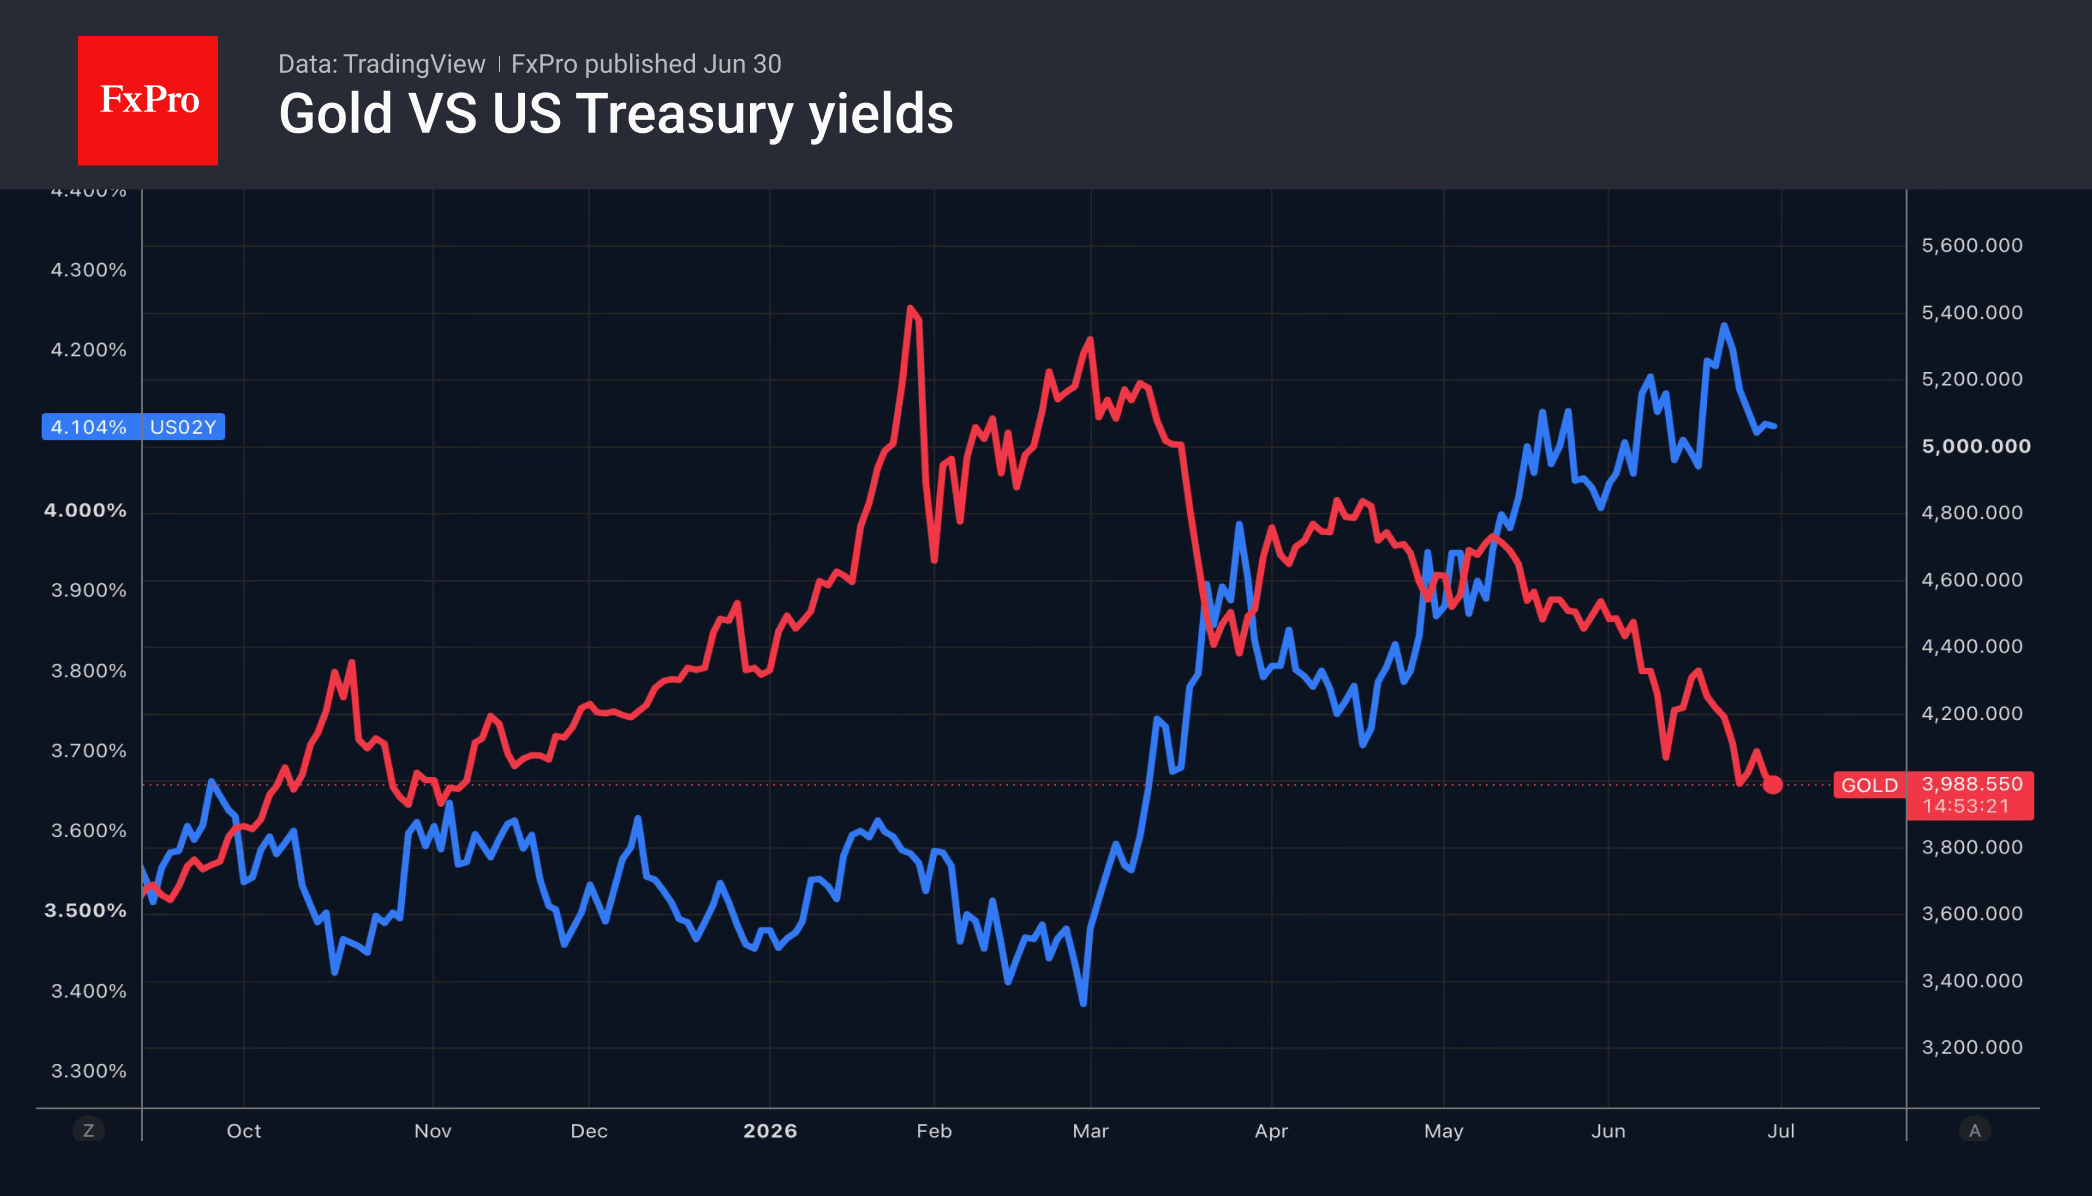
The high yields on Treasuries are being sustained by Warsh’s emphasis on the Fed talking less and acting more. The new chair wants the markets to signal to the central bank where rates should be, rather than the central bank dictating to the markets. The Fed’s shift from verbosity to reticence is heightening uncertainty and allowing investors to demand a higher risk premium. This is reflected in debt market rates and the dynamics of Gold.
The bulls believe that gold will prove more resilient to headwinds. The bears are counting on it falling further towards $3,600 before buying interest returns.
The FxPro Analyst Team
Is Bitcoin Set to Move Lower?
Market Overview
The crypto market capitalisation has changed little over the past 24 hours, remaining close to $2.06T. Among the most popular coins with traders, the top gainers are Stellar (+7.3%), Zcash (+4.2%), and Solana (+2.2%). The biggest fallers were Cosmos and Aave (both down 3.9%) and Immutable (-2.9%).
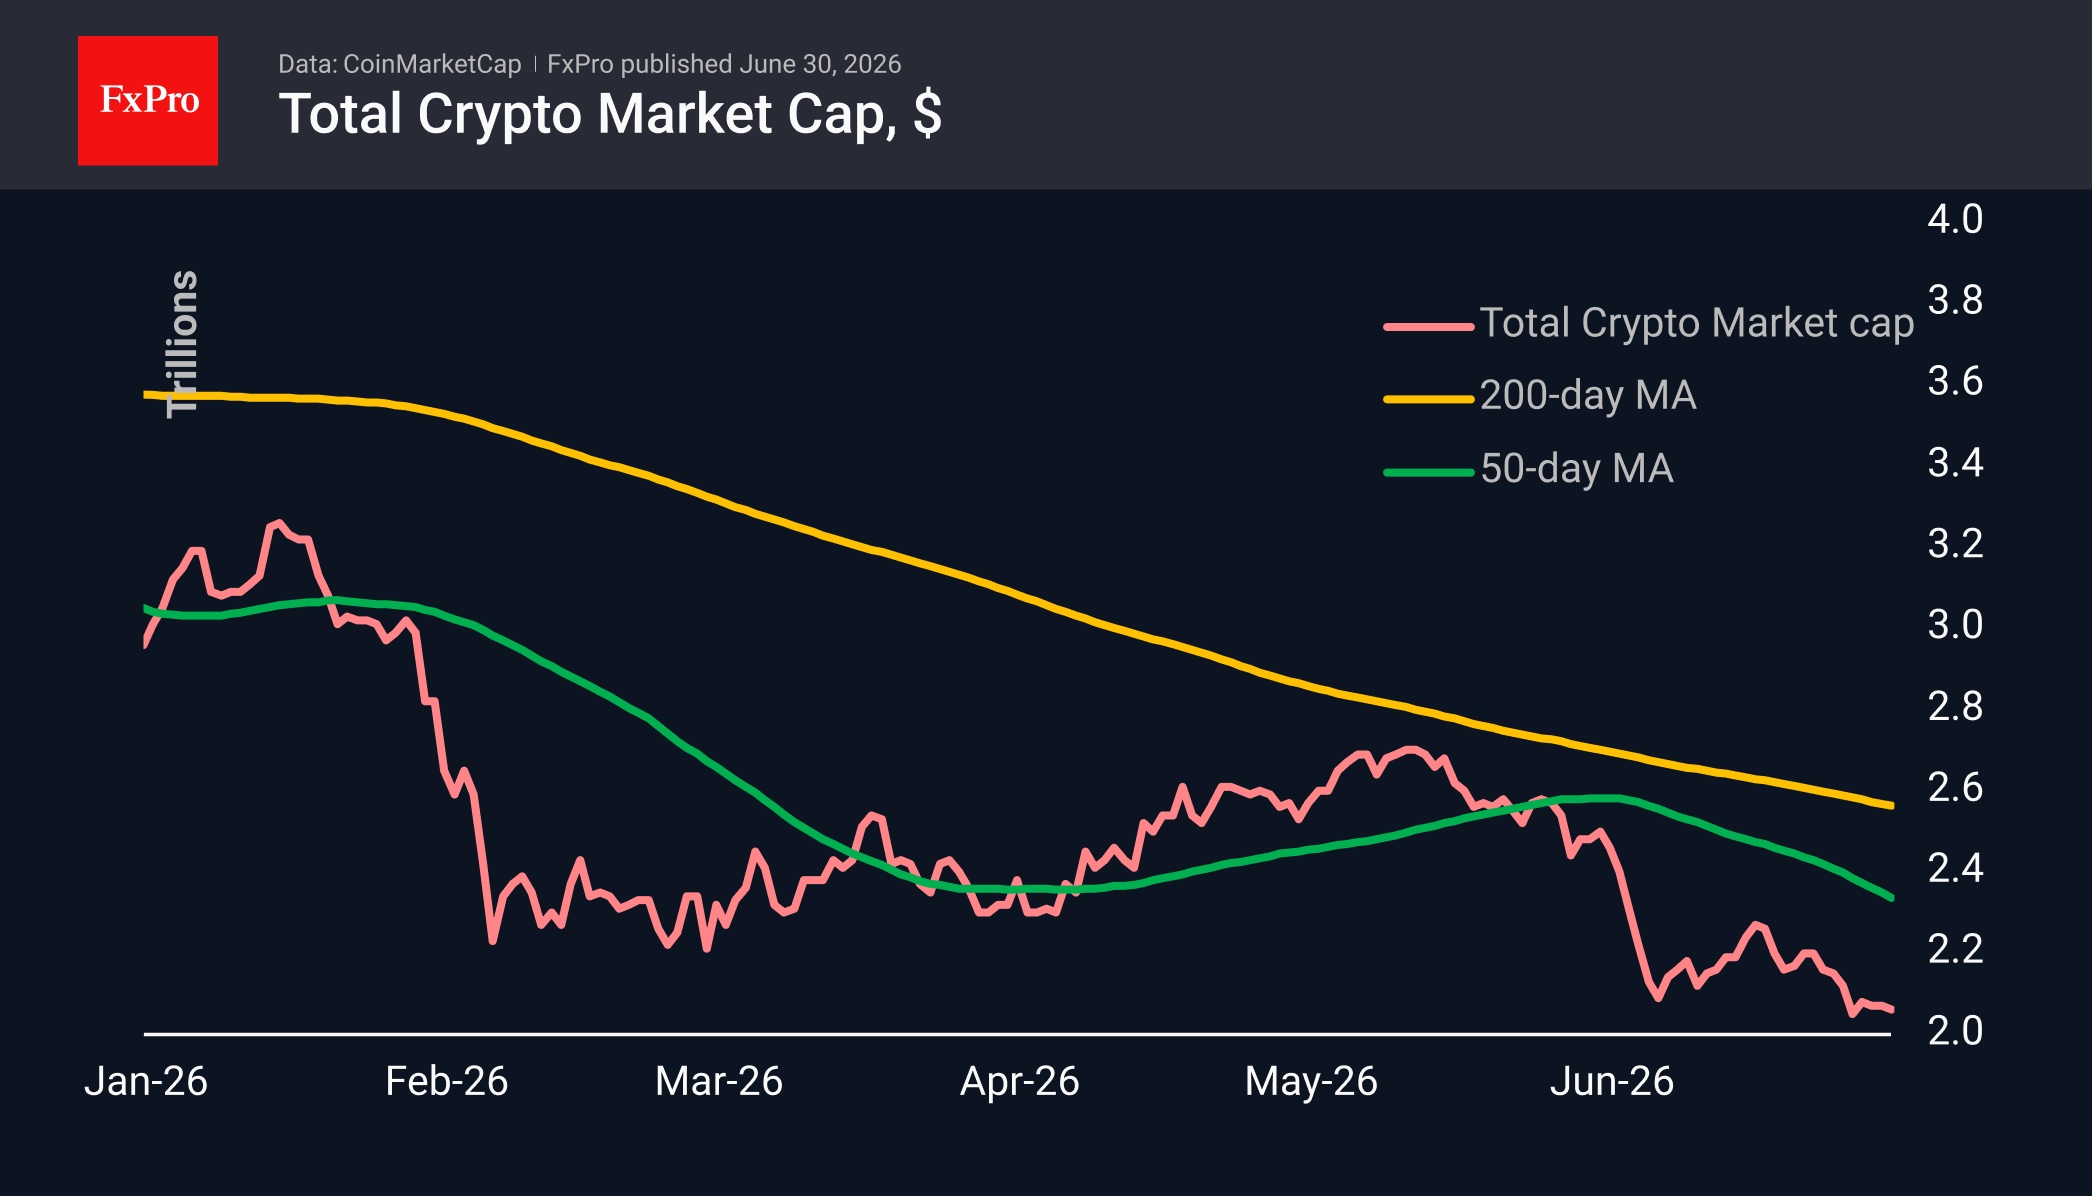
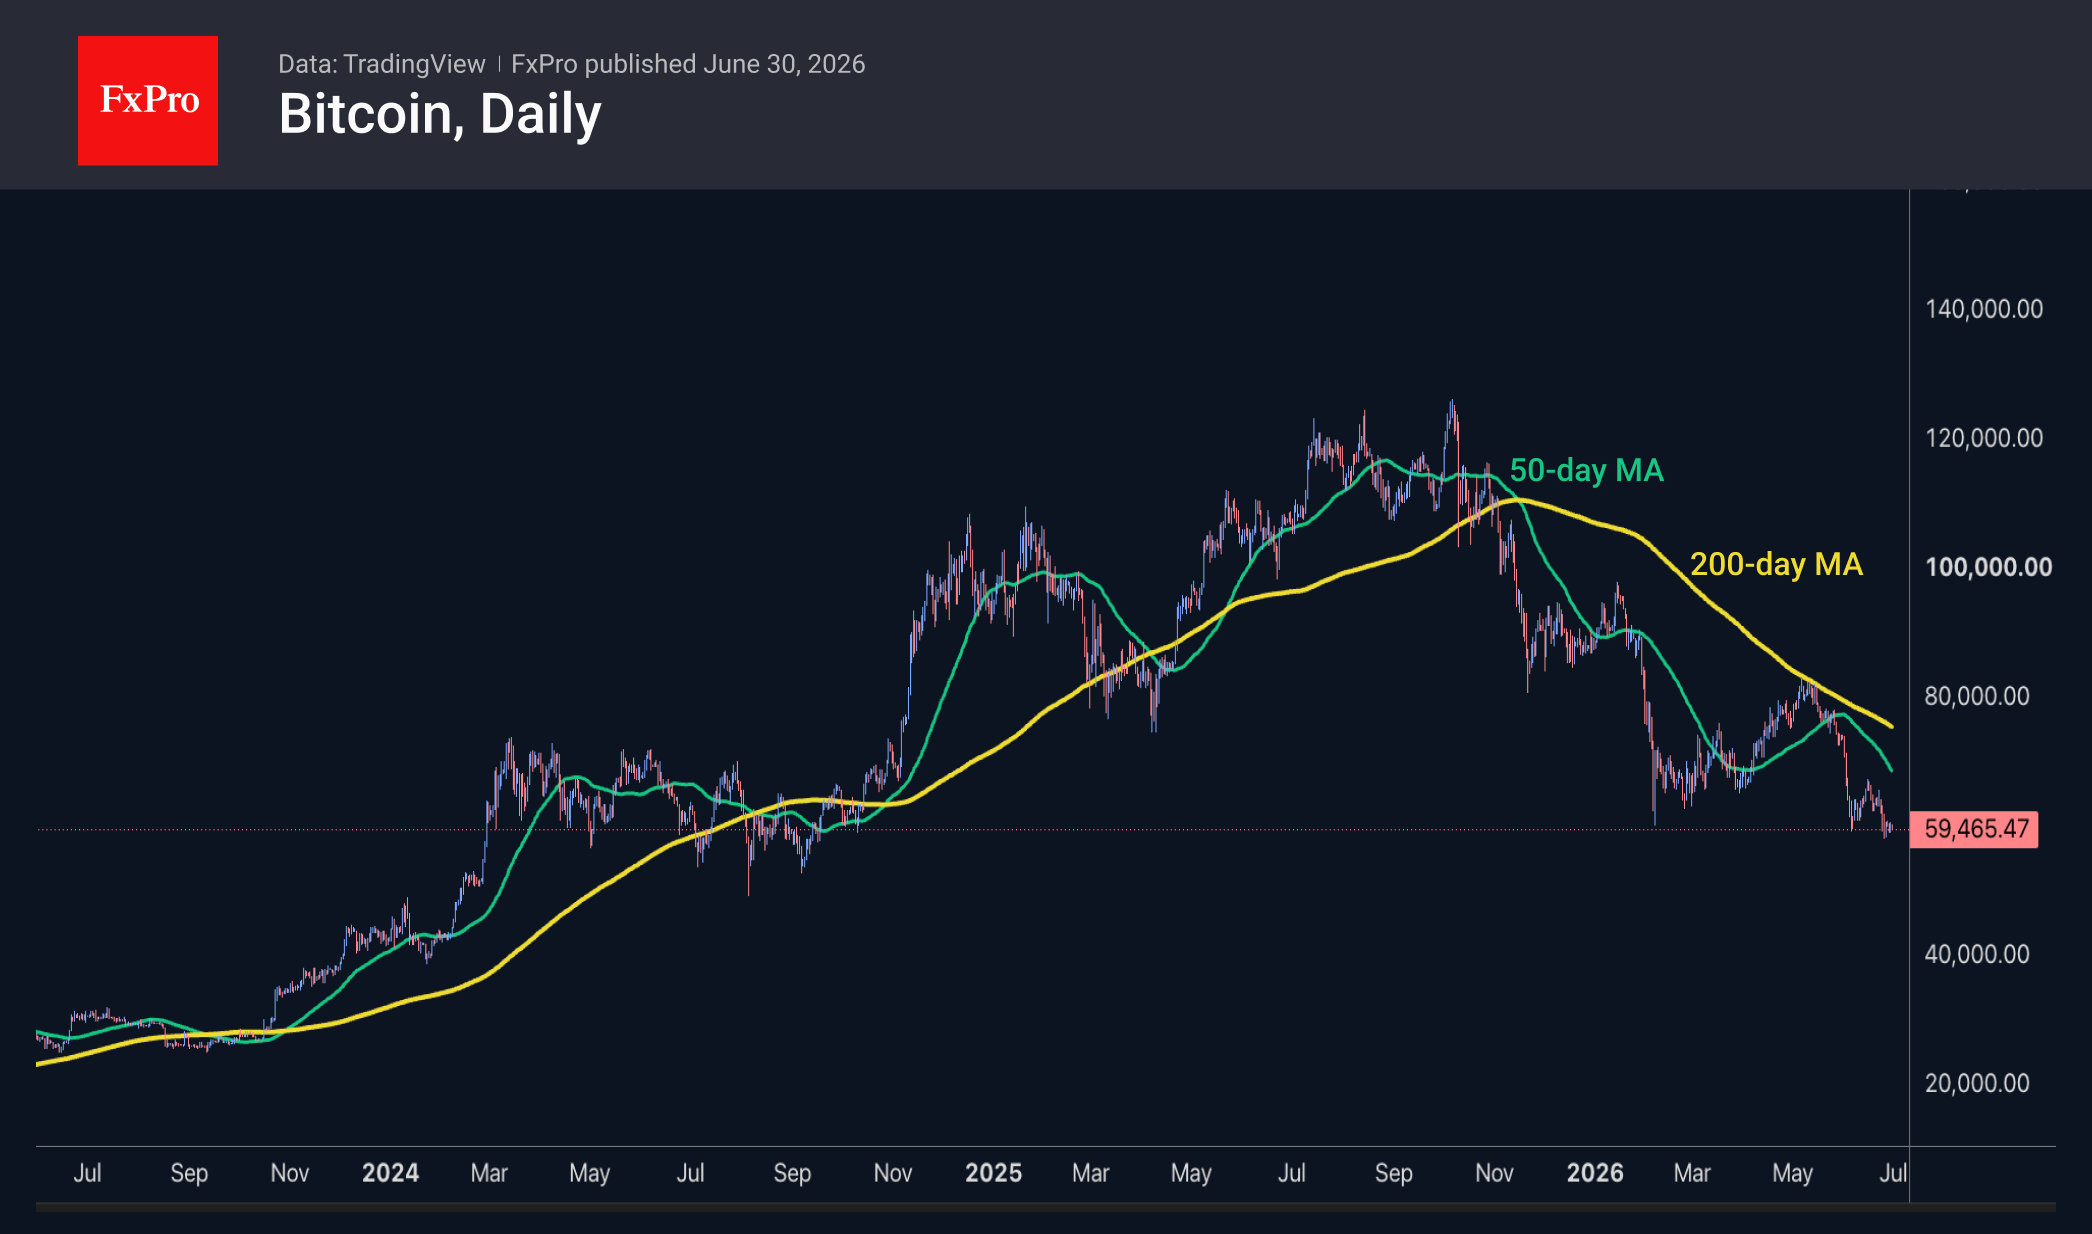
Bitcoin has been trading predominantly within a narrow range of $59K-$60K for the fifth consecutive day. This is a rather dangerous consolidation for the bulls, as it is taking place below previous local lows, from which the price rebounded in February and June. The leading cryptocurrency underwent a similar consolidation from March to October 2024, stuck in the $55–70K range with brief breakouts. But that was a consolidation in a rising market, whereas this one is in a falling market, given the direction of the 200- and 50-day moving averages and their position relative to the price. If we are indeed seeing a step-by-step decline, the next step could be the $40K mark.
News Background
On-chain data points to the start of a phase of capitulation among holders of the leading cryptocurrency, notes analyst Darkfost. Such periods have always proved profitable for long-term investors who began accumulating the asset then.
At the end of last week, Strategy’s preferred shares (STRC) hit an all-time low of around $71. Ordinary shares (MSTR) slumped by 25% over the week, falling to their lowest level since February 2024.
The share price decline intensified after the Rosen Law Firm announced it would launch a formal investigation into possible breaches of securities laws by Strategy. The lawyers intend to seek evidence of market manipulation and of misleading market participants regarding the true sustainability of Strategy’s assets.
The premium on Bitcoin reserves was a central part of Strategy’s business model. Whilst the shares were trading significantly above the book value of the BTC on the balance sheet, the company was able to issue new shares, purchase Bitcoin and increase its per-share ratio.
Strategy’s board of directors has authorised the company’s management to sell any amount of cryptocurrency from the reserves at any time. Previously, a separate board resolution was required for each sale. The board of directors expects that proceeds from the sale of bitcoins could reach $1.25 billion.
The FxPro Analyst Team
Gold Declines: Fed Policy and Geopolitics Weigh
Gold prices fell below 4,000 USD per troy ounce on Tuesday, reaching their lowest level in nearly eight months. The precious metal remains under pressure amid expectations of further Federal Reserve tightening and ongoing uncertainty over the Middle East situation.
Since the start of June, gold has lost more than 12%, with quarterly losses estimated at approximately 15%. Markets continue to price in three Fed rate hikes for the remainder of the year, with the first potentially coming in September.
Investors are now turning their attention to the upcoming US labour market report, which could shape expectations for the Fed's next policy steps.
An additional layer of uncertainty comes from US–Iran negotiations, which are set to resume today in Doha. Despite ongoing diplomatic contacts, the prospects for a long-term settlement remain limited, with control over shipping in the Strait of Hormuz remaining a key sticking point.
Technical Analysis
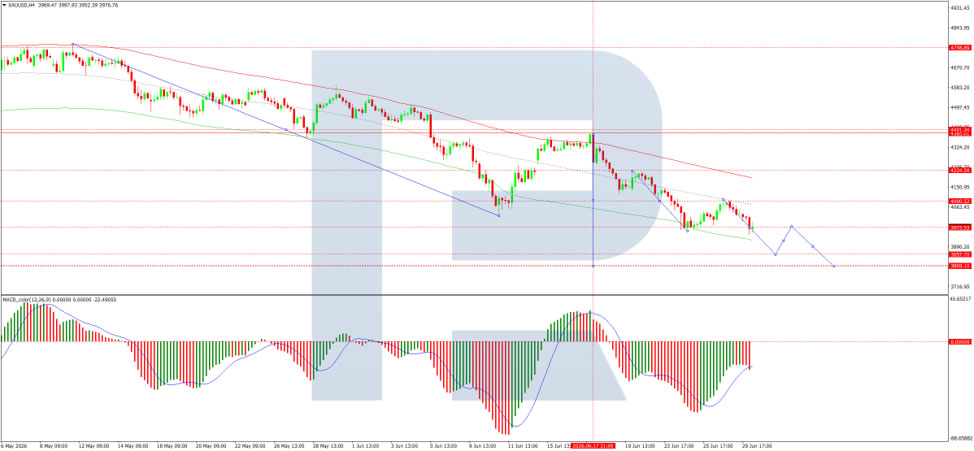
On the H4 XAU/USD chart, the market is trading within a consolidation range around the 4,017 USD level and has declined to 3,940 USD. A corrective move towards 4,016 USD (a test from below) is expected, followed by a potential decline to 3,885 USD, with scope for a further move to 3,810 USD. The MACD indicator confirms the current downside momentum, with its signal line below the centre line and pointing firmly downwards.
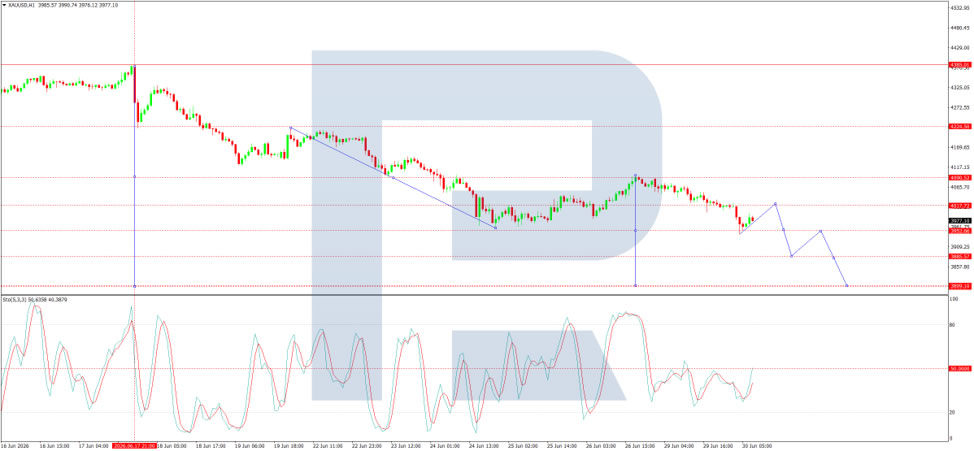
On the H1 chart, the market broke below the 4,017 USD level and moved lower to 3,940 USD. A corrective rebound towards 4,016 USD (a test from below) may follow before a further decline to 3,885 USD, with scope for an extension to 3,810 USD. The Stochastic oscillator supports this scenario, with its signal line below 50 and pointing downwards towards 20, indicating continued downside pressure.
Conclusion
Gold has fallen below 4,000 USD for the first time in nearly eight months, extending its losses amid expectations of further Fed tightening and persistent geopolitical uncertainty. Markets are pricing in three rate hikes for the rest of the year, with the first likely in September, while US–Iran negotiations in Doha offer limited prospects for a breakthrough given deep disagreements over shipping control in the Strait of Hormuz. Gold has now lost more than 12% since the start of June, with quarterly losses approaching 15%. Technical indicators point lower, suggesting further downside towards 3,885 USD and potentially 3,810 USD in the near term.