

Sample Category Title
EUR/AUD Weekly Outlook
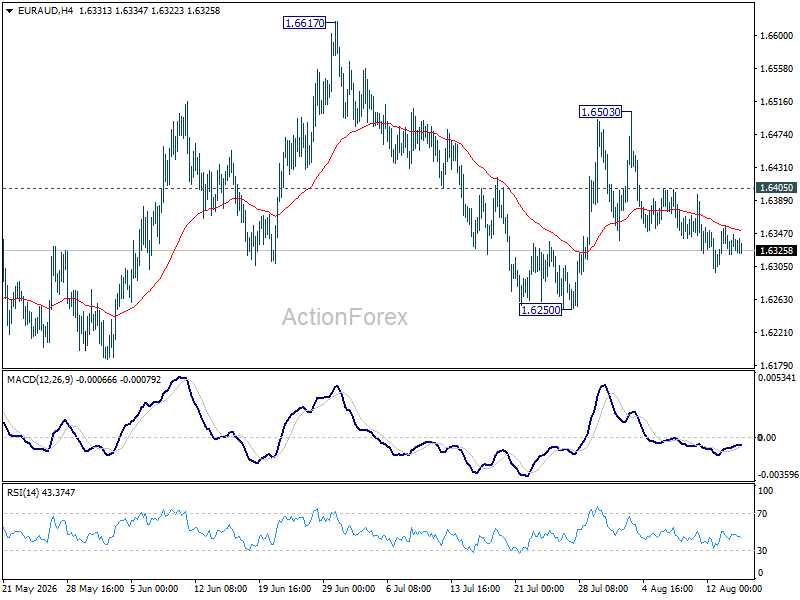
Overall outlook in EUR/AUD is unchanged as corrective pattern from 1.6108 (or 1.6125) is still extending. Initial bias stays neutral this week first. on the upside, above 1.6405 minor resistance will turn bias to the upside for 1.6503 resistance. On the downside, break of 1.6250 will bring deeper fall back to retest 1.6108 low.
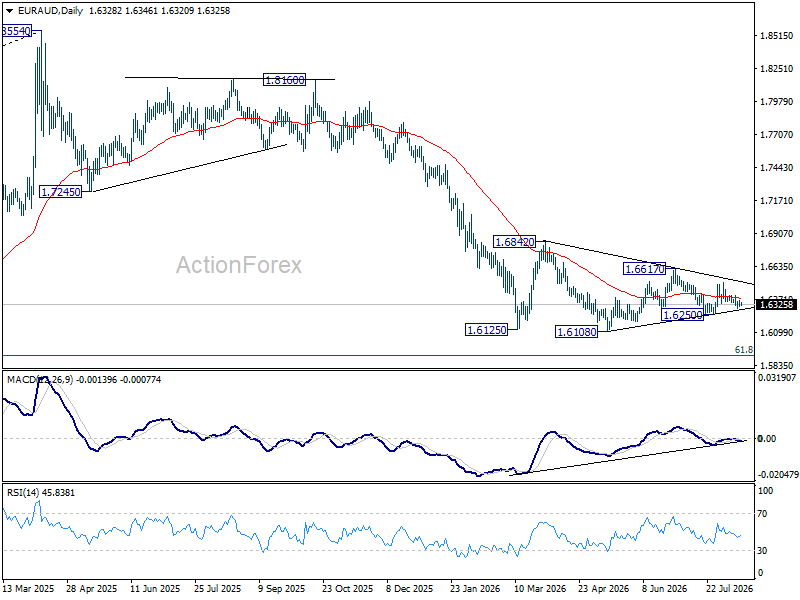
In the bigger picture, outlook will stay bearish as long as 1.6842 resistance holds. Fall from 1.8554 (2025 high) is expected to continue to 61.8% retracement of 1.4281 to 1.8554 at 1.5913. Decisive break there will pave the way back to 1.4281 (2022 low). However, firm break of 1.6842 should confirm medium term bottoming, and bring stronger rally.
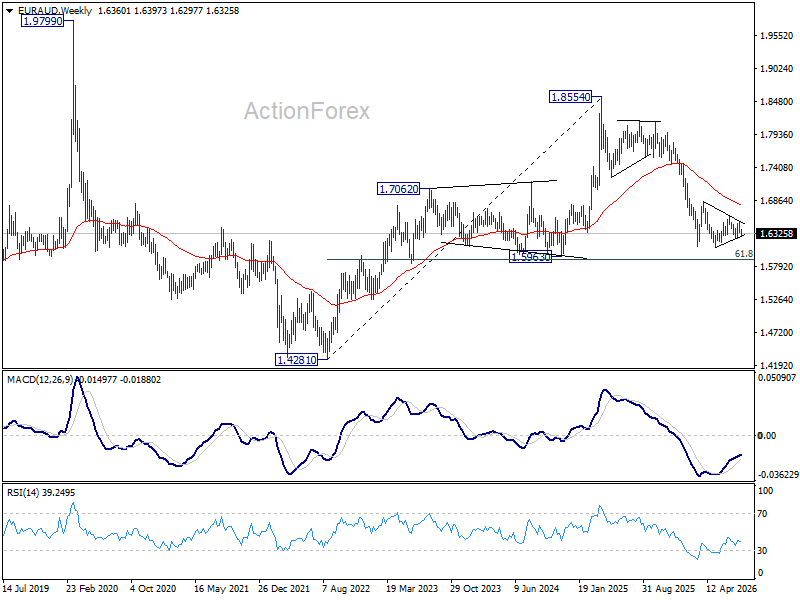
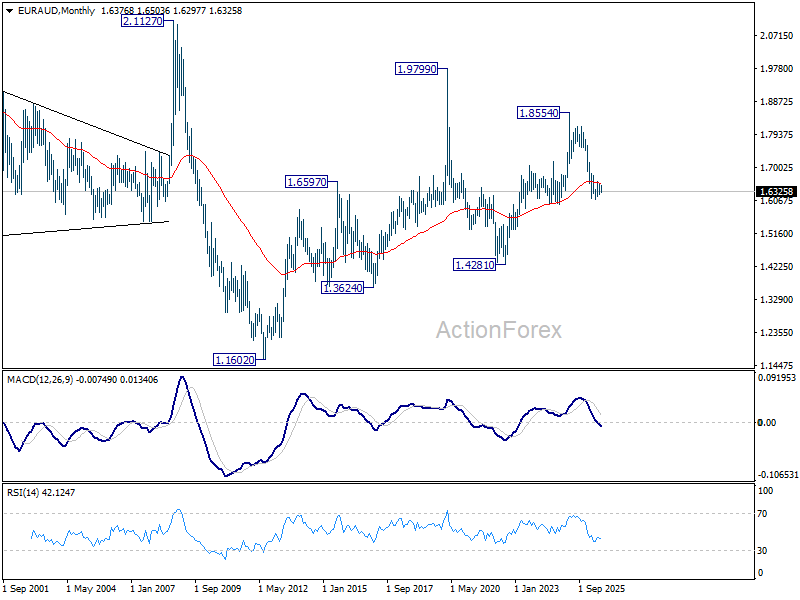
In the longer term picture, fall from 1.8554 is seen as the third leg of the pattern from 1.9799 (2020 high), which is part of the pattern from 2.1127 (2008 high). Sustained trading below 55 M EMA (now at 1.6567) will confirm this bearish case, and pave the way back towards 1.4281.
EUR/CHF Weekly Outlook
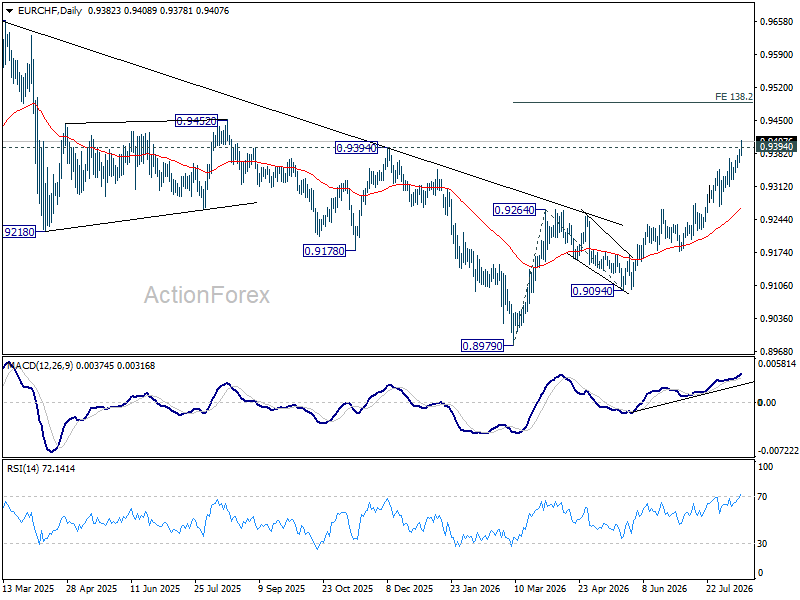
EUR/CHF's rally from 0.8979 continued last week and surged through 0.9394 key resistance. Initial bias stays on the upside this week. Next target is 138.2% projection of 0.8979 to 0.9264 from 0.9094 at 0.9488. On the downside, below 0.9362 minor support will turn bias neutral and bring consolidations first, before staging another rise.
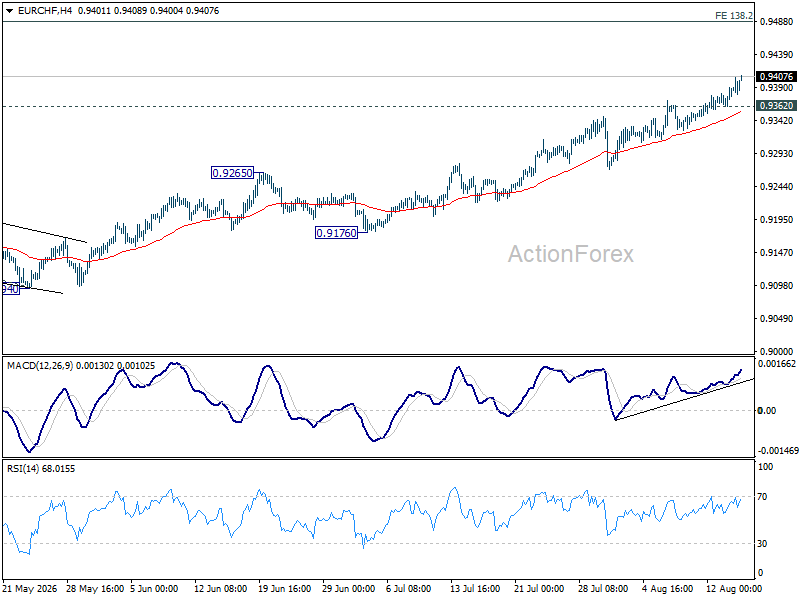
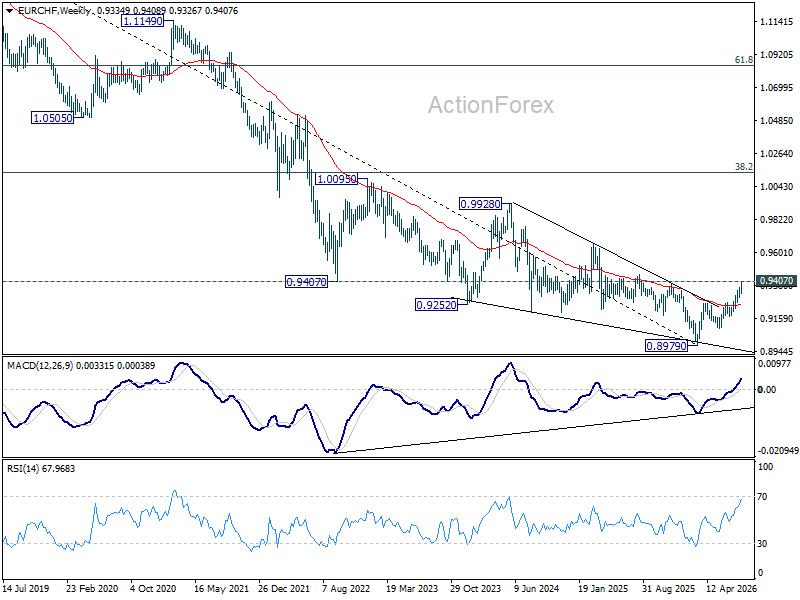
In the bigger picture, the break of 0.9394 resistance solidify the case that rise from 0.8979 medium term is at least reversing the fall from 0.9928 (2024 high), with prospect of developing into a medium term up trend. Further rally should be seen to 0.9660 resistance next. This will remain the favored case as long as 0.9264 resistance turned support holds, in case of pullbacks.
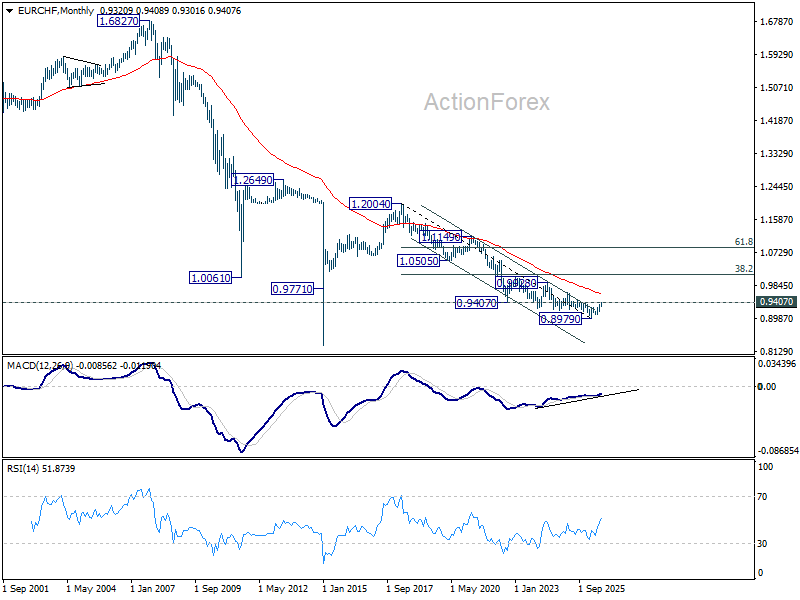
In the long term picture, focus is now on 0.9407 support turned resistance (2022 low). Sustained break there will argue that the down trend from 1.2004 (2018 high) has completed with five waves down to 0.8979. Stronger rebound should then be seen to 38.2% retracement of 1.2004 to 0.8979 at 1.0135 in the medium term.
Economics Week Ahead
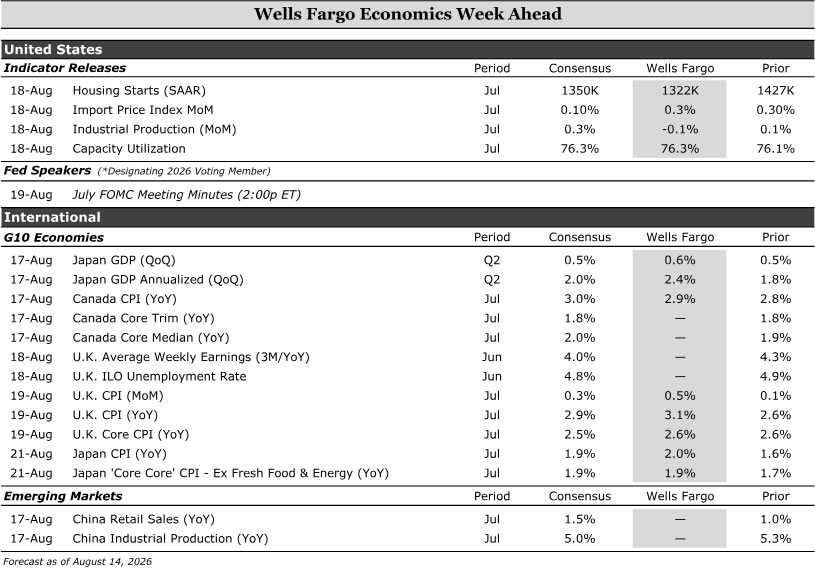
Next week is lighter on the domestic data front, with focus on Wednesday's FOMC minutes, which will likely reiterate that most policymakers remain patient on adjusting rates, a posture validated by softer labor market and inflation data since the July meeting. On Tuesday, July housing starts are expected to edge lower, reflecting ongoing pressure from weak affordability and a challenging environment for builders.
Abroad, Japan's GDP and CPI reports should reinforce the case for further BoJ normalization, while Canadian inflation is expected to remain contained enough to keep the Bank of Canada on hold. In the U.K., softer labor market conditions may be offset by firmer inflation, leaving the door open to additional BoE tightening later this year. Meanwhile, China's July retail and industrial activity data will likely show further loss of momentum at the start of Q3.
- United States: Housing Starts (Tuesday), FOMC Meeting Minutes (Wednesday)
- Advanced Economies: Japan GDP & CPI (Monday & Friday), Canada CPI (Monday), UK Labor Force Survey & CPI (Tuesday & Wednesday)
- Emerging Markets: China Retail Sales & Industrial Production (Monday)
Source: Bloomberg Finance L.P. and Wells Fargo Economics
U.S. Week Ahead
Housing Starts • Tuesday
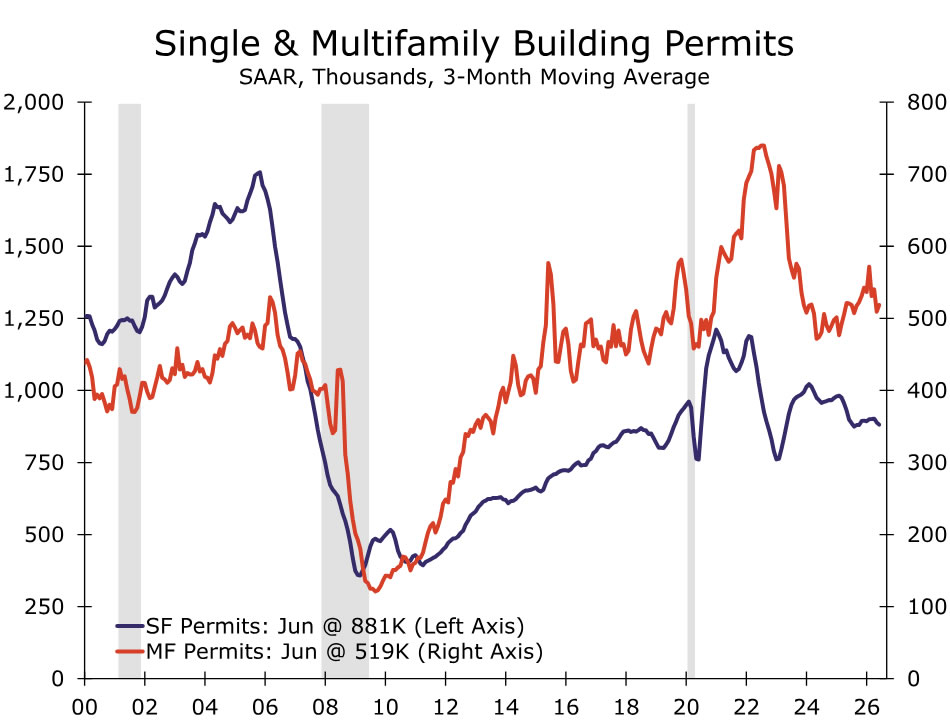
Residential construction looks set to continue scaling back. In June, starts surprised to the upside, rebounding from the prior month decline and largely reflecting a substantial rebound in the volatile multifamily category. However, the trend in housing construction has been hardly energetic. Over the past several months, single family starts generally have grinded lower. Multifamily starts have been relatively more resilient, but lacking upward momentum.
It's difficult to see a catalyst for stronger growth on the near-term horizon. Forward-looking indicators such as building permits and builder confidence suggest activity remains tepid. Meanwhile, higher mortgage rates continue to exert pressure on affordability for buyers, who are also contending with a lackluster jobs market and slowing real income growth. Builders are navigating their own challenges, including higher construction costs, skilled labor shortages and elevated inventory relative to sales. In terms of multifamily, the apartment market is showing signs of improvement. However, vacancy rates remain elevated, largely due to still-elevated new supply. All told, we expect total housing starts to decline to a 1322K-unit pace in July.
Source: U.S. Department of Commerce and Wells Fargo Economics
FOMC Minutes • Wednesday
We expect next week's FOMC minutes to reiterate that most Committee members are willing to be patient for now when it comes to further progress on inflation, but the bar is low for future rate hikes if inflation does not slow further. This has been the general theme among the Fed speakers who we believe are the swing votes on the Committee right now (Williams, Waller, Jefferson, Paulson, etc.), and the minutes from the June meeting signaled a low bar to hiking (we touched on this in a Daily at the time). We will be looking for any concrete guideposts that the FOMC has set that would trigger a rate hike this fall, whether that be the pace of inflation, its composition, the forward-looking outlook, etc.
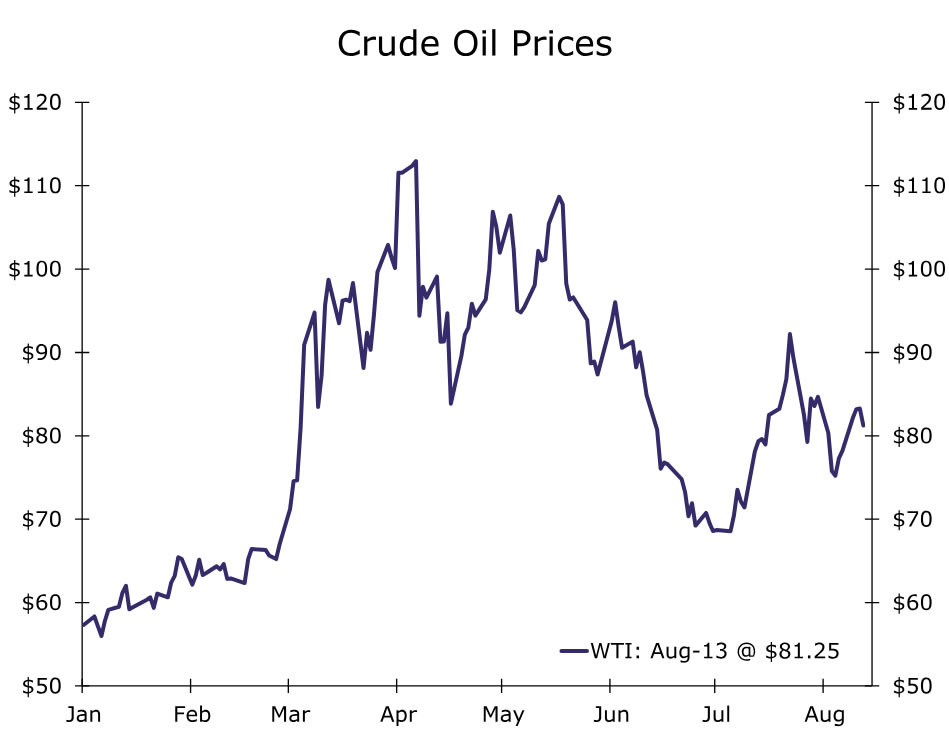
Since the July FOMC meeting, the latest employment report came in soft, with weak job growth and a further slowdown in wage growth, while the July inflation data provided further evidence that the boost to inflation from tariffs/energy/AI has peaked. As we go to print, the outlook for normalized traffic through the Strait of Hormuz remains as cloudy as ever, but oil prices are roughly unchanged since the FOMC last met. Accordingly, the minutes are probably a bit dated, and we suspect the median Committee participant is feeling slightly more dovish than they were at the time of the last meeting. Given that, why hike? Next month's employment and inflation data will go a long way toward deciding the September FOMC meeting, but the path is clearly there for policymakers to once again leave the fed funds rate unchanged.
Source: Bloomberg Finance L.P. and Wells Fargo Economics
G10 Week Ahead
Japan GDP & CPI • Monday & Friday
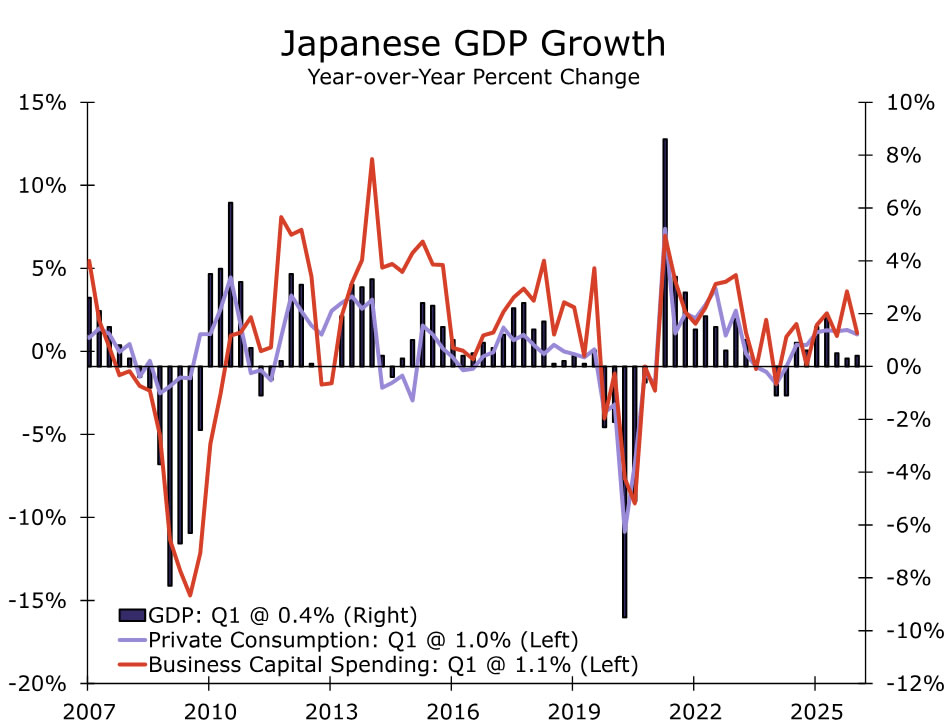
Japan's Q2 GDP and July CPI reports are due next week and should support the case for further Bank of Japan (BoJ) tightening. We expect GDP to grow 0.6% quarter over quarter, or 2.4% on an annualized basis, as improving business activity and continued AI-related demand support investment. Machine tool orders have also strengthened, particularly due to stronger foreign demand. However, household consumption likely remained subdued despite stronger real wages. Higher oil prices likely weighed on net trade, though strong global demand for AI-related goods should have limited the drag.
We expect headline CPI to rise to 2.0% year over year in July, while 'Core Core' inflation (excluding fresh food and energy) increases to 1.9%. This expected pickup follows a similar increase in Tokyo CPI, which typically provides an early indication of nationwide price trends.
The stronger GDP growth and firmer inflation should give the BoJ further confidence to continue normalizing policy. Against this backdrop, we expect the central bank to raise its policy rate to 1.25% in Q4.
Source: Bloomberg Finance L.P. and Wells Fargo Economics
Canada CPI • Monday
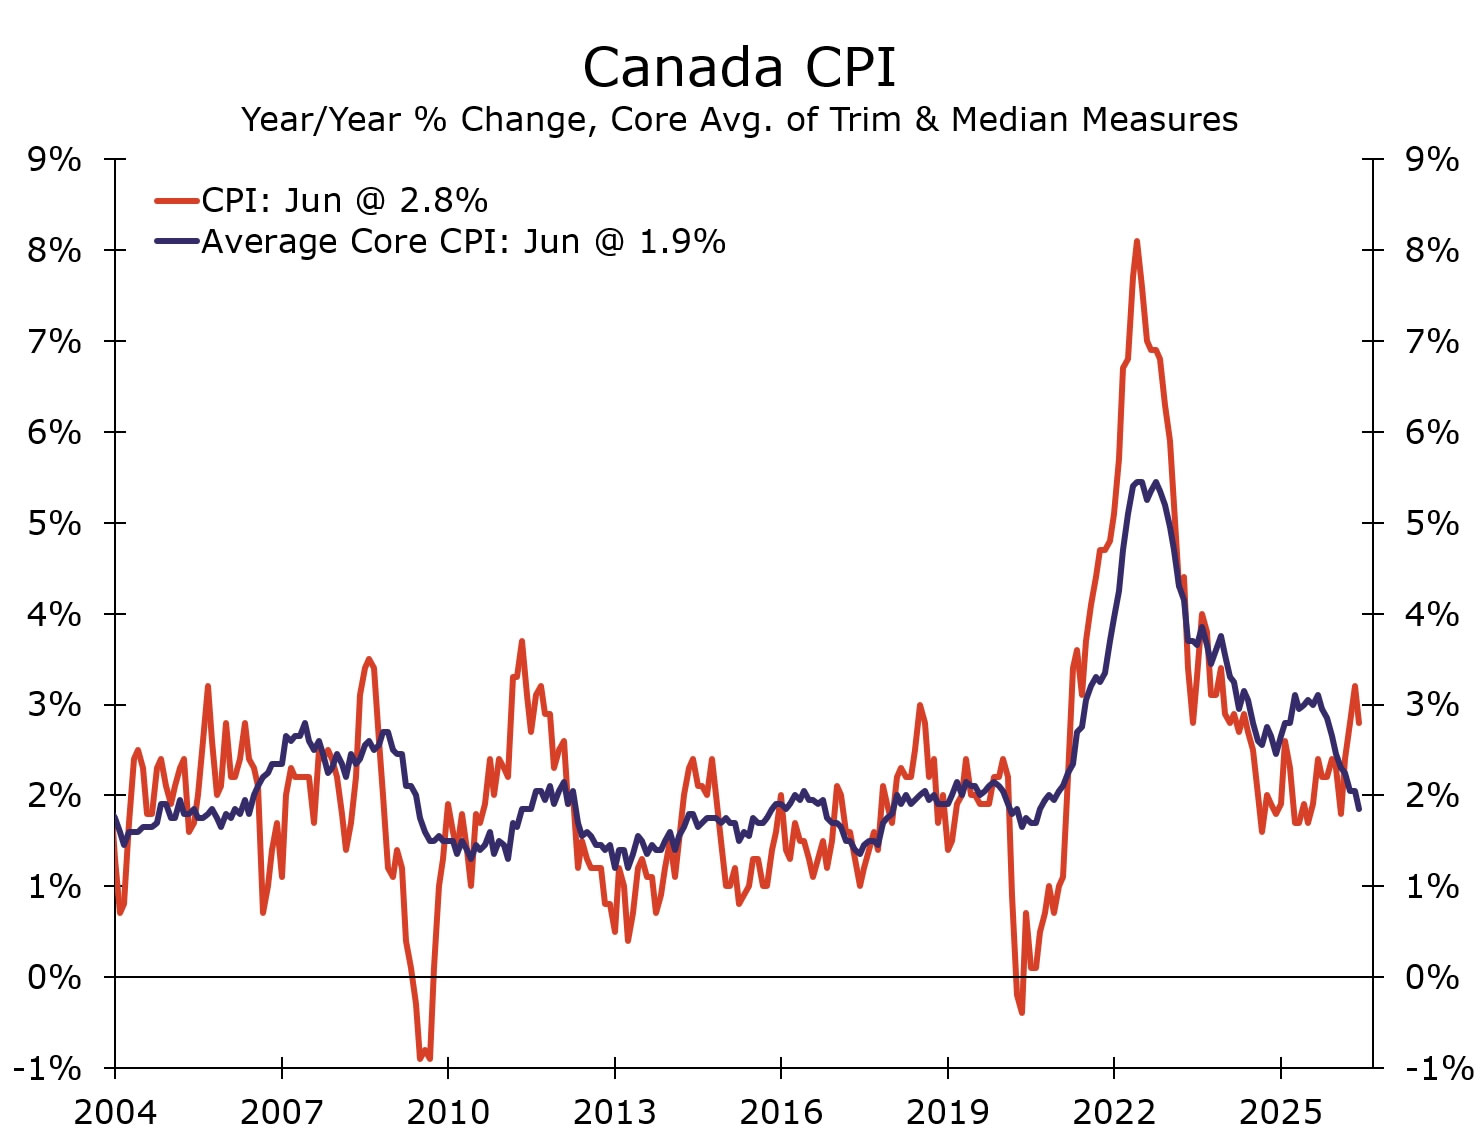
Canadian inflation pressures remain well contained, with the recent inflation flare-up in Canada continuing to look more like an energy story than a broadening inflation problem. June CPI brought headline inflation back down to 2.8% from 3.2% in May, while an average of the trim and median core measures slipped below 2% for the first time in several years. More importantly, there remains little evidence that higher energy costs are feeding through into broader price pressures. Inflation breadth has improved, consumer expectations remain reasonably well anchored and a still-modest pace of domestic demand suggests the backdrop remains supportive of contained underlying inflation.
We expect headline CPI to edge up modestly to 2.9% in July as gasoline prices recover some of June's sharp decline. But underlying trends should remain largely unchanged, with core measures continuing to run near-2%. As such, we expect the Bank of Canada to continue looking through energy-driven price fluctuations in headline inflation and place greater weight on the still-benign trend in underlying price pressure, leaving it on hold in the near term.
Source: Bloomberg Finance L.P. and Wells Fargo Economics
UK Labor Force Survey & CPI • Tuesday & Wednesday
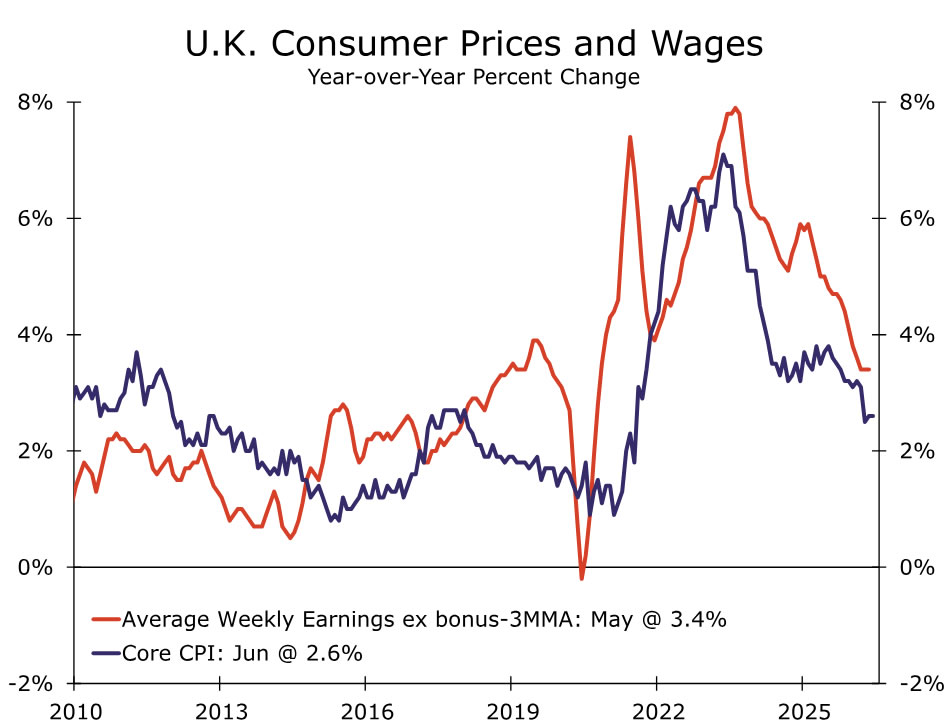
The U.K.'s labor force survey and inflation data are due next week and should present a mixed picture for the Bank of England (BoE). Labor market conditions likely remained subdued, while pay growth should ease further, although strength in public sector wages may limit the slowdown.
We expect headline CPI to rise to 3.1% year over year and 0.5% month over month in July from 2.6% year over year in June, largely due to the 13% increase in the Ofgem energy price cap. Lower petrol prices and further food disinflation should provide a partial offset. We expect core inflation to remain at 2.6% year over year, while services inflation stays elevated at 3.5%.
Stronger-than-expected H1 2026 GDP growth despite headwinds from the Middle East conflict, alongside the expected pickup in headline inflation and elevated services inflation should keep policy restrictive. Further pressure from food and energy costs could also raise inflation expectations and increase the risk of second-round effects. Against this backdrop, we continue to see a rate hike as possible later this year.
Source: Bloomberg Finance L.P. and Wells Fargo Economics
EM Week Ahead
China Retail Sales & Industrial Production • Monday
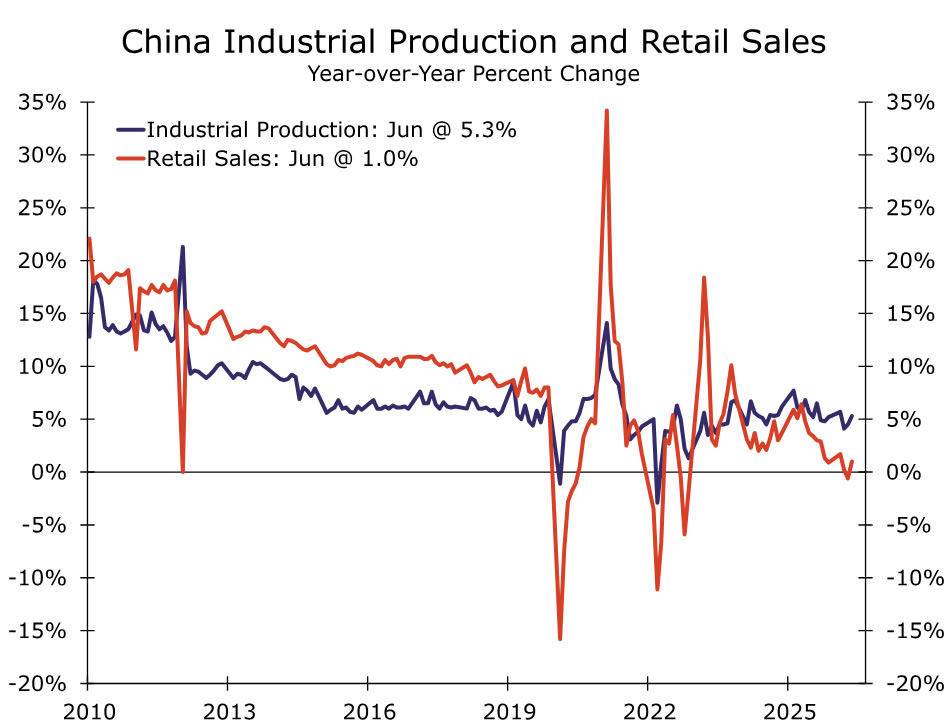
Next week's economic activity indicators should provide further evidence that China's growth lost momentum at the start of the third quarter. Consensus expectations are for industrial production to slow to 5.0% year over year from 5.3% in June, while retail sales to rise to 1.5% from 1.0%. However, July's official PMIs point to weaker momentum across the economy. The manufacturing PMIs fell to 49.2 from 50.3, while the nonmanufacturing PMIs declined to 49.0 from 50.2. This suggests to us that both industrial production and retail sales could lose momentum. The weaker survey data follow a slowdown in Q2 GDP, as consumption and investment growth moderated and net exports provided little support. The Middle East conflict has had a limited effect on domestic activity so far, though higher producer prices remain a concern.
Authorities have pledged to accelerate fiscal spending on previously announced infrastructure projects through the rest of the year. However, weak consumer demand, subdued inflation and persistent structural imbalances are likely to limit the recovery. We continue to expect China's GDP growth to slow to 4.5% in 2026 and 4.3% in 2027.
Source: Bloomberg Finance L.P. and Wells Fargo Economics
Summary 8/17 – 8/21
Monday, Aug 17, 2026
| GMT | Ccy | Events | Cons | Prev |
|---|---|---|---|---|
| 22:30 | NZD | BusinessNZ PSI Jul | 50.6 | |
| 23:50 | JPY | GDP Q/Q Q2 P | 0.50% | 0.50% |
| 23:50 | JPY | GDP Deflator Y/Y Q2 P | 2.40% | 3.20% |
| 04:30 | JPY | Tertiary Industry Index M/M Jun | -0.90% | 1.10% |
| 04:30 | JPY | Industrial Production M/M Jun F | 1.30% | 1.30% |
| 07:00 | CNY | Industrial Production Y/Y Jul | 4.80% | 5.30% |
| 07:00 | CNY | Retail Sales Y/Y Jul | 1.60% | 1.00% |
| 07:00 | CNY | Fixed Asset Investment YTD Y/Y Jul | -6.00% | -5.70% |
| 12:30 | CAD | CPI M/M Jul | 0.40% | -0.40% |
| 12:30 | CAD | CPI Y/Y Jul | 2.90% | 2.80% |
| 12:30 | CAD | CPI Median Y/Y Jul | 2.00% | 1.90% |
| 12:30 | CAD | CPI Trimmed Y/Y Jul | 1.80% | 1.80% |
| 12:30 | CAD | CPI Common Y/Y Jul | 2.50% | 2.60% |
| 12:30 | USD | Empire State Manufacturing Aug | 10.2 | 15.6 |
| 14:00 | USD | NAHB Housing Market Index Aug | 33 | 34 |
| 22:30 | NZD |
| BusinessNZ PSI Jul | |
| Consensus | |
| Previous | 50.6 |
| 23:50 | JPY |
| GDP Q/Q Q2 P | |
| Consensus | 0.50% |
| Previous | 0.50% |
| 23:50 | JPY |
| GDP Deflator Y/Y Q2 P | |
| Consensus | 2.40% |
| Previous | 3.20% |
| 04:30 | JPY |
| Tertiary Industry Index M/M Jun | |
| Consensus | -0.90% |
| Previous | 1.10% |
| 04:30 | JPY |
| Industrial Production M/M Jun F | |
| Consensus | 1.30% |
| Previous | 1.30% |
| 07:00 | CNY |
| Industrial Production Y/Y Jul | |
| Consensus | 4.80% |
| Previous | 5.30% |
| 07:00 | CNY |
| Retail Sales Y/Y Jul | |
| Consensus | 1.60% |
| Previous | 1.00% |
| 07:00 | CNY |
| Fixed Asset Investment YTD Y/Y Jul | |
| Consensus | -6.00% |
| Previous | -5.70% |
| 12:30 | CAD |
| CPI M/M Jul | |
| Consensus | 0.40% |
| Previous | -0.40% |
| 12:30 | CAD |
| CPI Y/Y Jul | |
| Consensus | 2.90% |
| Previous | 2.80% |
| 12:30 | CAD |
| CPI Median Y/Y Jul | |
| Consensus | 2.00% |
| Previous | 1.90% |
| 12:30 | CAD |
| CPI Trimmed Y/Y Jul | |
| Consensus | 1.80% |
| Previous | 1.80% |
| 12:30 | CAD |
| CPI Common Y/Y Jul | |
| Consensus | 2.50% |
| Previous | 2.60% |
| 12:30 | USD |
| Empire State Manufacturing Aug | |
| Consensus | 10.2 |
| Previous | 15.6 |
| 14:00 | USD |
| NAHB Housing Market Index Aug | |
| Consensus | 33 |
| Previous | 34 |
Tuesday, Aug 18, 2026
| GMT | Ccy | Events | Cons | Prev |
|---|---|---|---|---|
| 00:30 | AUD | Westpac Consumer Confidence Aug | 4.10% | |
| 06:00 | GBP | Claimant Count Change Jul | 16.5K | 6.7K |
| 06:00 | GBP | ILO Unemployment Rate (3M) Jun | 4.80% | 4.90% |
| 06:00 | GBP | Average Earnings Excluding Bonus 3M/Y Jun | 3.40% | 3.40% |
| 06:00 | GBP | Average Earnings Including Bonus 3M/Y Jun | 4.10% | 4.30% |
| 09:00 | EUR | Germany ZEW Economic Sentiment Aug | 30.1 | 26.3 |
| 09:00 | EUR | Germany ZEW Current Situation Aug | -68.8 | -77.6 |
| 09:00 | EUR | Eurozone ZEW Economic Sentiment Aug | 25 | 23.4 |
| 12:30 | USD | Building Permits Jul | 1.37M | 1.37M |
| 12:30 | USD | Housing Starts Jul | 1.34M | 1.43M |
| 12:30 | USD | Import Price Index M/M Jul | 0.40% | 0.30% |
| 13:15 | USD | Industrial Production M/M Jul | 0.30% | 0.10% |
| 13:15 | USD | Capacity Utilization Jul | 76.30% | 76.10% |
| 14:00 | USD | Pending Home Sales M/M Jul | 1.50% | -5.40% |
| 00:30 | AUD |
| Westpac Consumer Confidence Aug | |
| Consensus | |
| Previous | 4.10% |
| 06:00 | GBP |
| Claimant Count Change Jul | |
| Consensus | 16.5K |
| Previous | 6.7K |
| 06:00 | GBP |
| ILO Unemployment Rate (3M) Jun | |
| Consensus | 4.80% |
| Previous | 4.90% |
| 06:00 | GBP |
| Average Earnings Excluding Bonus 3M/Y Jun | |
| Consensus | 3.40% |
| Previous | 3.40% |
| 06:00 | GBP |
| Average Earnings Including Bonus 3M/Y Jun | |
| Consensus | 4.10% |
| Previous | 4.30% |
| 09:00 | EUR |
| Germany ZEW Economic Sentiment Aug | |
| Consensus | 30.1 |
| Previous | 26.3 |
| 09:00 | EUR |
| Germany ZEW Current Situation Aug | |
| Consensus | -68.8 |
| Previous | -77.6 |
| 09:00 | EUR |
| Eurozone ZEW Economic Sentiment Aug | |
| Consensus | 25 |
| Previous | 23.4 |
| 12:30 | USD |
| Building Permits Jul | |
| Consensus | 1.37M |
| Previous | 1.37M |
| 12:30 | USD |
| Housing Starts Jul | |
| Consensus | 1.34M |
| Previous | 1.43M |
| 12:30 | USD |
| Import Price Index M/M Jul | |
| Consensus | 0.40% |
| Previous | 0.30% |
| 13:15 | USD |
| Industrial Production M/M Jul | |
| Consensus | 0.30% |
| Previous | 0.10% |
| 13:15 | USD |
| Capacity Utilization Jul | |
| Consensus | 76.30% |
| Previous | 76.10% |
| 14:00 | USD |
| Pending Home Sales M/M Jul | |
| Consensus | 1.50% |
| Previous | -5.40% |
Wednesday, Aug 19, 2026
| GMT | Ccy | Events | Cons | Prev |
|---|---|---|---|---|
| 22:45 | NZD | PPI Input Q/Q Q2 | 1.30% | 1.40% |
| 22:45 | NZD | PPI Output Q/Q Q2 | 0.80% | 0.80% |
| 23:50 | JPY | Machinery Orders M/M Jun | 7.80% | -12.40% |
| 01:30 | AUD | Wage Price Index Q/Q Q2 | 0.80% | 0.80% |
| 06:00 | GBP | CPI M/M Jul | 0.30% | 0.10% |
| 06:00 | GBP | CPI Y/Y Jul | 2.90% | 2.60% |
| 06:00 | GBP | Core CPI Y/Y Jul | 2.50% | 2.60% |
| 06:00 | GBP | RPI M/M Jul | 0.30% | |
| 06:00 | GBP | RPI Y/Y Jul | 3.00% | |
| 06:00 | GBP | PPI Input M/M Jul | 0.00% | -2.00% |
| 06:00 | GBP | PPI Input Y/Y Jul | 6.60% | 7.30% |
| 06:00 | GBP | PPI Output M/M Jul | 0.20% | 0.00% |
| 06:00 | GBP | PPI Output Y/Y Jul | 3.20% | 3.50% |
| 06:00 | GBP | PPI Core Output M/M Jul | 0.50% | |
| 06:00 | GBP | PPI Core Output Y/Y Jul | 2.60% | |
| 08:00 | EUR | Eurozone Current Account (EUR) Jun | 26.8B | 25.1B |
| 09:00 | EUR | Eurozone CPI Y/Y Jul F | 2.90% | 2.90% |
| 09:00 | EUR | Eurozone Core CPI Y/Y Jul F | 2.50% | 2.50% |
| 14:30 | USD | Crude Oil Inventories (Aug 14) | 0.2M | 17.4M |
| 18:00 | USD | FOMC Minutes |
| 22:45 | NZD |
| PPI Input Q/Q Q2 | |
| Consensus | 1.30% |
| Previous | 1.40% |
| 22:45 | NZD |
| PPI Output Q/Q Q2 | |
| Consensus | 0.80% |
| Previous | 0.80% |
| 23:50 | JPY |
| Machinery Orders M/M Jun | |
| Consensus | 7.80% |
| Previous | -12.40% |
| 01:30 | AUD |
| Wage Price Index Q/Q Q2 | |
| Consensus | 0.80% |
| Previous | 0.80% |
| 06:00 | GBP |
| CPI M/M Jul | |
| Consensus | 0.30% |
| Previous | 0.10% |
| 06:00 | GBP |
| CPI Y/Y Jul | |
| Consensus | 2.90% |
| Previous | 2.60% |
| 06:00 | GBP |
| Core CPI Y/Y Jul | |
| Consensus | 2.50% |
| Previous | 2.60% |
| 06:00 | GBP |
| RPI M/M Jul | |
| Consensus | |
| Previous | 0.30% |
| 06:00 | GBP |
| RPI Y/Y Jul | |
| Consensus | |
| Previous | 3.00% |
| 06:00 | GBP |
| PPI Input M/M Jul | |
| Consensus | 0.00% |
| Previous | -2.00% |
| 06:00 | GBP |
| PPI Input Y/Y Jul | |
| Consensus | 6.60% |
| Previous | 7.30% |
| 06:00 | GBP |
| PPI Output M/M Jul | |
| Consensus | 0.20% |
| Previous | 0.00% |
| 06:00 | GBP |
| PPI Output Y/Y Jul | |
| Consensus | 3.20% |
| Previous | 3.50% |
| 06:00 | GBP |
| PPI Core Output M/M Jul | |
| Consensus | |
| Previous | 0.50% |
| 06:00 | GBP |
| PPI Core Output Y/Y Jul | |
| Consensus | |
| Previous | 2.60% |
| 08:00 | EUR |
| Eurozone Current Account (EUR) Jun | |
| Consensus | 26.8B |
| Previous | 25.1B |
| 09:00 | EUR |
| Eurozone CPI Y/Y Jul F | |
| Consensus | 2.90% |
| Previous | 2.90% |
| 09:00 | EUR |
| Eurozone Core CPI Y/Y Jul F | |
| Consensus | 2.50% |
| Previous | 2.50% |
| 14:30 | USD |
| Crude Oil Inventories (Aug 14) | |
| Consensus | 0.2M |
| Previous | 17.4M |
| 18:00 | USD |
| FOMC Minutes | |
| Consensus | |
| Previous | |
Thursday, Aug 20, 2026
| GMT | Ccy | Events | Cons | Prev |
|---|---|---|---|---|
| 23:50 | JPY | Trade Balance (JPY) Jul | -0.44T | -0.88T |
| 01:00 | AUD | Consumer Inflation Expectations Aug | 4.70% | |
| 01:00 | CNY | 1-Y Loan Prime Rate | 3.00% | 3.00% |
| 01:00 | CNY | 5-Y Loan Prime Rate | 3.50% | 3.50% |
| 01:30 | AUD | Employment Change Jul | 11.4K | 76.3K |
| 01:30 | AUD | Unemployment Rate Jul | 4.40% | 4.40% |
| 06:00 | EUR | Germany PPI M/M Jul | 0.50% | -0.30% |
| 06:00 | EUR | Germany PPI Y/Y Jul | 2.70% | 1.80% |
| 12:30 | CAD | New Housing Price Index M/M Jul | 0.00% | -0.10% |
| 12:30 | CAD | Industrial Product Price M/M Jul | -0.40% | -1.40% |
| 12:30 | CAD | Raw Material Price Index Jul | -1.80% | -6.90% |
| 12:30 | USD | Initial Jobless Claims (Aug 14) | 210K | 209K |
| 12:30 | USD | Philadelphia Fed Manufacturing Survey Aug | 24.3 | 41.4 |
| 14:30 | USD | Natural Gas Storage (Aug 14) | 15B | 36B |
| 23:50 | JPY |
| Trade Balance (JPY) Jul | |
| Consensus | -0.44T |
| Previous | -0.88T |
| 01:00 | AUD |
| Consumer Inflation Expectations Aug | |
| Consensus | |
| Previous | 4.70% |
| 01:00 | CNY |
| 1-Y Loan Prime Rate | |
| Consensus | 3.00% |
| Previous | 3.00% |
| 01:00 | CNY |
| 5-Y Loan Prime Rate | |
| Consensus | 3.50% |
| Previous | 3.50% |
| 01:30 | AUD |
| Employment Change Jul | |
| Consensus | 11.4K |
| Previous | 76.3K |
| 01:30 | AUD |
| Unemployment Rate Jul | |
| Consensus | 4.40% |
| Previous | 4.40% |
| 06:00 | EUR |
| Germany PPI M/M Jul | |
| Consensus | 0.50% |
| Previous | -0.30% |
| 06:00 | EUR |
| Germany PPI Y/Y Jul | |
| Consensus | 2.70% |
| Previous | 1.80% |
| 12:30 | CAD |
| New Housing Price Index M/M Jul | |
| Consensus | 0.00% |
| Previous | -0.10% |
| 12:30 | CAD |
| Industrial Product Price M/M Jul | |
| Consensus | -0.40% |
| Previous | -1.40% |
| 12:30 | CAD |
| Raw Material Price Index Jul | |
| Consensus | -1.80% |
| Previous | -6.90% |
| 12:30 | USD |
| Initial Jobless Claims (Aug 14) | |
| Consensus | 210K |
| Previous | 209K |
| 12:30 | USD |
| Philadelphia Fed Manufacturing Survey Aug | |
| Consensus | 24.3 |
| Previous | 41.4 |
| 14:30 | USD |
| Natural Gas Storage (Aug 14) | |
| Consensus | 15B |
| Previous | 36B |
Friday, Aug 21, 2026
| GMT | Ccy | Events | Cons | Prev |
|---|---|---|---|---|
| 22:45 | NZD | Trade Balance (NZD) Jul | -175M | 23M |
| 23:00 | AUD | Manufacturing PMI Aug P | 52 | |
| 23:00 | AUD | Services PMI Aug P | 53.6 | |
| 23:01 | GBP | GfK Consumer Confidence Aug | -18 | -17 |
| 23:30 | JPY | National CPI Y/Y Jul | 1.70% | |
| 23:30 | JPY | National CPI Core Y/Y Jul | 1.80% | 1.60% |
| 23:30 | JPY | National CPI Core-Core Y/Y Jul | 1.70% | |
| 00:30 | JPY | Manufacturing PMI Aug P | 55.1 | 54.5 |
| 00:30 | JPY | Services PMI Aug P | 51.2 | |
| 06:00 | GBP | Retail Sales M/M Jul | -0.50% | 1.00% |
| 06:00 | GBP | Retail Sales Y/Y Jul | 2.20% | 4.20% |
| 07:15 | EUR | France Manufacturing PMI Aug P | 50.1 | 49.8 |
| 07:15 | EUR | France Services PMI Aug P | 49.4 | 49.6 |
| 07:30 | EUR | Germany Manufacturing PMI Aug P | 52.1 | 52.2 |
| 07:30 | EUR | Germany Services PMI Aug P | 50.1 | 49.8 |
| 08:00 | EUR | Eurozone Manufacturing PMI Aug P | 51.8 | 51.9 |
| 08:00 | EUR | Eurozone Services PMI Aug P | 51.5 | 51.7 |
| 08:30 | GBP | Manufacturing PMI Aug P | 51.6 | 51.9 |
| 08:30 | GBP | Services PMI Aug P | 51.8 | 52.1 |
| 12:30 | CAD | Retail Sales M/M Jun | 0.40% | 1.00% |
| 12:30 | CAD | Retail Sales ex Autos M/M Jun | 0.20% | 1.20% |
| 13:45 | USD | Manufacturing PMI Aug P | 53.9 | 53.9 |
| 13:45 | USD | Services PMI Aug P | 54 | 54.6 |
| 14:00 | EUR | Eurozone Consumer Confidence Aug P | -16 | -15.9 |
| 22:45 | NZD |
| Trade Balance (NZD) Jul | |
| Consensus | -175M |
| Previous | 23M |
| 23:00 | AUD |
| Manufacturing PMI Aug P | |
| Consensus | |
| Previous | 52 |
| 23:00 | AUD |
| Services PMI Aug P | |
| Consensus | |
| Previous | 53.6 |
| 23:01 | GBP |
| GfK Consumer Confidence Aug | |
| Consensus | -18 |
| Previous | -17 |
| 23:30 | JPY |
| National CPI Y/Y Jul | |
| Consensus | |
| Previous | 1.70% |
| 23:30 | JPY |
| National CPI Core Y/Y Jul | |
| Consensus | 1.80% |
| Previous | 1.60% |
| 23:30 | JPY |
| National CPI Core-Core Y/Y Jul | |
| Consensus | |
| Previous | 1.70% |
| 00:30 | JPY |
| Manufacturing PMI Aug P | |
| Consensus | 55.1 |
| Previous | 54.5 |
| 00:30 | JPY |
| Services PMI Aug P | |
| Consensus | |
| Previous | 51.2 |
| 06:00 | GBP |
| Retail Sales M/M Jul | |
| Consensus | -0.50% |
| Previous | 1.00% |
| 06:00 | GBP |
| Retail Sales Y/Y Jul | |
| Consensus | 2.20% |
| Previous | 4.20% |
| 07:15 | EUR |
| France Manufacturing PMI Aug P | |
| Consensus | 50.1 |
| Previous | 49.8 |
| 07:15 | EUR |
| France Services PMI Aug P | |
| Consensus | 49.4 |
| Previous | 49.6 |
| 07:30 | EUR |
| Germany Manufacturing PMI Aug P | |
| Consensus | 52.1 |
| Previous | 52.2 |
| 07:30 | EUR |
| Germany Services PMI Aug P | |
| Consensus | 50.1 |
| Previous | 49.8 |
| 08:00 | EUR |
| Eurozone Manufacturing PMI Aug P | |
| Consensus | 51.8 |
| Previous | 51.9 |
| 08:00 | EUR |
| Eurozone Services PMI Aug P | |
| Consensus | 51.5 |
| Previous | 51.7 |
| 08:30 | GBP |
| Manufacturing PMI Aug P | |
| Consensus | 51.6 |
| Previous | 51.9 |
| 08:30 | GBP |
| Services PMI Aug P | |
| Consensus | 51.8 |
| Previous | 52.1 |
| 12:30 | CAD |
| Retail Sales M/M Jun | |
| Consensus | 0.40% |
| Previous | 1.00% |
| 12:30 | CAD |
| Retail Sales ex Autos M/M Jun | |
| Consensus | 0.20% |
| Previous | 1.20% |
| 13:45 | USD |
| Manufacturing PMI Aug P | |
| Consensus | 53.9 |
| Previous | 53.9 |
| 13:45 | USD |
| Services PMI Aug P | |
| Consensus | 54 |
| Previous | 54.6 |
| 14:00 | EUR |
| Eurozone Consumer Confidence Aug P | |
| Consensus | -16 |
| Previous | -15.9 |
The Weekly Bottom Line: Tick, Tock, Tick, Tock
Our summary of recent economic events and what to expect in the weeks ahead.
Canadian Highlights
- Canada and the U.S. are negotiating ahead of the August 19th deadline for the latest U.S. tariff threat. Details remain limited and the outcome could materially affect sector activity, investment, and business confidence.
- A solid Canadian labour market report and benign U.S. CPI have narrowed Canada-U.S. rate differentials, supporting the Canadian dollar's rally to around 72 cents U.S.
- July inflation is expected to register around 2.9% on higher gasoline prices. Core inflation and any trade update could influence yields, Bank of Canada expectations, and the economy's recovery path.
U.S. Highlights
- Markets found their footing after Wednesday's CPI inflation report showed inflation pressures continued to ease, pushing equities higher.
- Retail sales declined in July, but the shift in timing of Amazon Prime Days likely overstated the weakness.
- Fed commentary remained cautious, making next week's FOMC minutes an important signal of how officials were weighing inflation and policy risks before this week's CPI relief.
Canada: Tick, Tock, Tick, Tock
With the August 19th deadline looming for the latest U.S. tariff threat, negotiators continue to discuss a potential trade deal. Of course, the devil will be in the details (that remain scant) and economic uncertainty remains elevated. Markets meanwhile have been digesting a relatively well-behaved U.S. CPI print and last week's Canadian labour market outperformance. The data has helped narrow the gap between Canadian and U.S. interest rates, extending the loonie's rally to 72 cents U.S. at the time of writing. Whether the loonie's run will continue likely comes down to how trade negotiations play out, and Monday's Canadian inflation report.
All eyes are focused on the trade negotiations. Canada's Minister for Canada-U.S. Trade Dominic Leblanc and Chief Trade Negotiator Janice Charette have been shuttling back and forth from meetings with their U.S. counterparts. As of Friday morning, U.S. officials have said both President Trump and Prime Minister Carney are due to be presented with "options". The reality is that details on any possible deal remain few and far between. The scale and scope of any tariff relief on sector-specific Section 232 levies (i.e. the 50% on steel & aluminum, 25% on autos, etc.) could have a meaningful impact on sector-level activity and investment activity. Any knock-on improvements to business sentiment would also be welcome at a time that the economy is showing some bounce-back after stalling out in the winter months.
The flip side is that the 50% tariffs come into effect on August 19th. We have already discussed the potential direct macroeconomic impact, but the risk of escalating tensions, new retaliation, and a hit to business confidence, could further undercut the economy's tentative recovery.
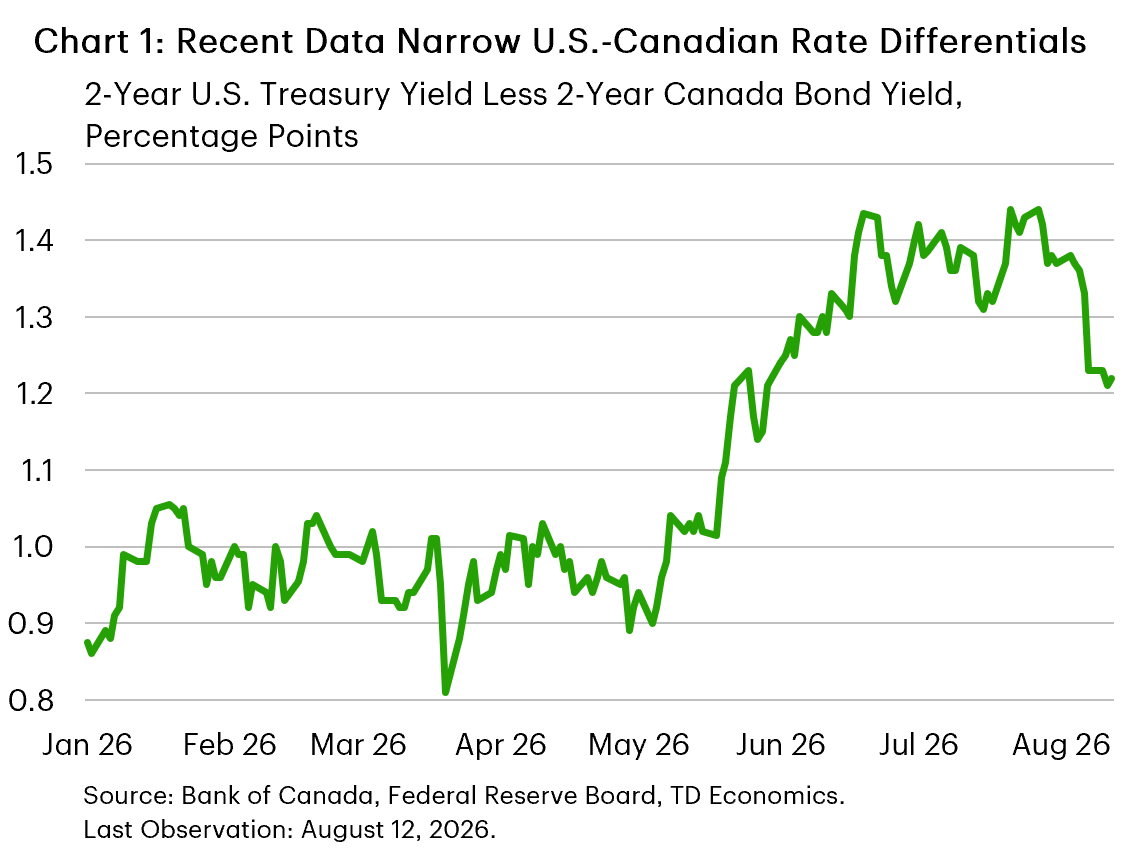
The Bank of Canada cited an increase in trade frictions as a possible reason to reduce interest rates. However, recent data have showcased some of Canada's economic resilience (pushing Canadian yields higher) and dampened some of the market pricing for rate hikes from the Fed. This has helped narrow the differentials on two-year borrowing costs by over 20 basis points, bringing them to their lowest level since June (Chart 1).
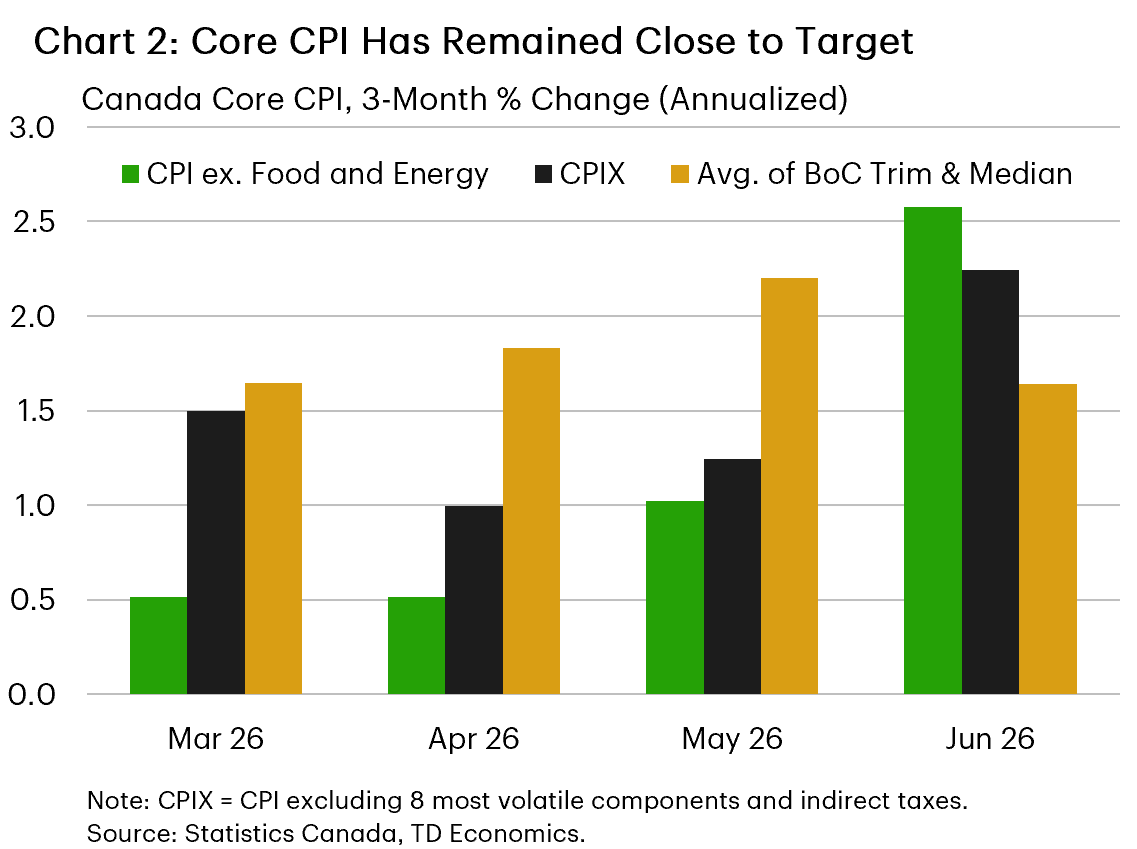
Monday could then have a doubly important impact if an update on trade negotiations arrives as July's CPI data are released. Headline inflation is likely to register around 2.9%, owing to the rise in gasoline prices for the month. However, the focus will be on what the core measures show (Chart 2). With better-than-expected recent economic data, an upside surprise on the core measures could push near-term yields higher. However, an upside surprise to core inflation wouldn't be entirely unexpected. Energy prices remain materially higher than in February, and some degree of pass-through to other goods and services is reasonable.
As we look to next week, the data will give us an idea of where the economy stood ahead of the August 19th deadline, but the path forward will hinge on whether the recent flurry of negotiations will avert another trade shock.
Andrew Hencic, Director & Senior Economist
U.S. – Softer Inflation, Softer Spending
The week's story was a turn in sentiment. After a choppy start dominated by lingering concerns over oil prices, tariffs, and whether the Fed might need to lean more hawkish, Wednesday's CPI report offered the relief valve that everyone was looking for. Equities continued to push higher, with the S&P 500 and Nasdaq benefiting from a renewed "soft landing" bid as investors took comfort that inflation showed further signs that it is no longer moving in the wrong direction. Treasury yields steadied as the data flow veered toward a goldilocks zone: growth has cooled enough to reduce inflation pressure, but not enough to undermine risk appetite.
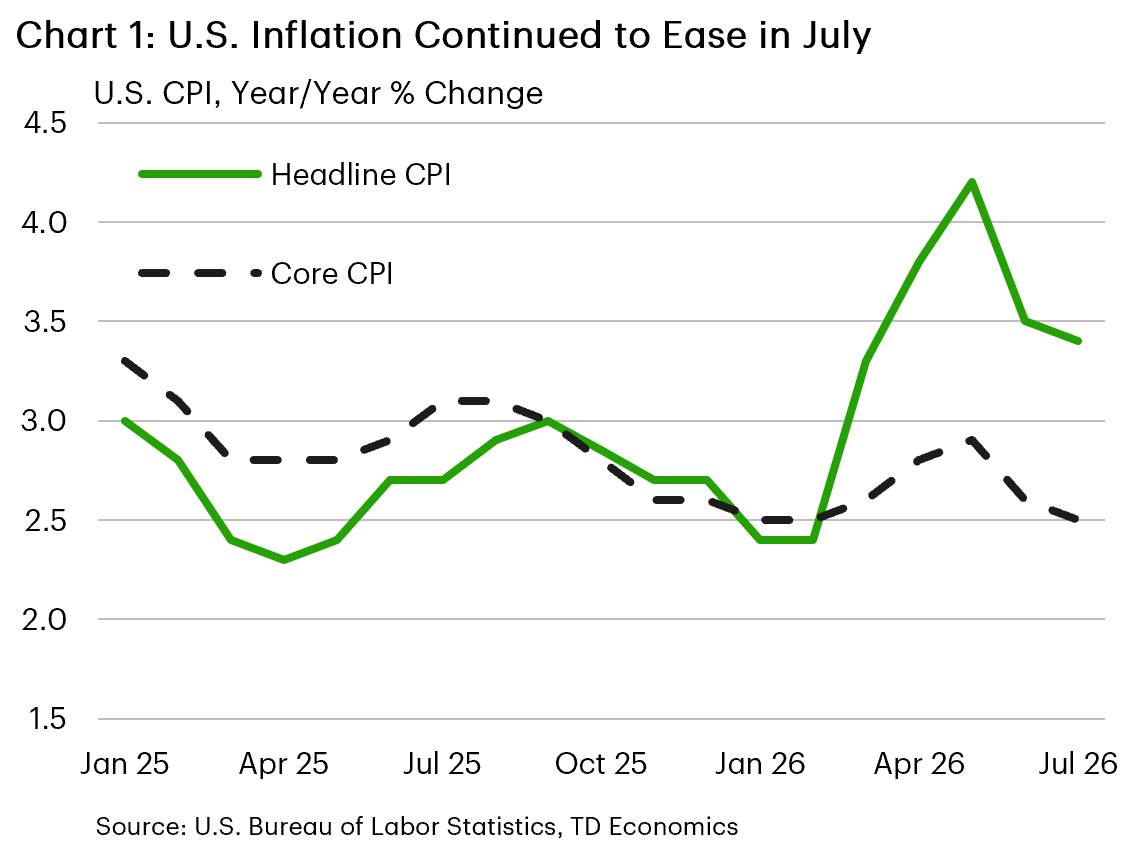
The week's data were encouraging, but not uniformly. Two releases helped the soft-landing case: CPI provided the biggest market relief, while the NFIB Small Business Optimism Index rose 2.4 points in July to 99.8, its highest level since August 2025, with hiring and capital spending plans pointing to better Main Street confidence. Even so, uncertainty remained elevated and labor quality re-emerged as the top concern, keeping the survey from looking like an all-clear signal. With respect to the CPI release, headline prices rose just 0.1% month-on-month in July, while core prices increased 0.2%, both in line with expectations. As we noted in our commentary, underlying inflation trends are moving in the right direction: headline inflation eased to 3.4% year-on-year and core inflation stepped back to its pre-Iran conflict pace of 2.5% (Chart 1).
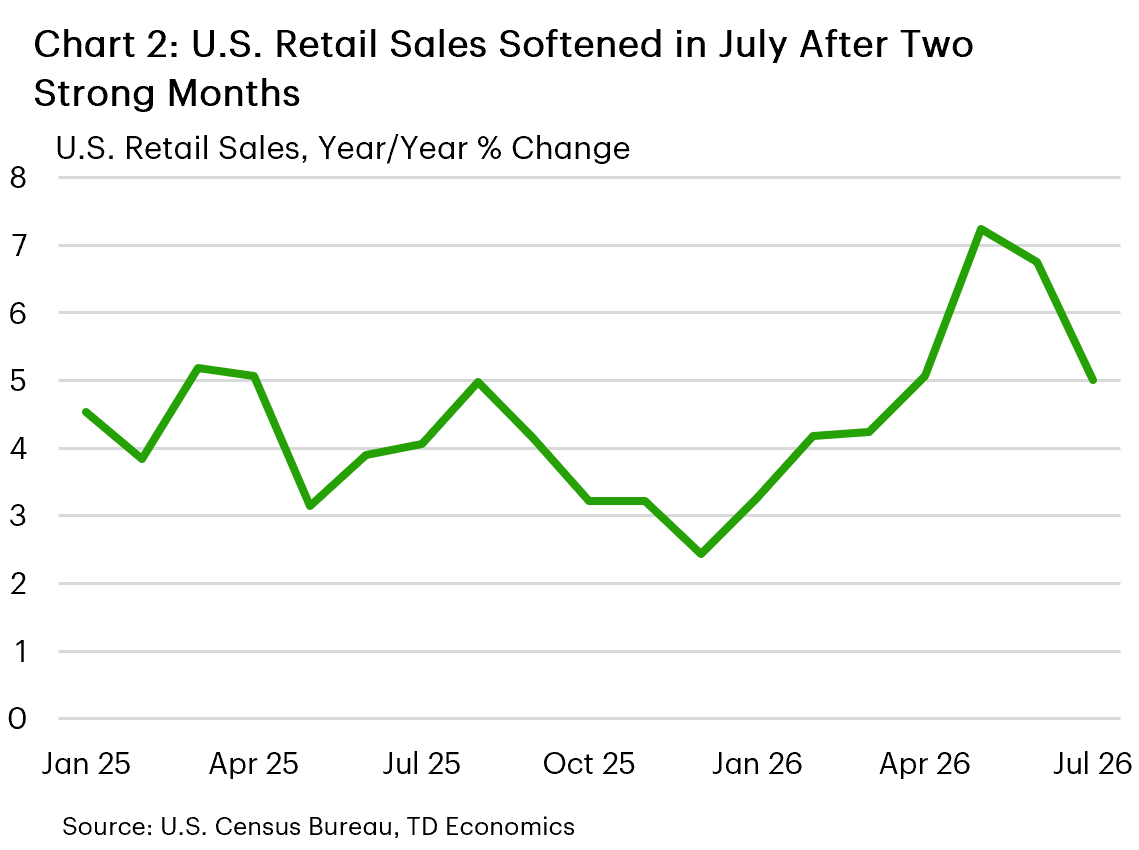
The softer piece of the week's data flow came from retail sales (Chart 2). However, July's decline was largely because of a pullback in vehicle sales and a sharp decline in online shopping. The latter was likely driven by Amazon Prime Days happening in late June this year, as opposed to its normal timing of mid-July. Outside of these categories, spending held up reasonably well, suggesting the pullback in retail spending was less dire than implied by the headline print. Overall, we still expect consumer spending to expand by +2% in the third quarter, a moderation from Q2's 3.2% but still a healthy pace nonetheless.
Softer inflation and a stable labor market suggest the FOMC is likely to remain on hold for the time being. That's exactly what we've seen in Fed futures pricing, with a September hike now only 29% priced, compared to 52% at the beginning of the week. That said, Cleveland Fed President Beth Hammack and Richmond Fed President Tom Barkin remained cautious in their messaging this week, acknowledging better inflation news but stopping short of declaring victory. We suspect the data this week argue for the Fed to remain in wait-and-see mode, particularly with one more jobs report and another CPI print still to come before the September meeting. Next week's July FOMC minutes pre-date this week's CPI release, but could still contain useful information about how worried officials were about tariff and energy risks before this week's better inflation news.
Trade Deadline Looms After Canada’s Inflation Data for July
Canada’s Consumer Price Index for July on Monday is expected to show a tick higher in headline CPI, before the latest round of U.S. Section 338 tariffs are set to take effect on Wednesday.
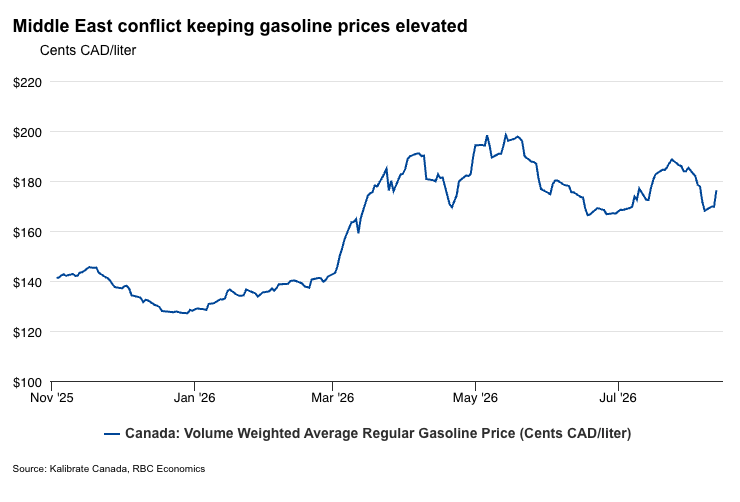
We expect year-over-year price growth rose to 2.9% from 2.8% in June, driven by a reacceleration in energy prices. Oil prices are still lower than peaks in April and May, but bounced higher in July as conflict in the Middle East continued to disrupt transportation through the Strait of Hormuz. Gasoline prices were on average 25% above a year ago in July—up from a 20% rise in June.
We expect pass-through from higher energy prices to broader consumer prices have remained limited. Growth in airfares remains high, but growth in “core” measures’ prices have remained near the 2% target. In July, we look for prices excluding food and energy products to tick up to 1.9% from 1.8% in June, and for the Bank of Canada’s preferred median and trim measures to hold around similar rates. Food price growth likely edged lower, but remained above 3%.
Latest U.S. tariff threats are significant but manageable for Canada
A more important development is U.S. Section 338 tariffs targeting about 5% of Canada’s exports, set to take effect on August 19.
The deadline has fast-tracked trade talks between Canada and the U.S., but the odds of a full resolution of all trade irritants before Wednesday remain low. For the U.S. economy, the impact will be negligible as the targeted products represent a small (0.5%), and highly substitutable share of U.S. imports from the world.
For Canada, as we’ve covered here and in our latest forecast update, the impact will be bigger, but still manageable. We estimate the new U.S. tariffs target 0.4% of Canada’s gross domestic product and jobs.
The economy wide impact may be small, but reduced foreign demand for these products would still hurt production and jobs in key manufacturing industries—notably apparel and electrical equipment and appliances manufacturing—mirroring effects from past U.S. Section 232 tariffs.
Overall, even with the new tariffs in place, 80% of Canada’s exports to the U.S. remain duty free under CUSMA exemptions. This should ultimately limit the impact of tariff headwinds on the Canadian economy, which is expected to continue to strengthen over the second half of this year.
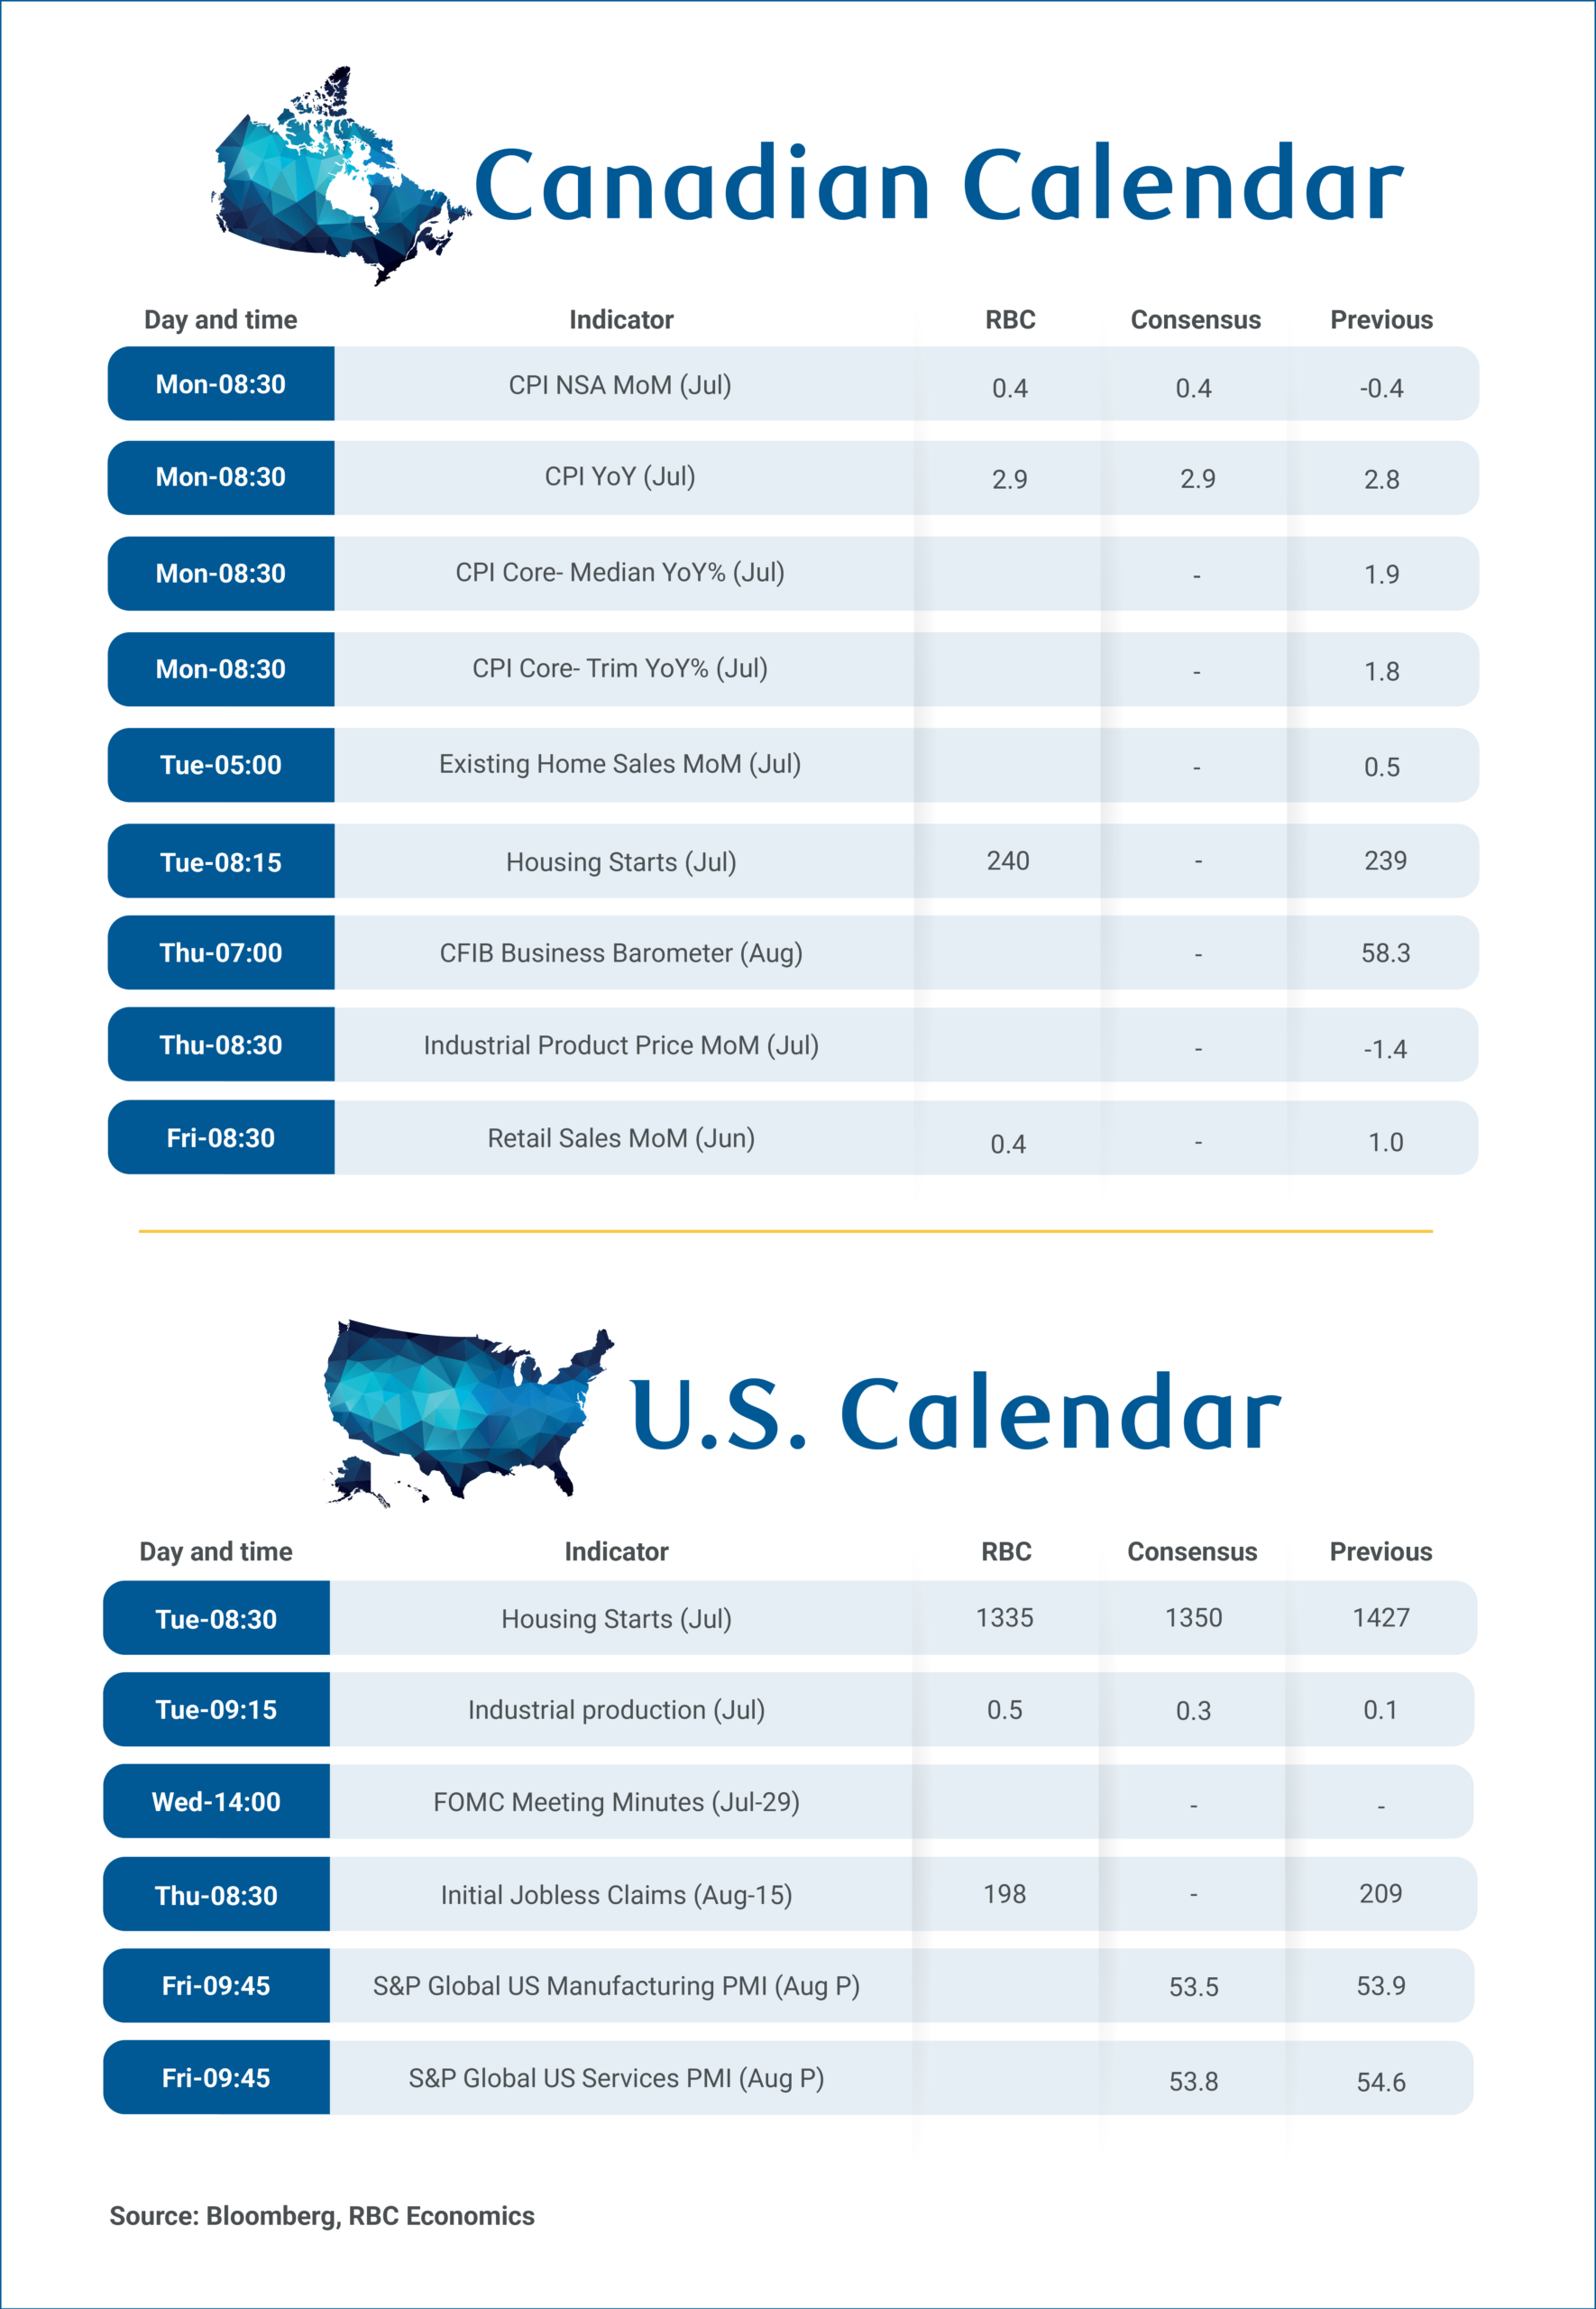
- Tuesday’s home resales data is expected to show diverging trends across markets in July that net out to relatively flat resale activities and prices month over month. Separately, housing starts are expected to have annualized 240k in July, also little changed from June.
- Friday’s retail sales are expected to show an increase in nominal sales in June, supported by real underlying strength as gasoline prices temporarily dropped lower. Overall, consumer spending remained resilient in Q2 and is poised to add to real GDP growth in the quarter.
US Consumers Turn More Pessimistic as Inflation Concerns Stay Elevated
US consumer sentiment deteriorated sharply in August, adding to signs that household confidence is weakening even as inflation concerns persist. University of Michigan Consumer Sentiment fell from 55.2 to 51.0, below 54.1 consensus. Current Conditions dropped from 54.8 to 51.8 and Expectations declined from 55.4 to 50.6. Survey said expected business conditions fell -11% for short run and -17% for long run, with weakness particularly pronounced among older, lower-income and non-college consumers.
Inflation expectations moved in opposite direction. One-year expectations edged up from 4.2% to 4.3%, remaining well above 3.4% in February before Iran conflict. Long-run expectations held at 3.3% for third straight month. Purchasing-power concerns remain acute: only 8% of consumers expect income growth to exceed inflation over next year, down from 18% in December 2024. That combination suggests households are becoming less confident about growth without becoming more comfortable about prices.
For Fed, report is awkward rather than clearly dovish. Weak sentiment adds to softer retail sales and July labor data, reinforcing evidence that demand is losing momentum. But elevated inflation expectations argue against assuming weaker activity will automatically translate into faster disinflation. Overall signal is mildly stagflationary: consumer confidence is deteriorating while inflation expectations remain too high, strengthening case for Fed to hold and wait for clearer August data.
Data Summary
| Component | Current | Previous | Trend |
|---|---|---|---|
| Consumer Sentiment | 51.0 | 55.2 | Sharp deterioration |
| Current Economic Conditions | 51.8 | 54.8 | Weaker |
| Consumer Expectations | 50.6 | 55.4 | Sharp deterioration |
| 1-Year Inflation Expectations | 4.3% | 4.2% | Higher |
| Long-Run Inflation Expectations | 3.3% | 3.3% | Unchanged |
Key Takeaways
- UoM Consumer Sentiment fell from 55.2 to 51.0 in August, well below 54.1 consensus, ending two consecutive months of improvement.
- Consumer Expectations weakened more sharply from 55.4 to 50.6, while Current Conditions fell from 54.8 to 51.8.
- Expected business conditions dropped 11% for short run and 17% for long run, pointing to growing concern over economic outlook.
- One-year inflation expectations edged up from 4.2% to 4.3%, remaining well above 3.4% seen before Iran conflict.
- Long-run inflation expectations stayed at 3.3% for third straight month, still slightly above 2024 range of 2.8–3.2%.
- Only 8% of consumers expect income growth to exceed inflation over next year, down from 18% in December 2024.
- Report carries a stagflationary tone: confidence is weakening while inflation expectations remain elevated, reinforcing Fed case to hold and assess incoming data.
Sunset Market Commentary
Markets
July US retail sales extend the string of weak to tame US eco data since Friday's payrolls. Headline retail sales unexpectedly fell by 0.6% M/M (vs +0.1% consensus) with sales in the retail control group down 0.4% M/M (vs +0.3% expected). Details offer some silver linings though with sales volumes up in 9 out of 13 categories and auto sales providing the biggest drag (-1.8% M/M) together with gasoline sales (-0.9% M/M; take into account drop in gas prices in July). US Treasuries initially rallied in bull steepening fashion, but part of the initial move was rapidly undone as details emerged. Daily changes on the US yield curve currently range between -1.1 bp (2-yr) and +2.4 bps (30-yr). European and UK yield curves show bear steepening trends with the very long end of the curve adding up to 5 bps. Higher real rates (fiscal worries) keep pushing long term bond yields up. The dollar lost some more ground compared to post-payrolls or post-CPI/PPI reactions but EUR/USD 1.16 technical resistance remains out of reach.
Next week's trading gets off to a slow start. On Monday and Tuesday, we'll only get second tier data in the US and EMU. Wednesday and Friday could be the more interesting days. On Wednesday, ECB President Lagarde participates in a panel discussion at the WEF's International Business Council meeting (global economic outlook). Minutes of the July FOMC meeting could provide more clues on thinking within the Fed and potential triggers for tightening following the 9-3 split vote in favour of keeping rates unchanged. The US Treasury's $16bn 20-yr Bond sale is a wildcard. On Friday, global PMI surveys for the month of August are released together with ECB inflation expectations (July) and EMU Q2 negotiated wage data. Other things to look out for are the monthly eco update in the UK (labour market report, inflation & retail sales) and the Swedish Riksbank's policy decision (Thursday).
News & Views
Rating agency Fitch overnight affirmed the USA's AA+ rating with a stable outlook. The agency cited the country's large and resilient economy, high income levels, strong business environment, and exceptional financing flexibility stemming from the USD's dominant role in the global financial system as key strengths. Fitch expects US economic growth to remain solid at around 1.9% annually in 2026-2027, despite headwinds from tariffs, spending cuts, tighter immigration policies, and elevated policy uncertainty. Average inflation is projected at 3.4% in 2026, although it is expected to gradually decline toward 2% by 2028. The main constraints on the rating are the country's large fiscal deficits, rising government debt, and increasing interest burden. Fitch forecasts general government deficits of 7.4% of GDP in both 2026 and 2027, driven by tax cuts, tariff rebates, defense spending, and higher interest costs. Government debt is projected to rise from 117% of GDP in 2025 to 123% in 2028, eventually reaching 128% by 2030 under current policies. Fitch also highlighted growing long-term fiscal pressures from an aging population. Interest costs are expected to consume a larger share of government revenues over the coming years, reducing fiscal flexibility. On governance, Fitch noted continued pressure on institutional checks and balances under the Trump administration but observed that courts and Congress have continued to provide meaningful constraints on executive actions.
The preliminary sport-event adjusted Swiss Q2 GDP figure showed growth significantly accelerating, from 0.3% Q/Q in Q1 to 1.5%, beating all estimates. Growth was driven by the industrial sector according to the State Secretariat for Economic Affairs which is responsible for the data, in particular by chemicals and pharmaceuticals. Services also expanded overall. A detailed assessment, using complete and updated data, will be published on September 3. The growth surge probably takes some trade frontloading into account. On July 24, the US introduced new additional tariffs following an investigation under Section 301 of the Trade Act of 1974. A variable additional tariff of up to 12.5% is levied on imports from Switzerland, replacing the 10% regime in place since February. Apart from that, the US administration announced a specific tariff regime for pharmaceutical products (under Section 232). The Swiss franc (EUR/CHF 0.94) doesn't profit from today's strong growth figure while money markets aren't inclined to shift to rapid SNB rate hike bets given weak core CPI and a strong CHF.
Weekly Focus – Some Relief in US Inflation Concerns
The US job report showed a surprise decline of 23,000 jobs in July, while previous data was revised down by 103,000. This paints a weaker picture of growth in the US economy but also a picture more in line with the stagnation in the labour force which is reducing the growth potential. Hence, the unemployment rate declined to 4.1% in July despite declining employment. Of course, not too much should be read into a single month of volatile data, and July was influenced by a large drop in public sector employment as well as possibly an effect from the end of the football world cup. Still, we expect to see more job reports like this and the implication is not that monetary policy is too tight, as it is a lack of supply that is constraining job growth.
So, while the weaker employment data is not in itself an argument for the Fed to postpone or even drop rate hikes as we see it, there is more support for that in other data. Average hourly earnings grew only 0.1% in July, which is both an indication that low unemployment is not leading to wage inflation and also points to the risk that US private consumption growth might not be sustainable.
Actual inflation data for July came out as expected with a 0.1% m/m increase in headline CPI and 0.2% excluding food and energy. Annual headline inflation remains too high at 3.4% and means that wage earners are experiencing stagnating spending power at best, and core inflation is a bit higher than the inflation target of two percent would suggest. Still, the July numbers do not signal an urgent need for policy action, and PPI inflation was also lower than expected in July. All in all, we see the chance of a rate hike in September as having declined but we continue to expect the hike to come in December. Keep in mind that we will receive both CPI and labour market data for August before the September meeting, and those data points can of course change the picture.
Oil prices rose around USD 4 per barrel during the week, while the spread to product prices such as gasoline and diesel remain very elevated, as there seems to be more bad than good news regarding a true reopening of the Strait of Hormuz. However, we still do not see many signs that the increase in energy prices since February is causing more widespread inflation around the world.
The most interesting data release in the coming week is likely to be the preliminary August PMIs for the major economies due on Friday. Not least in the euro area, where the July release was surprisingly strong with a composite PMI of 52.0, indicating decent growth and signalling that there is room for another rate hike. On the other hand, PMIs have generally shown less and less pressure for broad price increases following the higher energy prices, indicating that rate hikes might not be needed. Friday will also give the first indication of euro area wage growth in Q2, also an important piece in the inflation and interest rate puzzle. The Japanese economy is attracting extra attention following last week's intervention from both Japan and the US to support the JPY. The currency would be easier to support if the Bank of Japan were to hike rates, and growth and inflation data this week could give a clue as to the prospect of that.
U.S. Retail Sales Declined in July
- Retail and food services sales declined by 0.6% month-over-month (m/m) in July, coming in below expectations for a 0.1% m/m gain. Sales were also lower on an inflation-adjusted basis, with volumes falling by 0.7%.
- Sales at gasoline stations were lower (-0.9% m/m) due to a drop in prices at the pump. Autos and parts dealers also took a breather in July (-1.8% m/m), following robust gains in prior months. Meanwhile, sales at building materials and garden retailers edged higher (+0.3% m/m).
- Control group sales, which exclude the volatile gasoline, auto, building material, and garden equipment categories, fell 0.4% m/m in July. Much of the weakness stemmed from a sharp decline in non-store retail sales (-2.2% m/m), reflecting lower sales at fuel dealers and the earlier timing of Amazon Prime Day, which took place in June this year rather than July. Electronics and appliance stores were the only other category to post a decline (-0.5% m/m).
- Across the remaining categories, spending proved relatively resilient, with sales either flat or modestly higher across most categories, led by clothing and accessories stores (+1.9% m/m), health and personal care stores (+0.7%), and miscellaneous retailers (+0.5% m/m).
- Spending at bars and restaurants—the only service category included in the report—rose by 0.5% in July and were up 5% from the year ago.
Key Implications
- Retail sales softened in July, with lower gasoline prices and weaker auto sales weighing on the headline. Temporary factors, including a decline in fuel dealer sales and a shift in the timing of Amazon Prime Day, have also played a role. Beneath this volatility, the underlying household demand held up despite a slower start to the third quarter. Meanwhile, July CPI data showed that inflation pressures continued to moderate, providing some relief to consumers through improved real purchasing power (commentary).
- The latest retail sales report suggests that consumer spending is transitioning from the weather- and tax-refund-driven rebound seen in Q2 to a more moderate pace of growth in Q3. Today's release is still consistent with consumption advancing at roughly a 2% annualized pace this quarter, broadly in line with our forecast. While households continue to face headwinds from elevated gasoline prices and an uptick in mortgage rates, easing inflation pressures, continued household wealth gains, and a steady labor market should help sustain spending in the months ahead.