
Sample Category Title
GBP/JPY Daily Outlook
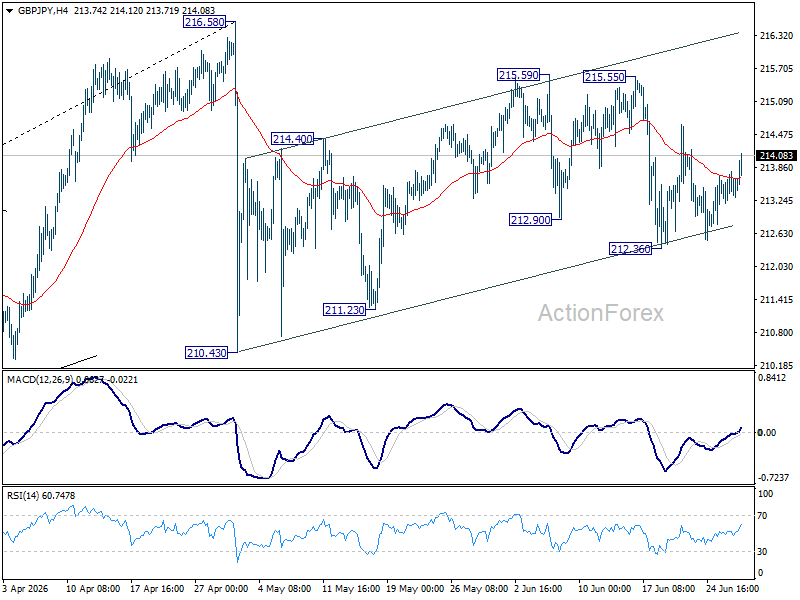
Intraday bias in GBP/JPY remains neutral first. On the downside, below 212.36 will affirm the case that rebound from 210.43 has completed as a correction. Deeper fall would be seen to 211.23 support first. However, break of 215.59 will resume the rebound from 210.43 to retest 216.58.
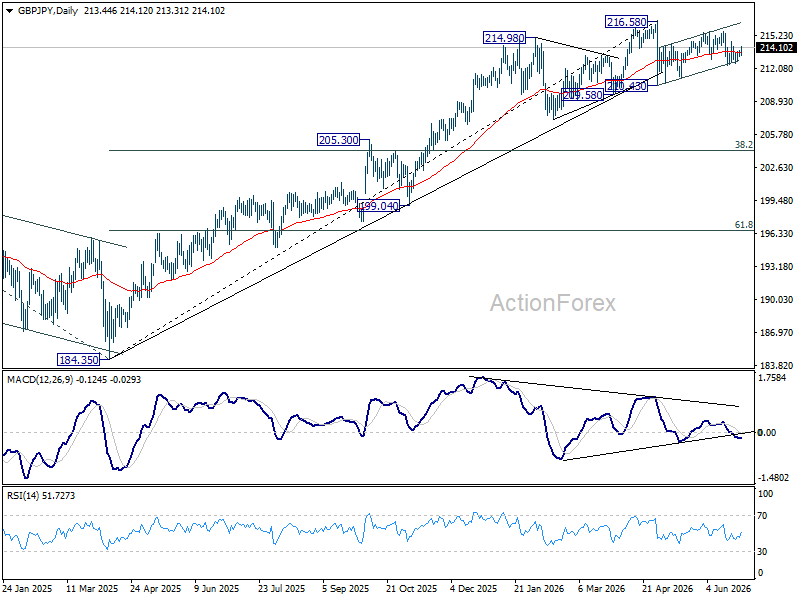
In the bigger picture, there is no clear sign of trend reversal yet. The long term up trend could still extend to 61.8% projection of 148.93 (2022 low) to 208.09 (2024 high) from 184.35 at 220.90 on resumption. However, sustained break of 55 W EMA (now at 207.52) will argue that it's already in medium term down trend for 184.35 support.
EUR/JPY Daily Outlook
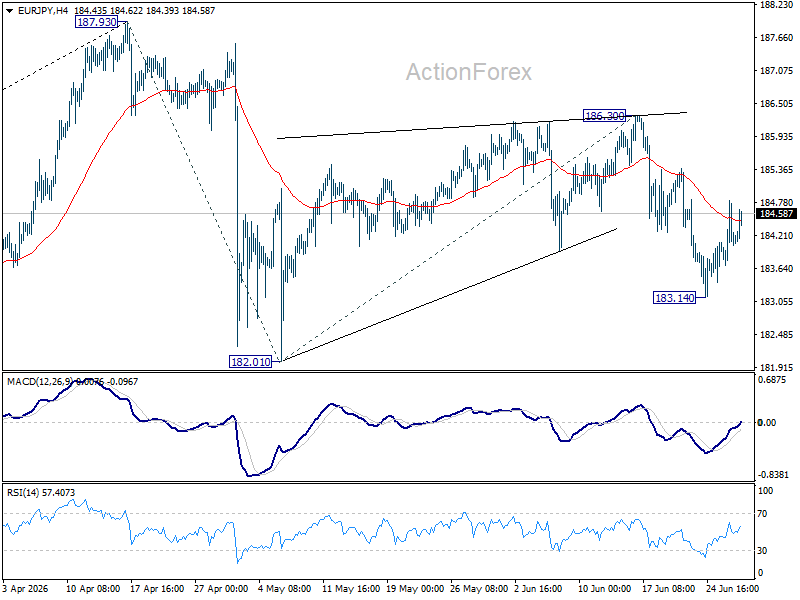
Intraday bias in EUR/JPY stays neutral for the moment. Fall from 186.30 is seen as the third leg of the pattern from 187.93. Below 183.14 will bring retest of 182.01 support first. Firm break there will resume the fall from 187.93 and target 100% projection of 187.93 to 182.01 from 186.30 at 180.38. This will remain the favored case as long as 186.30 resistance holds.
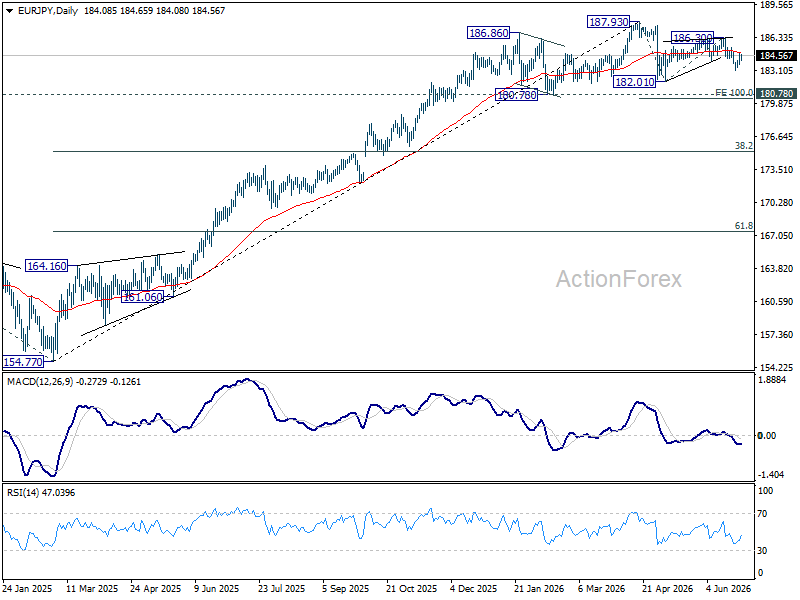
In the bigger picture, there is no sign of reversal yet. Uptrend from 114.42 (2020 low) is still expected to resume at a later stage to 78.6% projection of 124.37 (2022 low) to 175.41 (2025 high) from 154.77 at 194.88. However, sustained break of 55 W EMA (now at 179.37) will argue that it's already in a medium term down trend to 175.41 resistance turned support and below.
EUR/GBP Daily Outlook
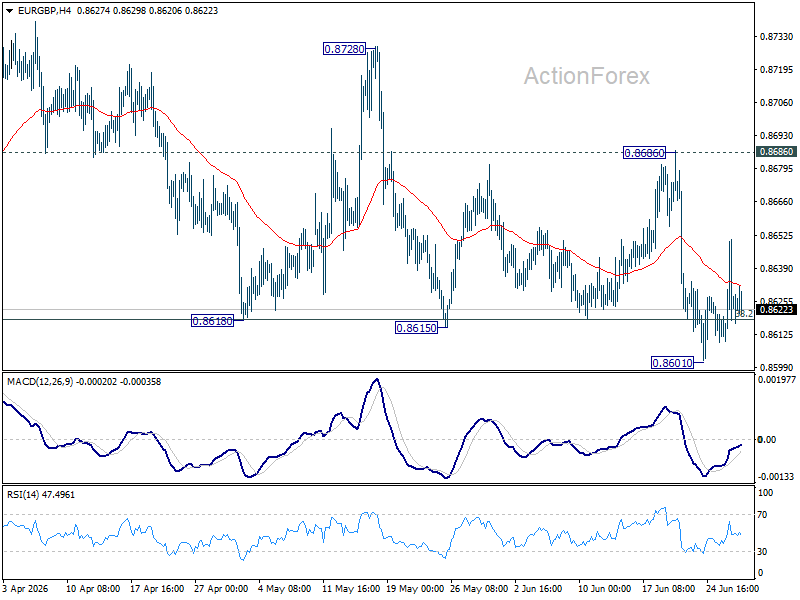
Intraday bias in EUR/GBP remains neutral. Risk will now be mildly on the downside as long as 0.8686 resistance holds. Firm break of 0.8601 will revive the case of bearish trend reversal. However, break of 0.8686 will turn bias back to the upside for 0.8728 resistance instead.
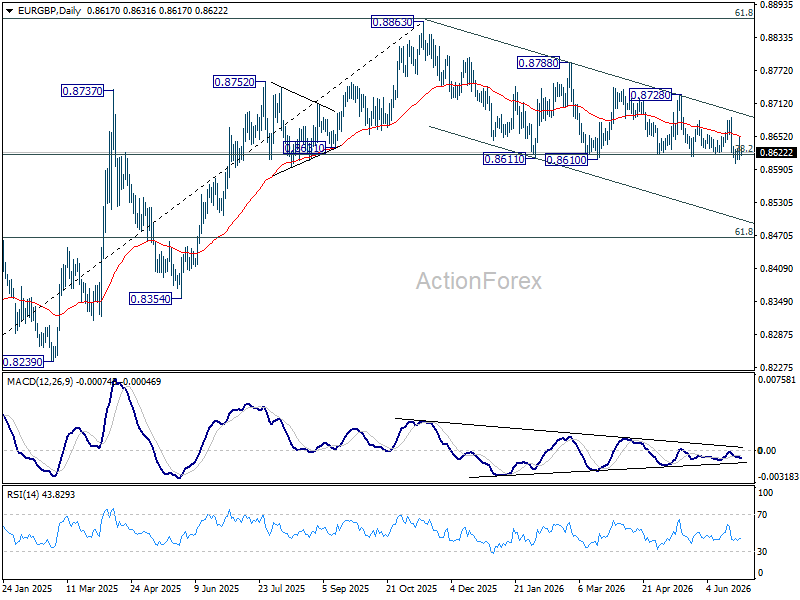
In the bigger picture, focus is staying on 38.2% retracement of 0.8221 to 0.8863 at 0.8618. Strong rebound from there will retain medium term bullishness. Rise from 0.8221 should resume through 0.8863 at a later stage. Nevertheless, sustained break of 0.8618 will confirm that whole rise from 0.8221 has completed at 0.8863. Deeper decline should then be seen to 61.8% retracement at 0.8466 at least.
EUR/AUD Daily Outlook
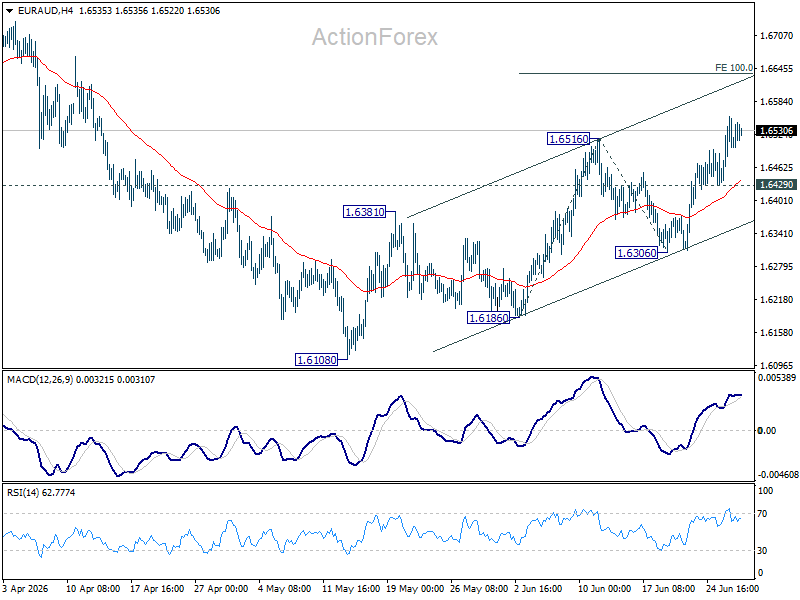
Intraday bias in EUR/AUD remains on the upside for the moment. Current rise from 1.6108 should target 100% projection of 1.6186 to 1.6516 from 1.6306 at 1.6636 next. On the downside, below 1.6429 minor support will turn intraday bias neutral. But further rise will remain mildly in favor as long as 1.6306 support holds, in case of retreat.
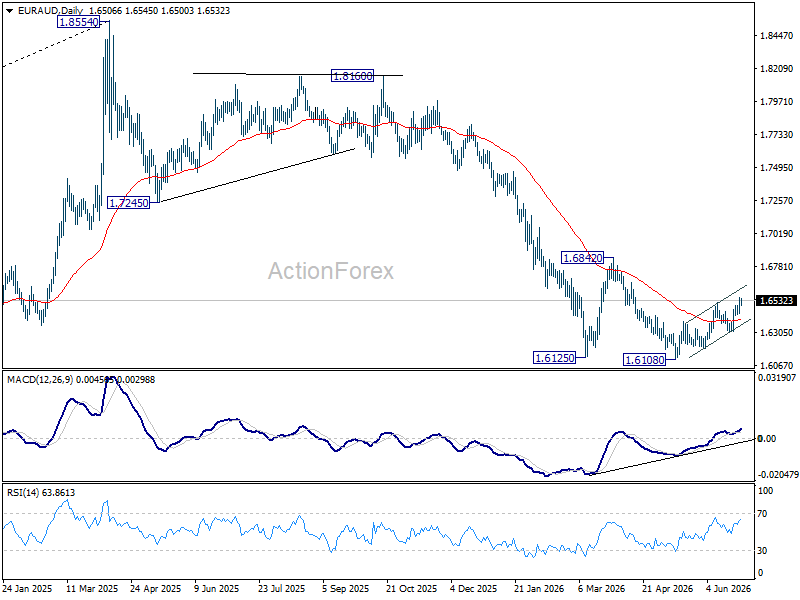
In the bigger picture, outlook will stay bearish as long as 1.6842 resistance holds. Fall from 1.8554 (2025 high) is expected to continue to 61.8% retracement of 1.4281 to 1.8554 at 1.5913. Decisive break there will pave the way back to 1.4281 (2022 low). However, firm break of 1.6842 should confirm medium term bottoming, and bring stronger rally.
EUR/CHF Daily Outlook
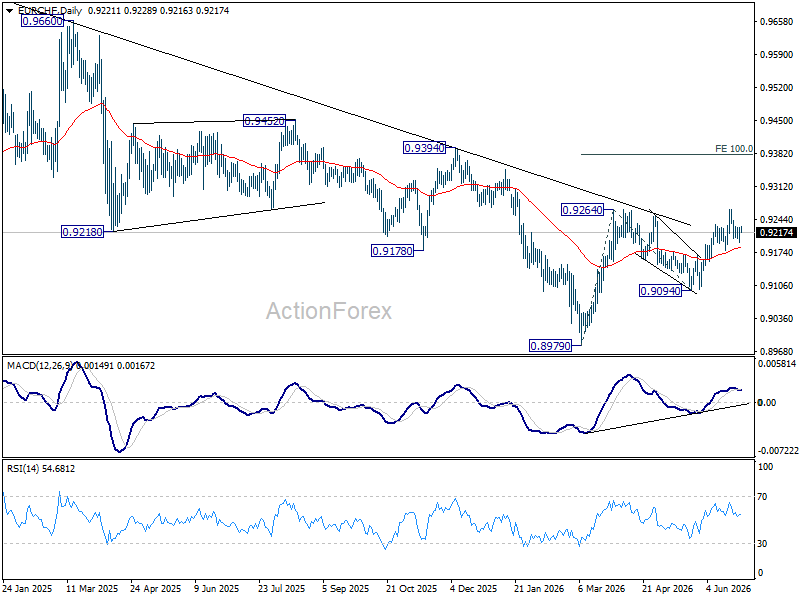
Intraday bias in EUR/CHF remains neutral and further rally is expected as long as 0.9179 support holds. On the upside, above 0.9228 minor resistance will bring retest of 0.9265 first. Firm break of 0.9264/5 will resume the rally from 0.8979 to 100% projection of 0.8979 to 0.9264 from 0.9094 at 0.9379.
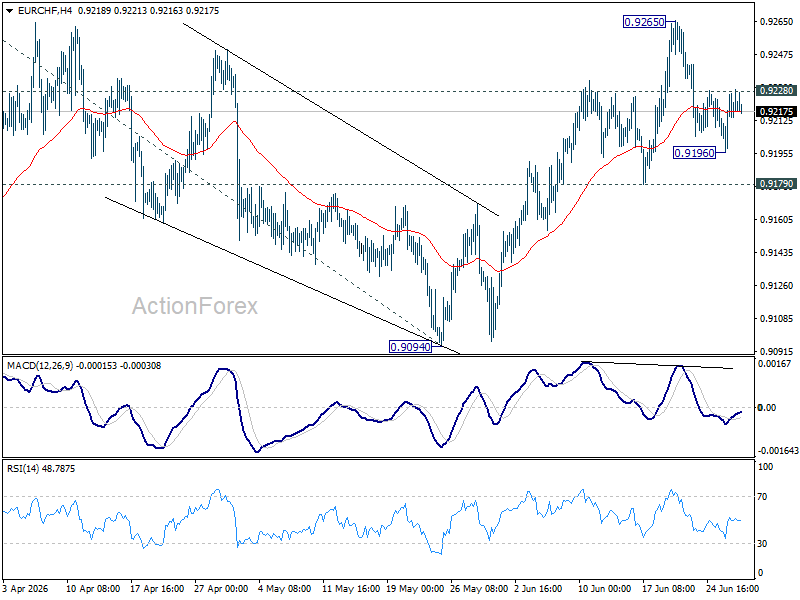
In the bigger picture, the break of medium term falling trend line resistance indicates that 0.8979 is already a medium term bottom. Considering bullish convergence condition in W MACD, rise from there should at least be reversing the fall from 0.9928, with prospect of developing into a medium term up trend. Firm break of 0.9394 resistance will add more credence to this case. For now risk will remain on the upside as long as 0.9094 support holds, in case of retreat.
USD Index – Limited Correction to Precede Fresh Push Higher
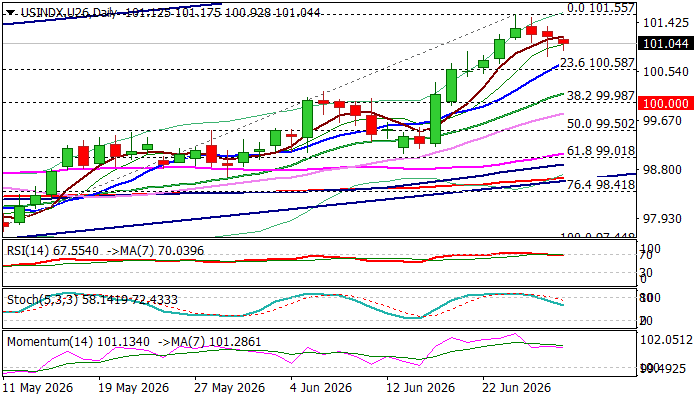
The dollar extends its gradual easing from new one-year high, with dips being so far limited (Friday’s long-tailed daily candle signals still strong bids).
End of month / quarter prompts some profit-taking as dollar rallied for two consecutive months and on track for the biggest monthly gain (June) in eleven months.
However, traders may refrain from stronger action ahead of release US May labor data (due later this week) which is expected to add more details to overall picture of the US economy amid growing bets for rate hike in September, as inflation continues to rise and maintains pressure on the central bank.
With larger uptrend being intact, technical correction is expected to provide better buying levels for dollar’s fresh advance.
Initial supports lay at 100.70/60 (10DMA / Fibo 23.6% of 97.44/101.55 upleg), with psychological 100 level, reinforced by Fibo 38.2% retracement, to ideally contain correction and keep broader bulls intact for renewed attack at 101.55 (new 2026 peak) and open way for 102+ acceleration.
Res: 101.55; 102.00; 102.40; 102.67
Sup: 100.81; 100.60; 100.38; 100.00
AUD/USD: Will the RBA Be Able to Keep Its Currency Strong?
As the chart shows, AUD/USD has entered a distinctly bearish phase in recent weeks, reflecting the broader consolidation — and in some cases outright weakness — that the US dollar has begun imposing across most major currency pairs.
Fundamental Analysis
The Reserve Bank of Australia concluded its June meeting by holding the cash rate steady at 4.35%, opting to monitor the effects of the three consecutive hikes already delivered since the start of the year. The board acknowledged that financial conditions have tightened and that the economy is showing early signs of slowing, while maintaining a vigilant stance on inflation, which remains above target.
In theory, a pause after a tightening sequence — with a cash rate at 4.35%, the highest in the G10 — is a structurally supportive signal for the Australian dollar, as elevated rate differentials tend to attract flows toward AUD-denominated assets. However, markets had already fully priced in this outcome, stripping the decision of any surprise. AUD/USD has consequently failed to post any meaningful bullish impulse, sliding toward almost three-month lows near 0.6890, weighed down by renewed US dollar strength on growing Federal Reserve rate hike expectations. Adding further complexity to the outlook, the ongoing Middle East conflict continues to weigh on global risk sentiment, acting as an additional headwind for a currency that markets have long treated as a barometer of global risk appetite.
Technical Analysis
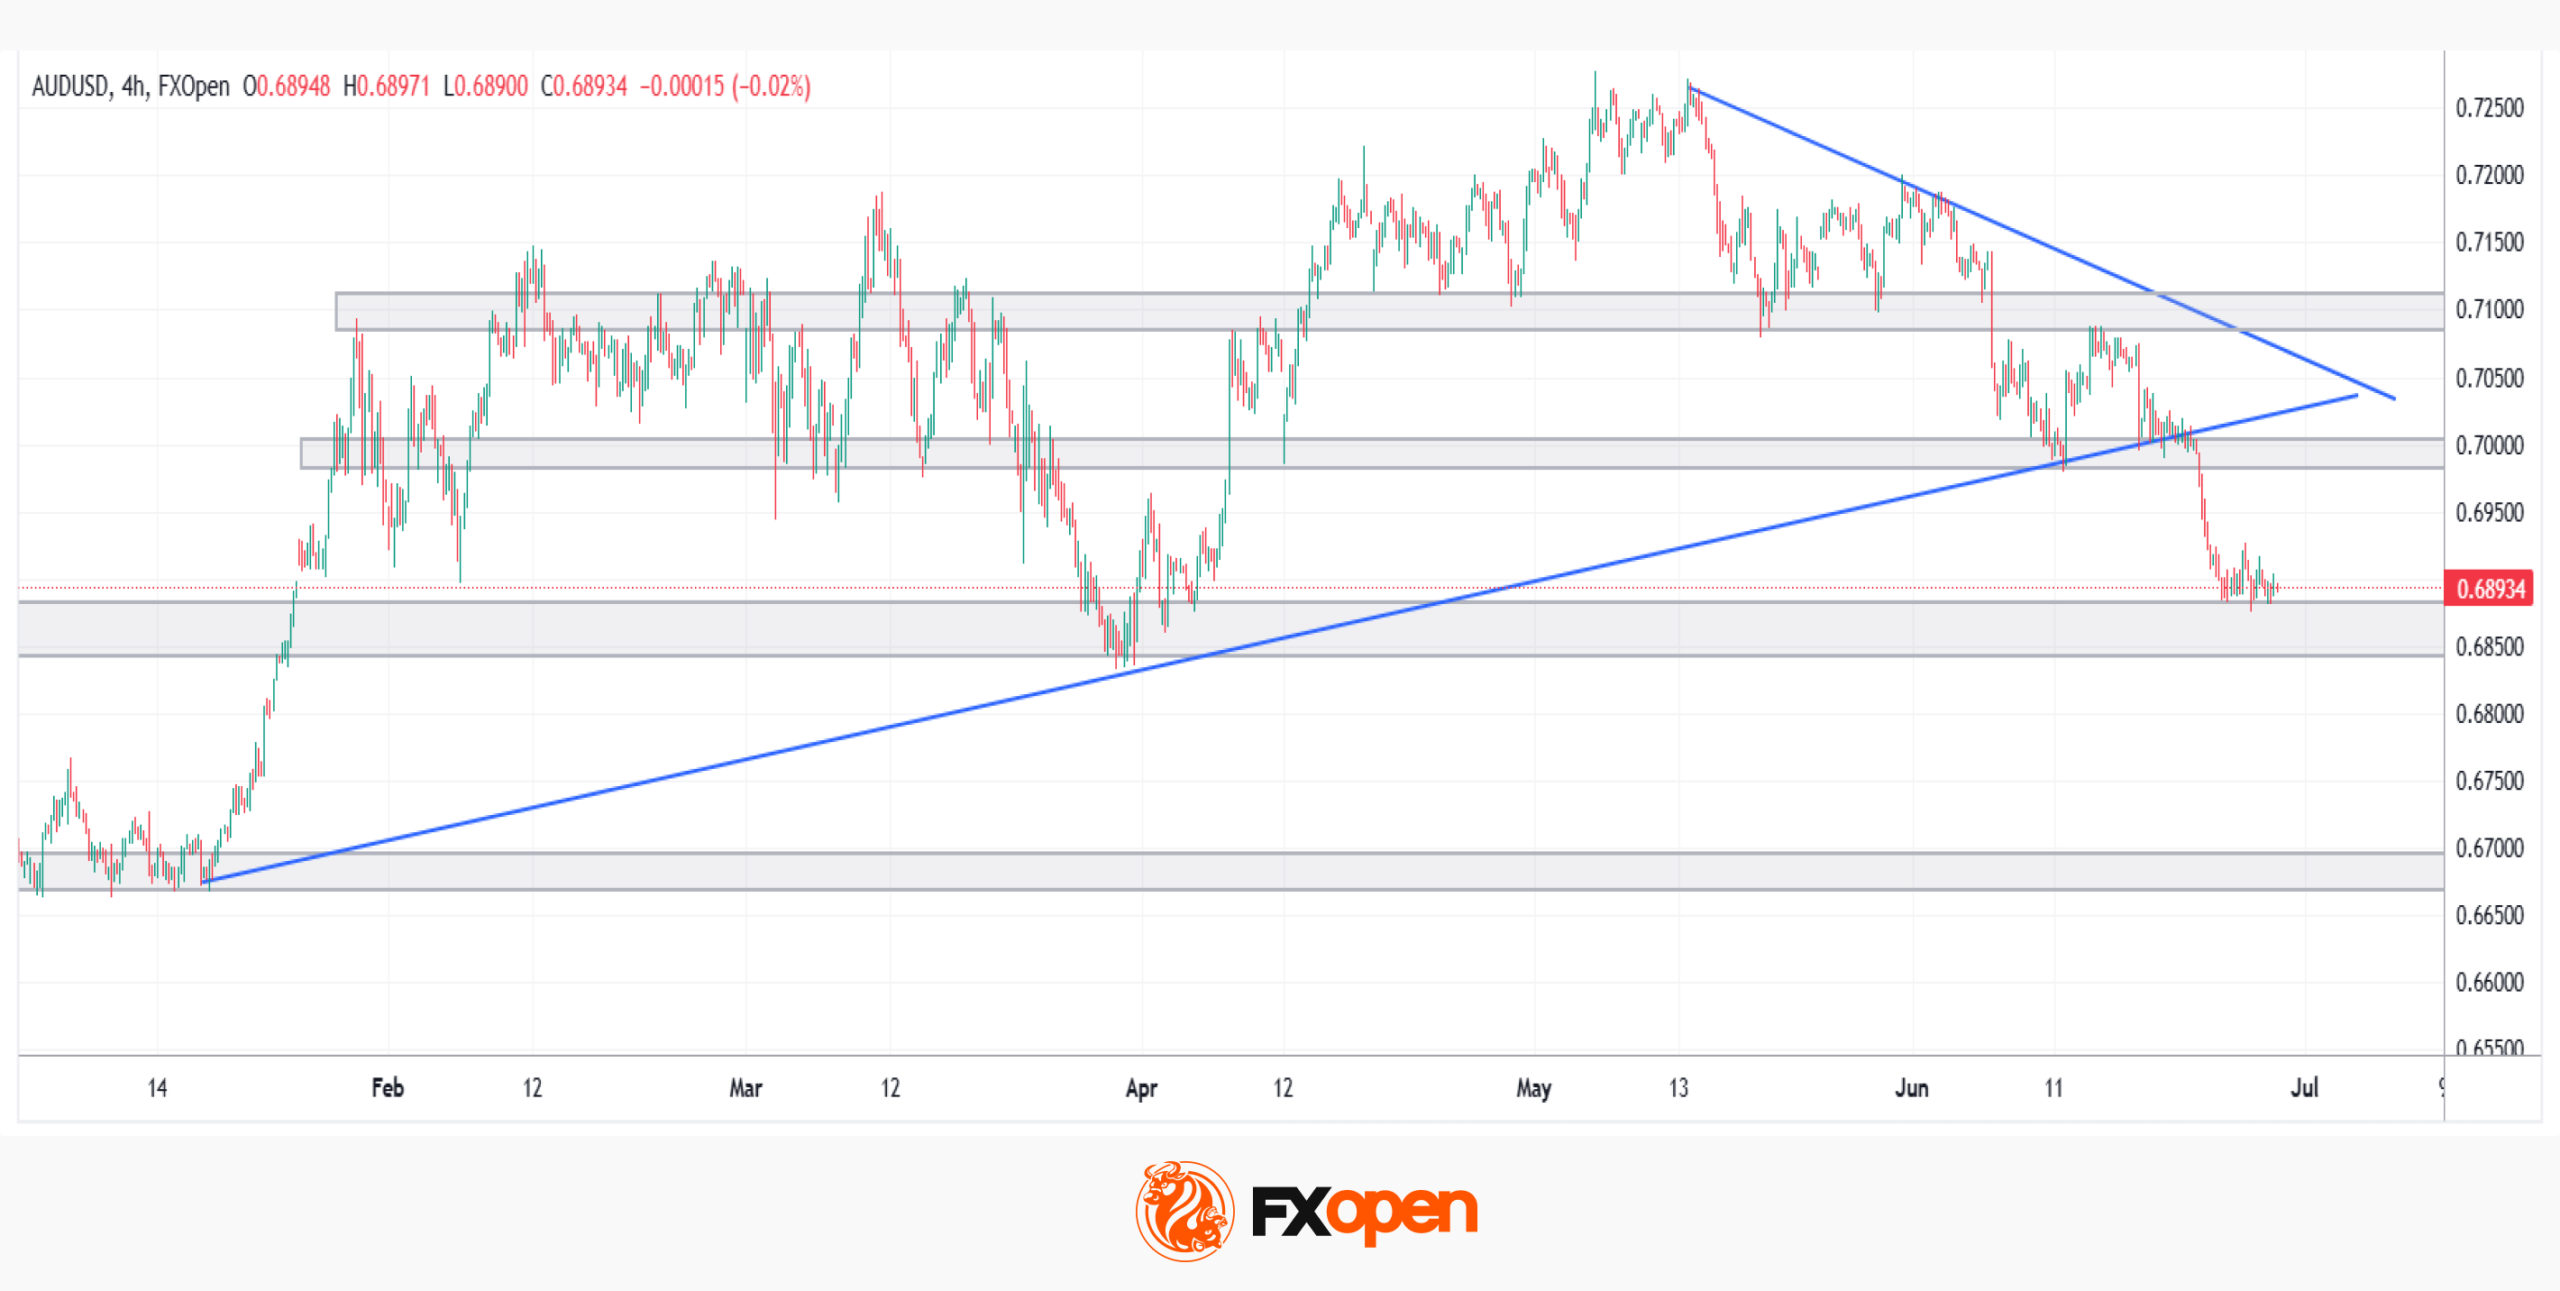
The most representative benchmark for the Australian dollar's momentum, AUD/USD seems to have already shifted his path. Following a prolonged period of broad greenback strength, the pair has gradually developed a bearish structure over recent weeks.
→ Bullish scenario: a key support zone sits in the 0.6880–0.6850 area. Should this level hold, it could restore some of the strength lost in recent weeks and bring the pair back to test the resistance between 0.6980 and 0.7000 — a threshold that will be decisive for the next directional move. A sustained recovery would also require a more relaxed geopolitical backdrop, as risk sentiment continues to cap AUD's upside potential.
→ Bearish scenario: should support fail to hold — or should the pair test the descending trendline in play and reject it, confirming the prevailing downtrend — AUD/USD could revisit levels last seen at the start of the year, with the 0.6700–0.6600 zone as the next significant area of interest.
With a more relaxed geopolitical environment and a hawkish central bank behind it, will the Australian dollar manage to reclaim its strength on the forex stage?
Trade over 50 forex markets 24 hours a day with FXOpen. Take advantage of low commissions, deep liquidity, and spreads from 0.0 pips (additional fees may apply). Open your FXOpen account now or learn more about trading forex with FXOpen.
This article represents the opinion of the Companies operating under the FXOpen brand only. It is not to be construed as an offer, solicitation, or recommendation with respect to products and services provided by the Companies operating under the FXOpen brand, nor is it to be considered financial advice.
S&P 500: Will the Correction Continue?
- The stock market is being spooked by talk of a tech bubble, high Fed interest rates and geopolitical tensions.
- Over time, problems may arise not only for buyers but also for sellers of chips.
Fears over a tech bubble, the Fed’s tightening of monetary policy and the escalation of the conflict in the Middle East have dragged the S&P 500 down to two-week lows. The Philadelphia Stock Exchange Semiconductor Index recorded its worst weekly performance since April 2025. The US air strikes on Iran occurred after the market had closed, leaving investors to assess their potential impact when trading resumed.
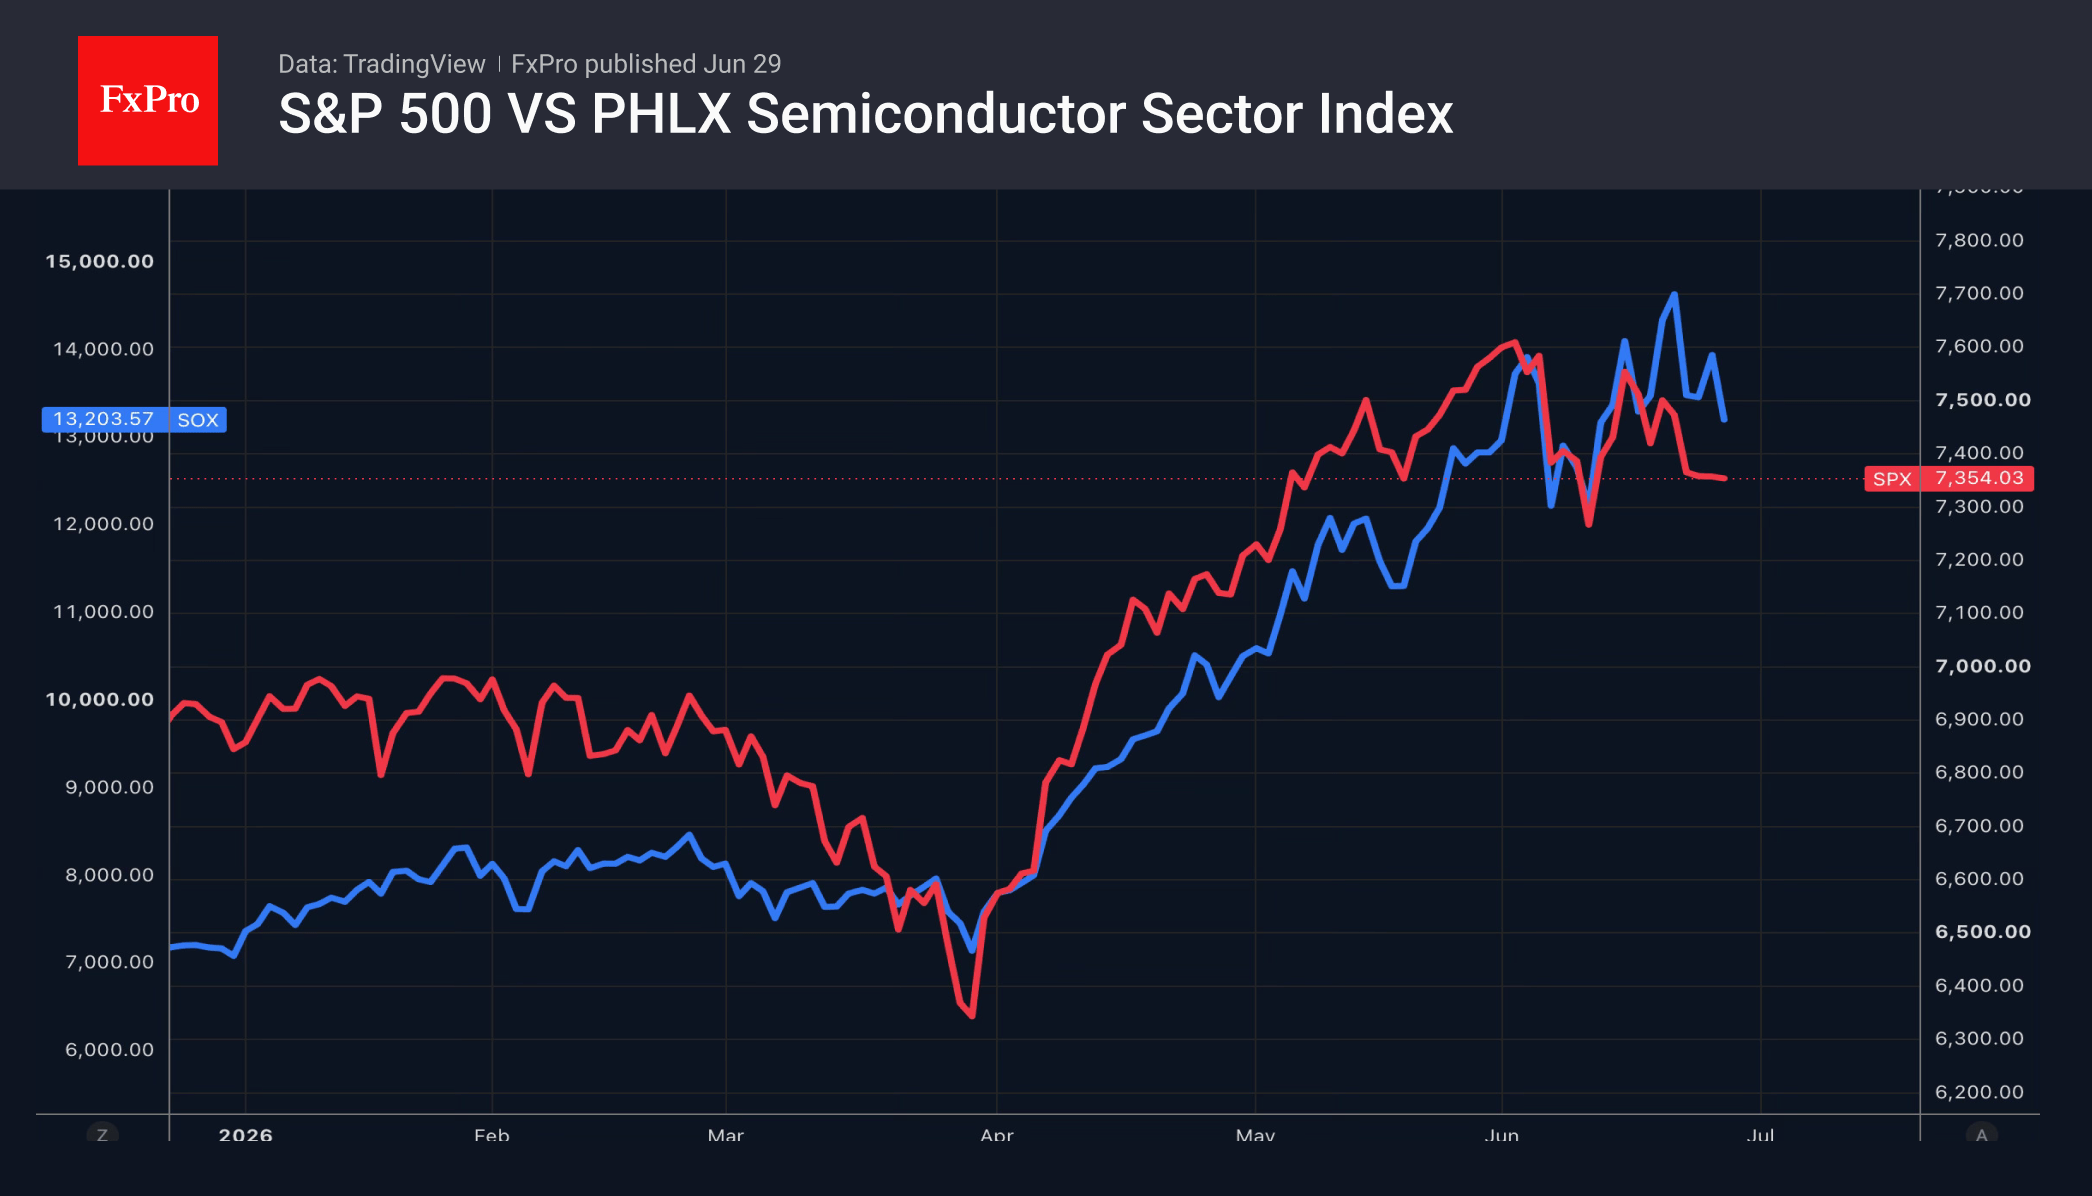
The Bank for International Settlements noted that the five largest hyperscalers intend to invest more than $1 trillion in artificial intelligence technologies in 2025–2026. If there is no return on investment, excessive capital expenditure will reduce profits and negatively impact the S&P 500. The BIS pointed out that previous instances in which very large sums were rapidly invested in new technologies led to serious consequences, including recessions. These include the construction of canals in the 1830s, the British railways in the 1840s, electrification in the late 1920s and the dot-com boom in the late 1990s.
Chip manufacturers will also face problems if their customers take a creative approach. For instance, in March, Micron’s market capitalisation fell by a third following Google’s developments in semiconductor alternatives. The prospect of technological breakthroughs that could reduce future demand for memory is alarming investors. This is particularly true given the rapid rally of the Philadelphia Stock Exchange Index in 2026. Talk of a bubble is gaining traction, prompting speculators to take profits on their long positions in the S&P 500 and causing a pullback.
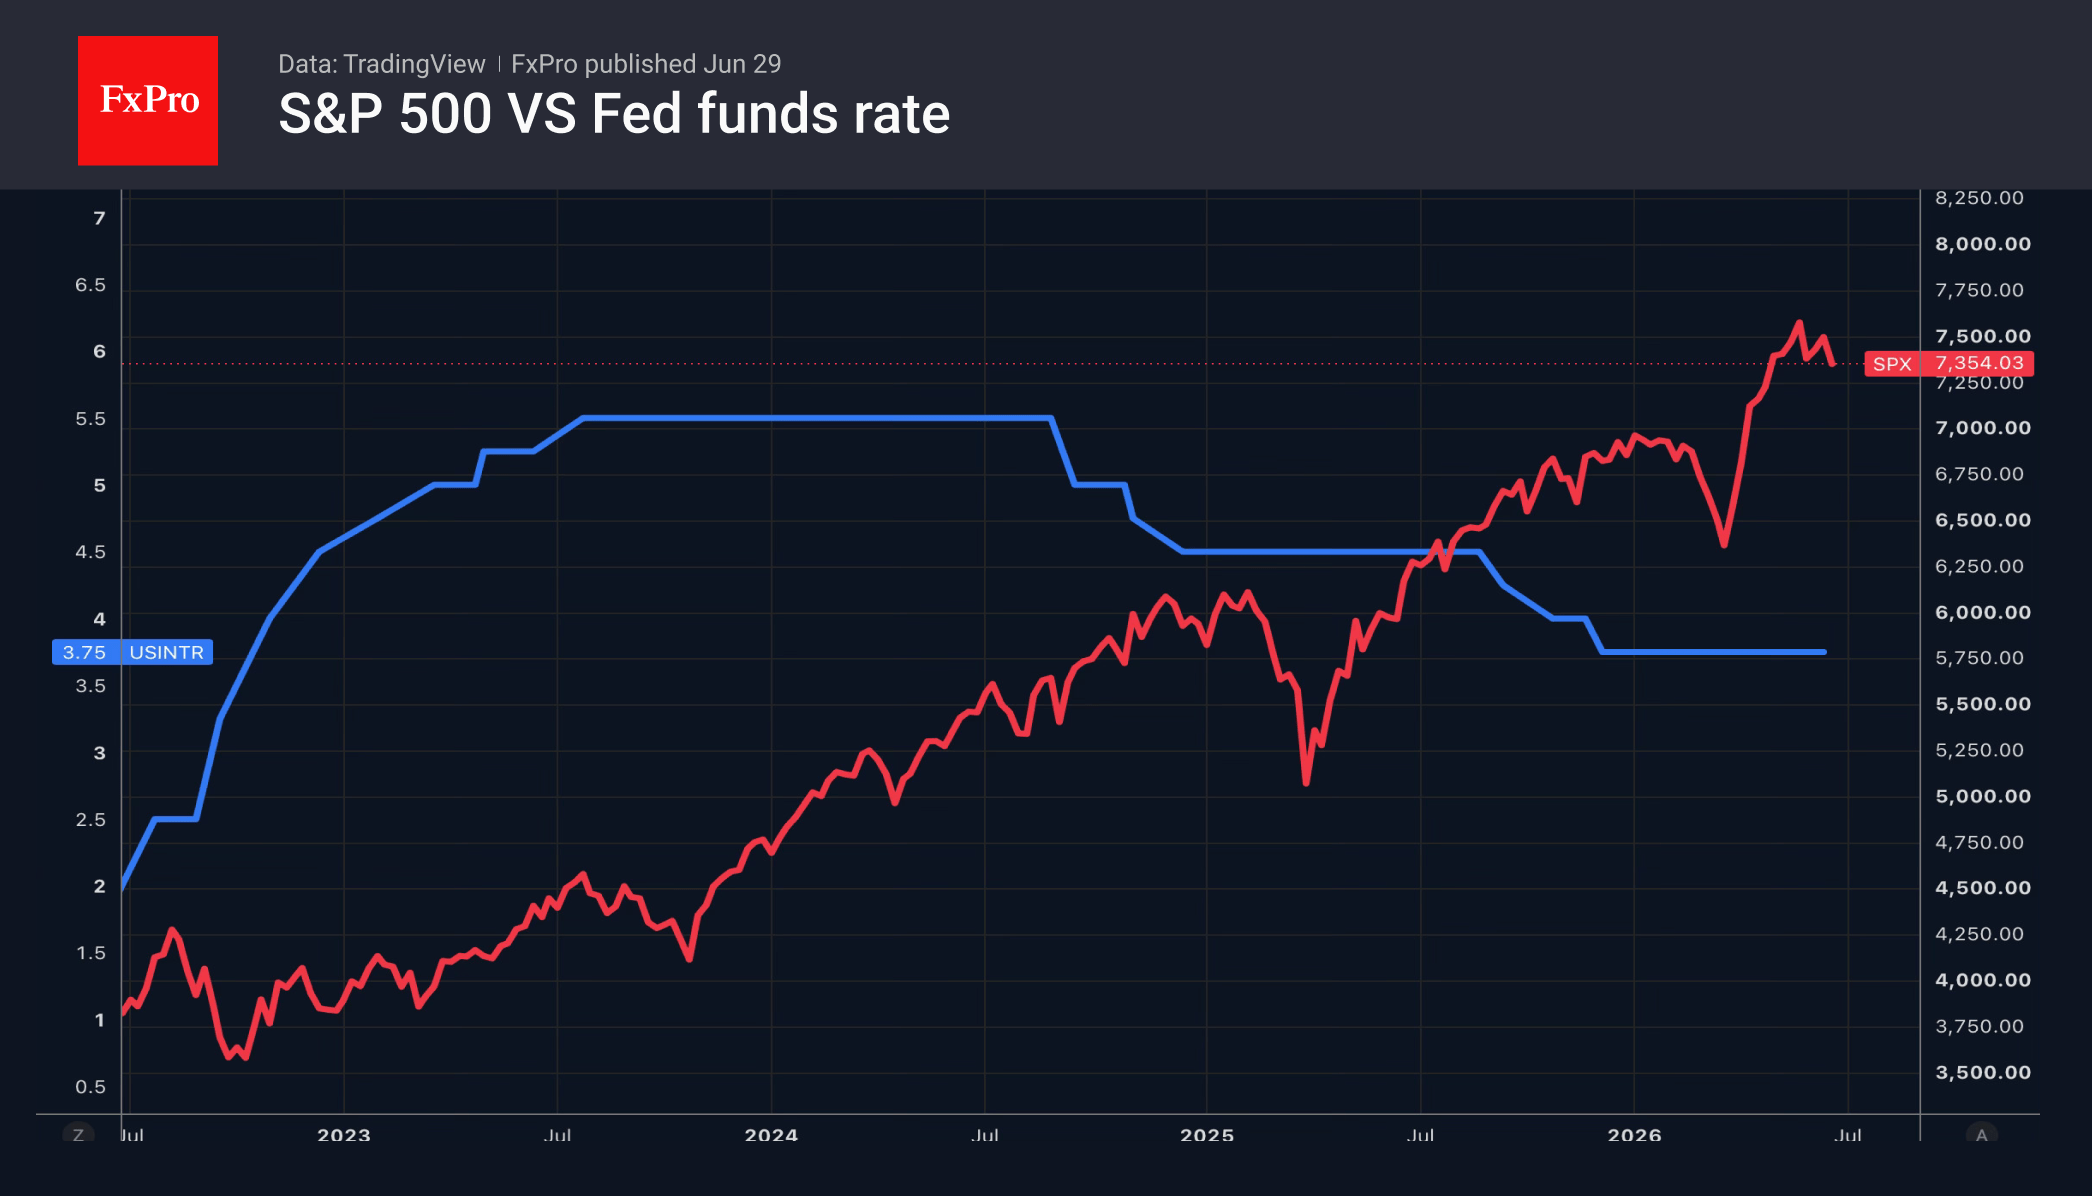
Add to this geopolitical factors and the Fed’s intention to raise rates to bring inflation back to target, and a correction in the broad stock index seems logical. The only question is: how deep will it go?
Nevertheless, these negative factors have not diminished the number of ‘bulls’ in the market among the major banks. Barclays has raised its forecast for the S&P 500 to 7,800 by the end of 2026. It expects strong earnings to outweigh fears about artificial-intelligence bubbles and Fed rate hikes. According to FactSet, Wall Street expects corporate earnings for companies in the broad stock index to rise by 24 per cent this year.
The FxPro Analyst Team
EUR/USD: The Advantage Remains with the Dollar
EUR/USD began the week trading around 1.1381. The US dollar has maintained its strong position following the hawkish outcome of the Federal Reserve’s June meeting. The updated projections from FOMC members confirmed the central bank’s willingness to continue tightening monetary policy, prompting markets to reassess the interest rate outlook. The probability of a rate hike in July is currently estimated at around 29%, while the likelihood of tightening in September has risen to approximately 60%.
In recent days, however, expectations have become slightly less aggressive. One reason has been the sharp decline in oil prices, which have returned to pre-conflict levels seen before the escalation in the Middle East. Lower oil prices have helped reduce inflationary concerns. Additionally, markets have largely priced in the Fed’s hawkish stance. Further appreciation of the US dollar is therefore likely to require fresh support from robust macroeconomic data, particularly employment and inflation data.
Until the release of these key reports, the dollar is expected to remain well supported. However, in the absence of new catalysts, a period of consolidation or a moderate correction cannot be ruled out. Market attention in the coming days will focus on labour market and inflation data, which will play a crucial role in shaping expectations for future Federal Reserve policy.
The outlook for the euro remains less favourable. Although the European Central Bank continues to pursue a tightening bias, much of the expected policy adjustment has already been priced into the market. Investors currently anticipate around 28 basis points of additional tightening by the end of the year, with the next ECB rate increase not expected before September.
The latest preliminary PMI data confirmed a further easing of inflationary pressures in the euro area, with price growth slowing to its lowest level since February. While business activity remains subdued, the pace of economic deterioration appears to have stabilised. An additional positive signal came from a recent ECB survey, which showed that consumers expect inflation to decline over the next 12 months and anticipate an improvement in economic conditions. While this supports the euro’s longer-term outlook, the near-term advantage remains firmly with the US dollar.
Technical Analysis
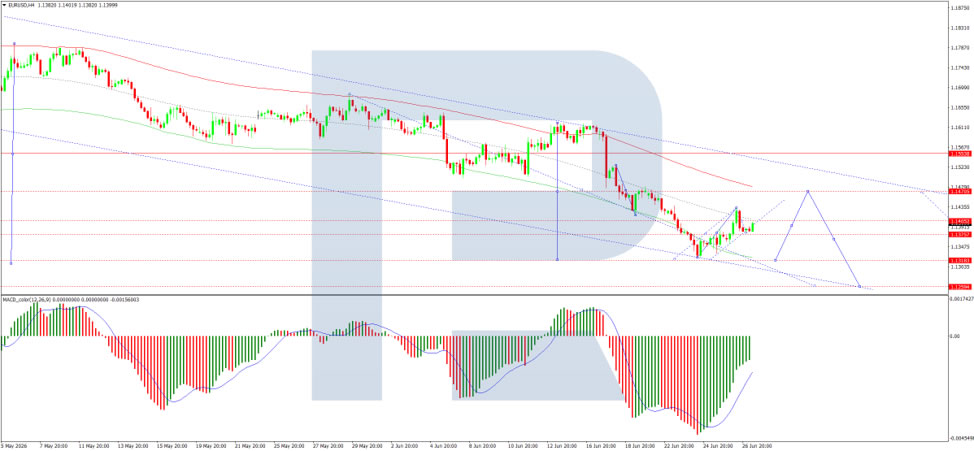
On the H4 chart, EUR/USD is trading within a consolidation range around 1.1405. The range currently extends between 1.1378 and 1.1414. A breakout to the upside could trigger a corrective move towards 1.1470, followed by a potential decline to 1.1385. Conversely, a downside breakout would open the way for a move towards 1.1315.
The MACD indicator supports the bearish scenario, with its signal line below zero and pointing firmly downwards, reflecting persistent negative momentum.
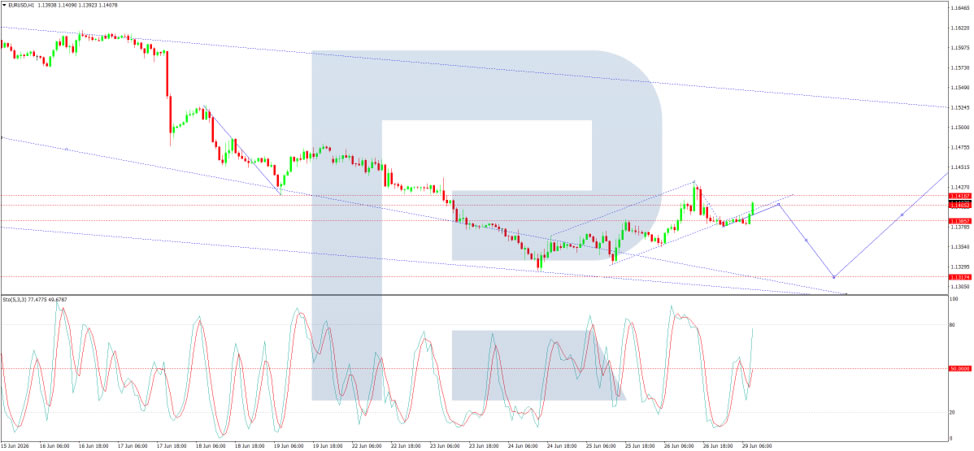
On the H1 chart, EUR/USD has reached 1.1414 and is now consolidating below this level. In the short term, the range may extend between 1.1369 and 1.1317, with further downside potential towards 1.1260.
The Stochastic oscillator confirms this outlook. Its signal line is currently near 80 and turning sharply lower towards 20, indicating weakening bullish momentum and increasing downside pressure.
Conclusion
EUR/USD remains under pressure as the Federal Reserve’s hawkish stance continues to support the US dollar. While falling oil prices and stabilising eurozone data have eased some concerns, investors remain focused on upcoming US employment and inflation reports. Unless these data disappoint significantly, the dollar is likely to retain its advantage in the near term.
Disclaimer
Any forecasts contained herein are based on the author's particular opinion. This analysis may not be treated as trading advice. RoboForex bears no responsibility for trading results based on trading recommendations and reviews contained herein.
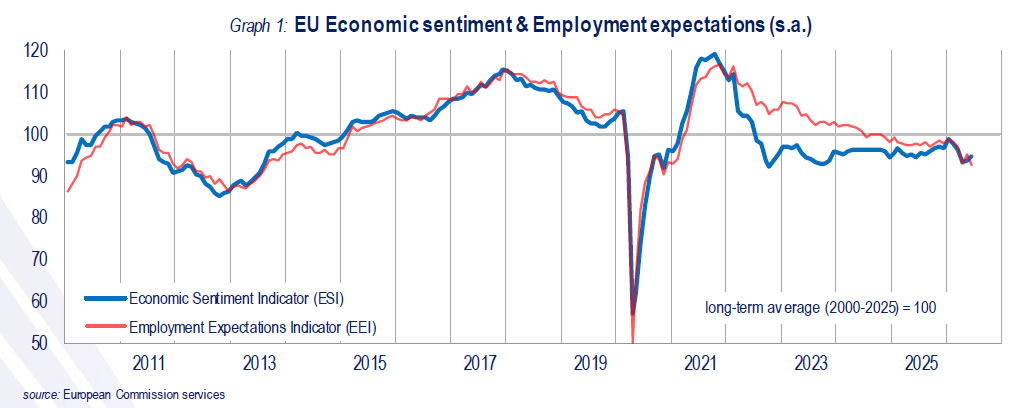
Eurozone Economic Sentiment Improves Further, But Hiring Expectations Weaken
Economic sentiment across the Eurozone improved further in June, suggesting businesses and consumers are becoming more optimistic about the growth outlook despite lingering economic headwinds. However, firms grew more cautious about hiring, highlighting a widening gap between improving confidence and labor market expectations.
Economic Sentiment Indicator (ESI) rose from 93.7 to 95.0 in the Eurozone and from 93.8 to 95.1 across the EU. Confidence improved in industry, services, retail trade and among consumers, while construction remained the only sector to deteriorate.
Among the largest member states, sentiment strengthened most in the Netherlands, Germany and Italy, while France was broadly unchanged. Industry benefited from improved production expectations and lower inventories of finished goods, while consumer confidence continued to recover as households became less pessimistic about the economic outlook and their future finances.
In contrast, the Employment Expectations Indicator fell from 94.4 to 92.2 in the Eurozone and from 95.2 to 92.9 in the EU, reflecting weaker hiring plans across services, retail trade and construction.
The survey nevertheless offered some encouraging inflation signals. Selling price expectations declined further across all major sectors, while consumers also reported easing perceptions and expectations of inflation, although both remained above historical norms. Economic uncertainty fell for a second consecutive month, suggesting businesses and households are becoming more confident even as employers remain cautious about expanding payrolls.
| Indicator | Previous | Latest |
|---|---|---|
| EU Economic Sentiment Indicator | 93.8 | 95.1 |
| Eurozone Economic Sentiment Indicator | 93.7 | 95.0 |
| EU Employment Expectations Indicator | 95.2 | 92.9 |
| Eurozone Employment Expectations Indicator | 94.4 | 92.2 |
| Industry Confidence | +0.6 pts | |
| Services Confidence | +0.5 pts | |
| Retail Trade Confidence | +1.2 pts | |
| Consumer Confidence | +1.2 pts | |
| Construction Confidence | -0.6 pts | |
| Economic Uncertainty Indicator | -1.2 pts | |
| Selling Price Expectations | Declined | |
| Consumer Inflation Expectations | Declined |