Sample Category Title
Forget the Level. Watch the Timing: Intervention Risks Rise as USD/JPY Hits 40-Year High
USD/JPY has broken to a fresh 40-year high, and with it, the market may have abandoned the wrong debate. Traders have speculated whether Japan would intervene at 160, then 162, then perhaps 163 or 164. But after another day of relentless Dollar buying and another round of ignored warnings from Tokyo, the more relevant question is no longer where intervention comes—it is when.
Japanese officials delivered all the familiar signals. Finance Minister Katsunobu Katayama said today that authorities were "standing ready to take action". Chief Cabinet Secretary Yoshimasa Kihara reminded markets that "bold actions are included as an option" alongside coordination with the United States. Yet USD/JPY barely paused. Traders appear convinced that Tokyo has little incentive to spend tens of billions of dollars defending the Yen just days before one of the year's most important macro events. If Thursday's US Non-Farm Payrolls report surprises to the upside, stronger Treasury yields and renewed expectations of aggressive Federal Reserve tightening could quickly erase any intervention-driven decline, leaving Japan with fewer reserves and less credibility.
That thinking has emboldened speculative accounts to keep testing higher levels. It also reflects a broader reality. This is not simply a weak-Yen story. The Dollar is appreciating against most major currencies as investors continue to favor the yield advantage created by the Fed's hawkish stance. Meanwhile, Prime Minister Sanae Takaichi's government has shown little sign of treating Yen weakness as a political emergency, reducing pressure on the Ministry of Finance to act immediately. Some market participants now believe Tokyo's tolerance has quietly shifted higher, making a move toward 163-164 conceivable before officials commit significant resources.
Ironically, delaying intervention could make it far more powerful. Rather than fighting the market ahead of payrolls, Tokyo may be waiting for the combination of an overstretched USD/JPY, a potentially disappointing employment report and the thin liquidity surrounding the US Independence Day holiday. Under those conditions, intervention would have a far greater chance of triggering a violent unwinding of leveraged long-Dollar positions than it would in normal market conditions.
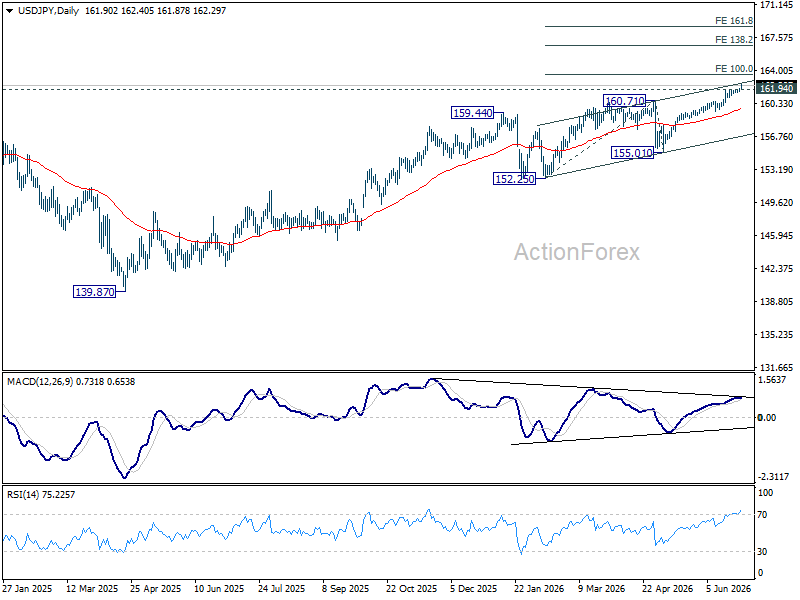
Technically, the decisive break above the 161.94 high from 2024 confirms resumption of the long-term uptrend. As long as 161.51 support holds, further gains are favored toward 100% projection of the 152.25 to 160.71 from 155.01 at 163.47. Some hesitation could emerge around that Fibonacci objective. But a decisive break of 163.47 would expose 138.2% projection at 166.70 next.
For now, the charts continue to support Dollar strength—but they also increase the probability that whenever Japan finally intervenes, it will be about maximizing impact rather than defending a specific number.
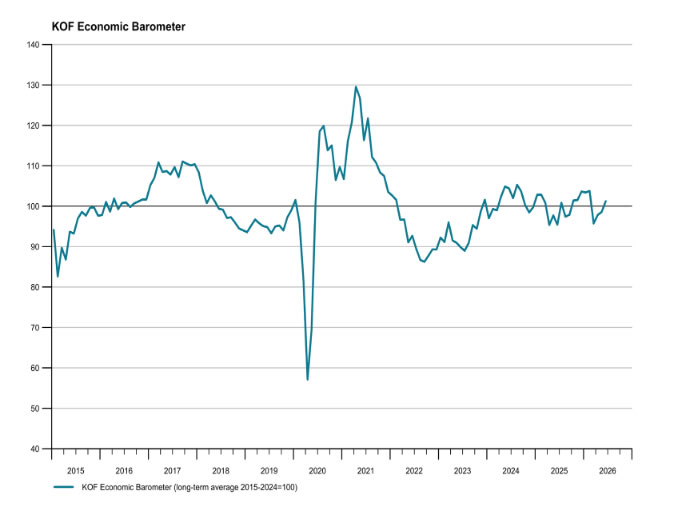
Swiss KOF Barometer Climbs Above Long-Term Average as Economic Outlook Improves
Switzerland's economic outlook improved noticeably in June as the KOF Economic Barometer rose from 98.6 to 101.2, comfortably beating expectations of 99.4 and moving back above its long-term average of 100. The latest reading suggests growth momentum is strengthening after several months of below-trend performance.
The KOF said the improvement was driven primarily by manufacturing, where production-related indicators showed a marked pickup. Demand-side indicators also strengthened, with both foreign demand and private consumption contributing positively to the outlook. "The outlook for the Swiss economy improves noticeably," the institute said, adding that the Barometer had risen "slightly above its average" after remaining below trend in recent months.
The survey points to a more balanced recovery in the Swiss economy, supported by both external and domestic demand. The improvement in foreign demand suggests Swiss exporters continue to benefit from resilient global activity, while firmer private consumption indicates households are becoming more confident. Together, the data reinforce expectations that the Swiss economy is regaining momentum after a softer start to the year.
| Indicator | Previous | Latest | Consensus |
|---|---|---|---|
| KOF Economic Barometer | 98.6 | 101.2 | 99.4 |
Chart Alert: USD/JPY Bullish Break Above 161.95 Signals Further Yen Weakness
Key takeaways
- USD/JPY has confirmed a major technical breakout. The decisive move above the long-standing 161.95 resistance suggests that bullish momentum remains firmly in place, with the pair entering a fresh medium-term impulsive advance despite increasingly forceful verbal intervention from Japanese officials.
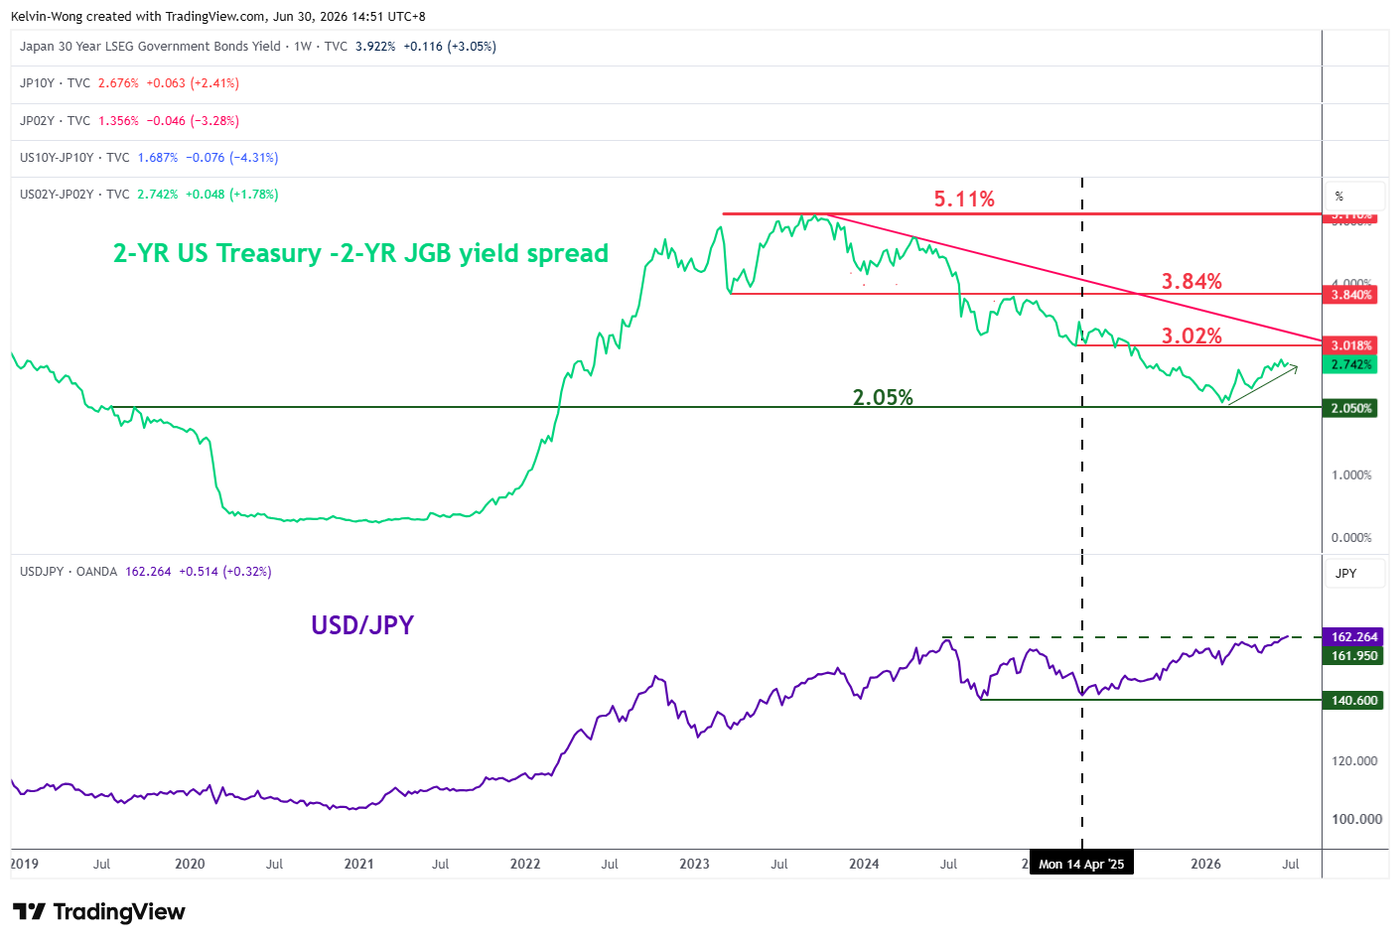
- Interest-rate differentials remain the dominant driver. The widening 2-year US Treasury-JGB yield spread continues to underpin dollar strength against the yen, as markets anticipate further policy tightening from the Federal Reserve while the Bank of Japan remains relatively accommodative despite its latest rate hike.
- Japan’s domestic policies are reinforcing yen weakness. A large-scale fiscal stimulus programme, combined with persistent foreign inflows into Japanese equities and associated currency hedging activity, is adding structural selling pressure to the yen.
- Verbal intervention alone appears insufficient. Unless Japanese authorities escalate to direct foreign exchange intervention or the US-Japan yield spread narrows materially, the path of least resistance for USD/JPY remains to the upside.
This is a follow-up analysis on the prior report, “Chart alert: USD/JPY advances toward the next 161.60/95 key intervention levels”, published on 10 June 2026
The price action of USD/JPY has advanced northwards as expected and cleared the key resistance level of 161.95, following the FX intervention in July 2022.
In today’s Asian session (Tuesday, 30 June 2026), the Japanese yen weakened to a 40-year low, printing 162.41 per US dollar despite verbal interventions from Japan’s Finance Minister Katayama and Chief Cabinet Secretary Kihara.
Why are verbal warnings being ignored?
The widening yield gap: While the Bank of Japan (BoJ) lifted its benchmark interest rate to “around 1%” in mid-June (its highest level since 1995), it remains severely behind the curve compared to Western developed central banks. With US rates at 3.50%–3.75% and the Fed expected to raise rates toward 4.00% under Chair Kevin Warsh, the nominal yield differential keeps JPY highly attractive as a funding currency for global carry trades
Given these circumstances, the 2-year yield spread between US Treasury notes and Japanese Government Bonds (JGBs) has continued to widen, now just above a major support level of 2.05%, and the yield premium has steadily increased to 2.74%, putting upside pressure on USD/JPY (see Fig. 1).
Takaichi’s aggressive fiscal package: Prime Minister Sanae Takaichi’s late-June unveiling of a massive $2.3 trillion public-private investment program over 14 years has reignited fears of structural fiscal expansion. This unchecked stimulus risks overheating the economy, causing long-term Japanese government bond (JGB) yields to rise in tandem with a weakening currency.
Nikkei 72,000 hedging blowback: The record-breaking rally in the Nikkei 225 past the 72,000 psychological level (printing an intraday all-time high of 72,832 on 22 June 2026) has been heavily fuelled by foreign capital pouring into Japanese AI and semiconductor equities. However, these inflows have been accompanied by aggressive currency hedging by foreign institutions, leading to immediate, heavy selling pressure on the spot JPY.
Fig. 1: 2-YR US Treasuries/JGBs yield spread with USD/JPY as of 30 Jun 2026 (Source: TradingView). The information presented is historical information, and past performance is not indicative of future performance.
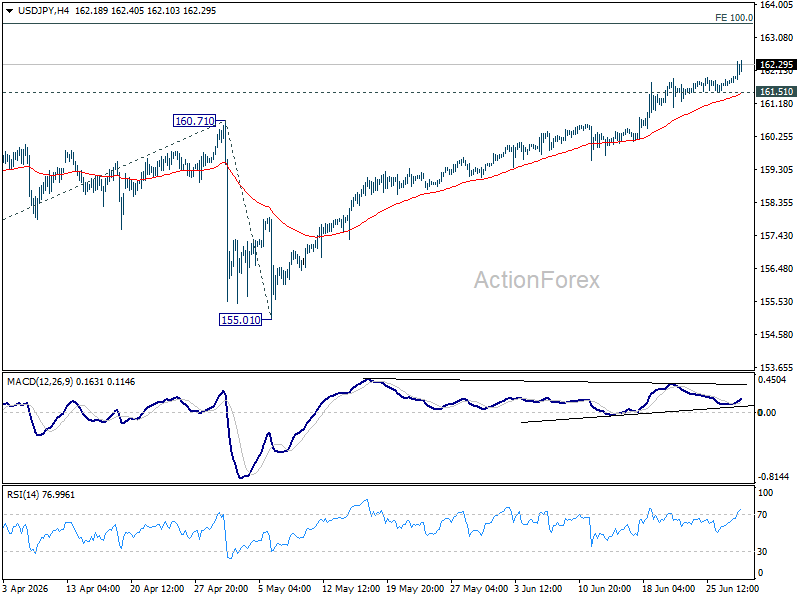
Let’s now focus on the short-term trajectory (1 to 3 days) of the USD/JPY from a technical analysis perspective.
Continues to oscillate within a minor ascending channel
Fig. 2: USD/JPY minor trend as of 30 Jun 2026 (Source: TradingView). The information presented is historical information, and past performance is not indicative of future performance.
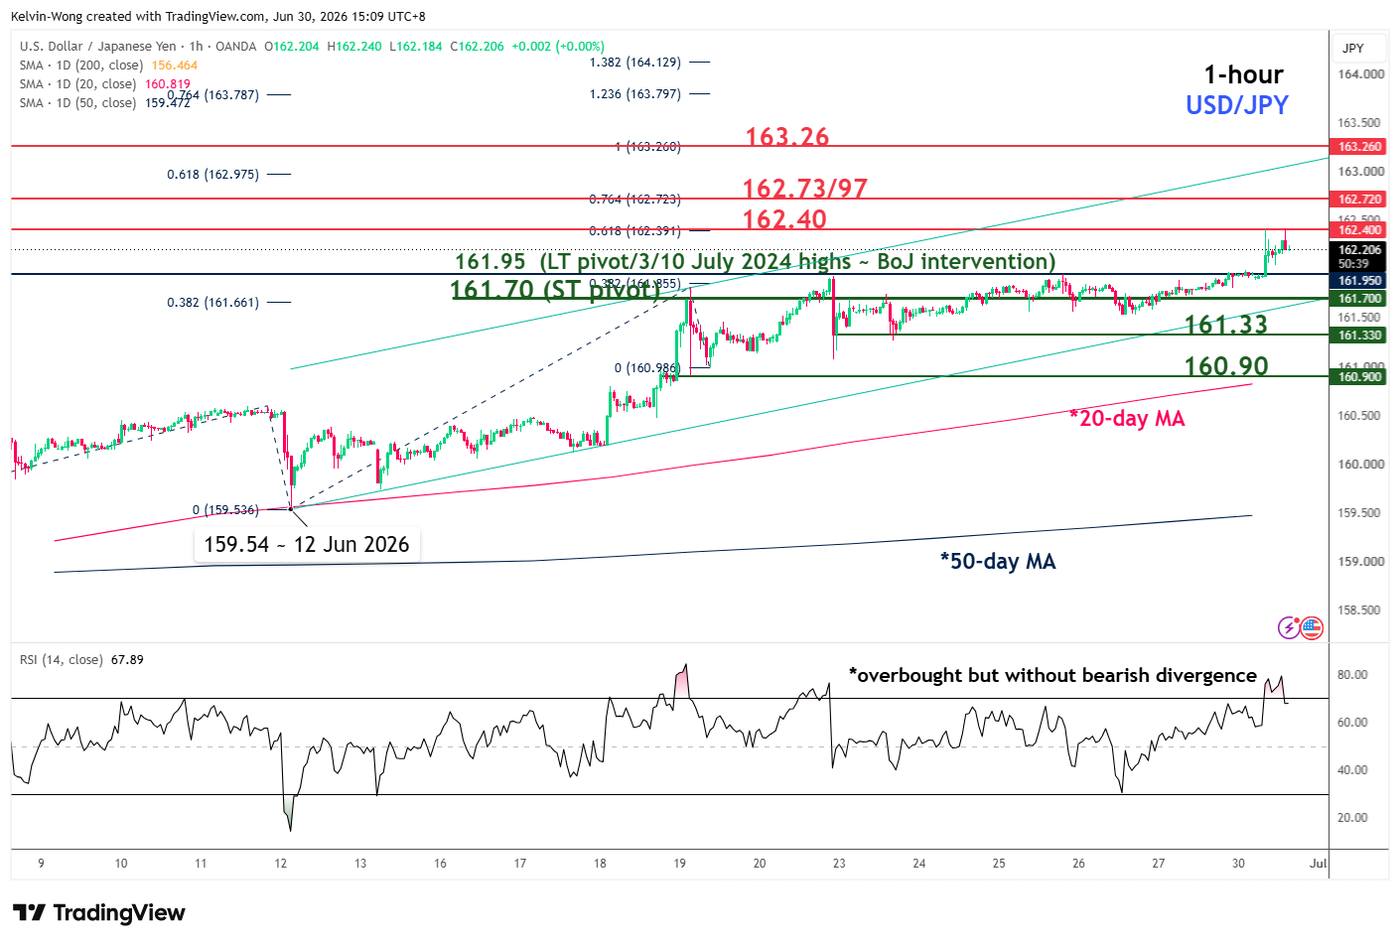
Trend bias: Minor uptrend remains intact with key short-term pivotal support at 161.70.
Resistances: 162.40 (Fibonacci extension), 162.73/97 (Fibonacci extension), 163.26 (Fibonacci extension & upper boundary of minor ascending channel) (see Fig. 2).
Next supports: 161.33 (22/23 Jun 2026 low), 160.90 (19 Jun 2026 low & 20-day MA)
Key elements to support the short-term bullish bias on USD/JPY
- Price action in USD/JPY continues to trade above the rising 20- and 50-day moving averages, suggesting that the minor and medium-term uptrend phases remain intact.
- The bullish breakout above a major range resistance at 161.95 increases the odds of a continuation of the medium-term (multi-week) bullish impulsive up-move sequence in USD/JPY.
NASDAQ-100: Price Concentrates Within the Market Profile Zone
Last week was one of the worst for US technology stocks since the beginning of 2026, with the index losing around 4.6% under the influence of two opposing factors. Firstly, the market continued to reassess the pace of returns on AI infrastructure investment — concerns that spending is outpacing actual returns triggered a sell-off in semiconductor stocks, with the Philadelphia Semiconductor Index falling nearly 8% over the week. Secondly, the US-Iran conflict surrounding the Strait of Hormuz escalated over the weekend: Tehran claimed responsibility for attacks on commercial vessels, while the US responded with air strikes. By Monday morning, tensions had eased somewhat as both sides announced a temporary halt to hostilities and agreed to hold talks in Doha on Tuesday. Against this backdrop, Nasdaq-100 futures gained around 1.1%.
Technical Picture
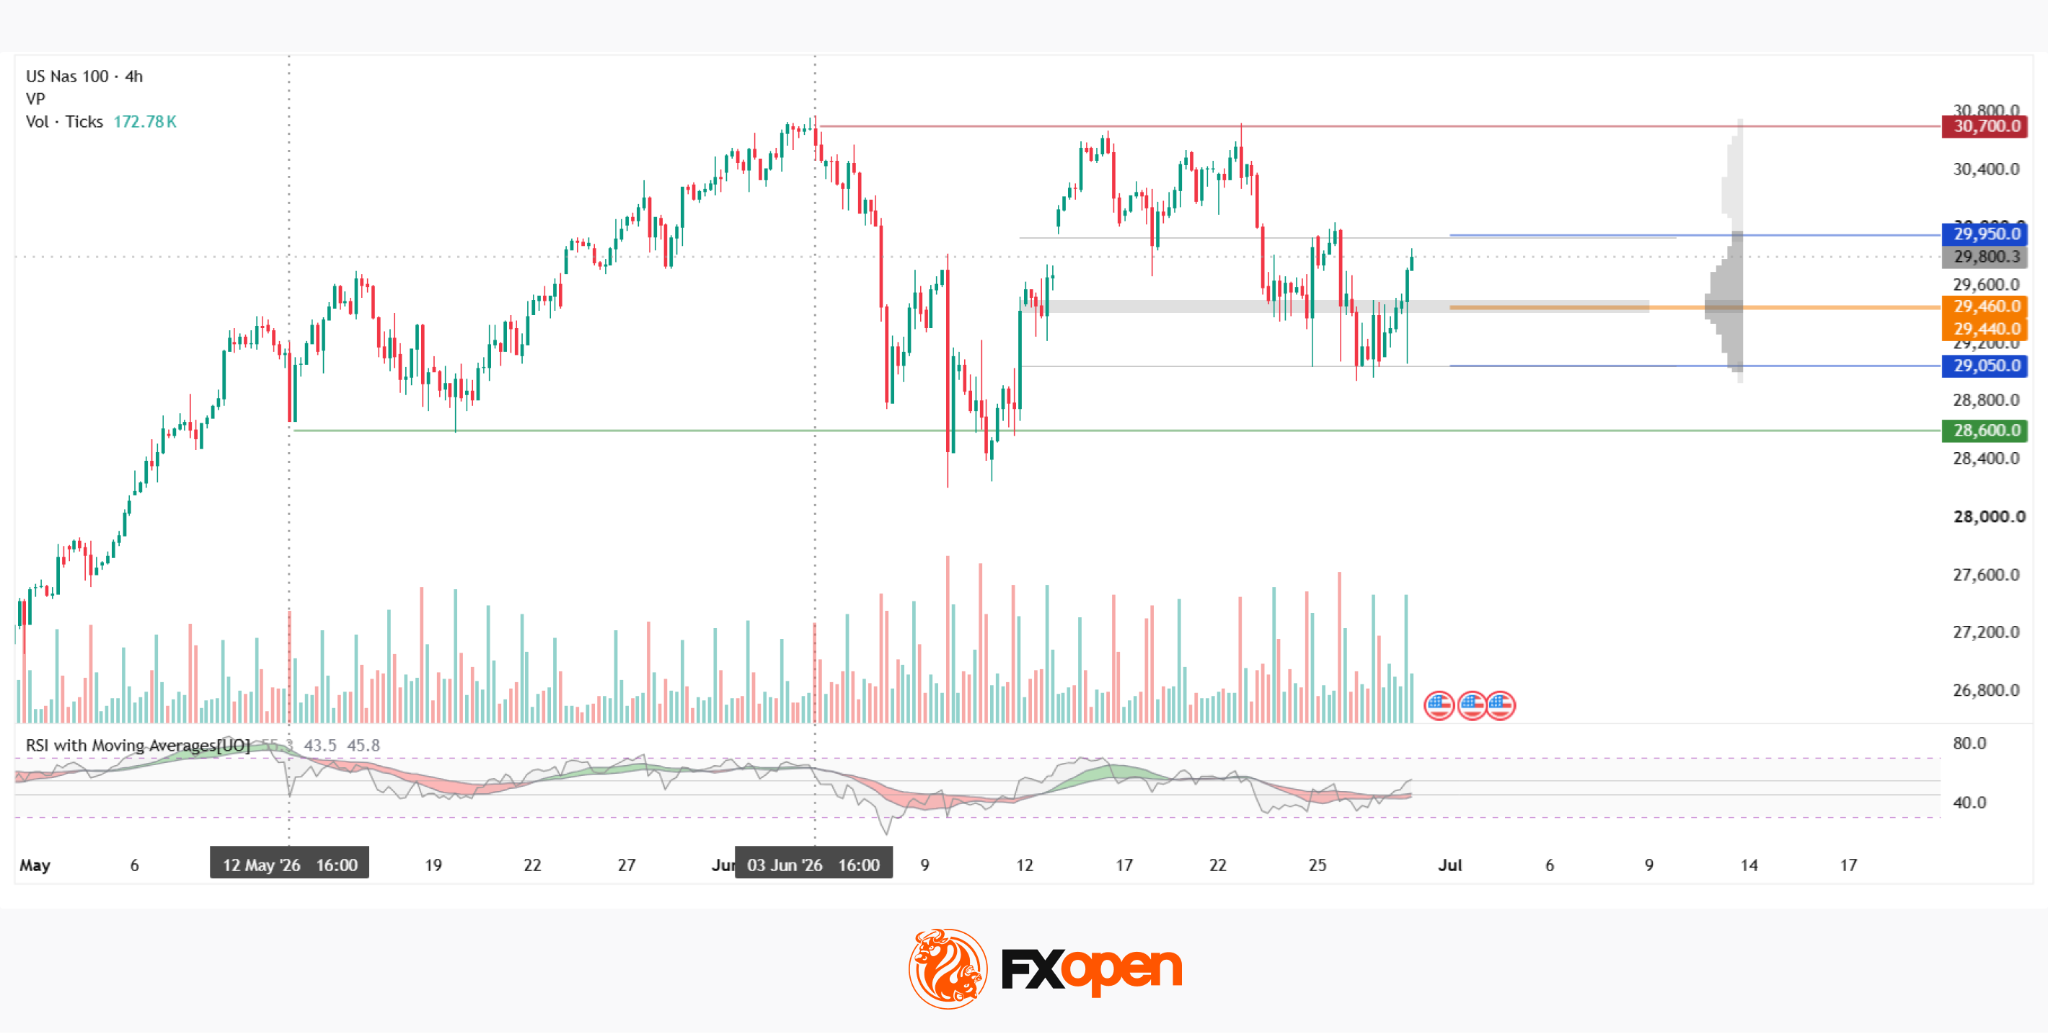
On the four-hour chart, the Nasdaq-100 (NDXm on FXOpen) has been trading within a sideways range since May, bounded by support near 28,600 and resistance around 30,700 — a range that formed following the June peak. After reaching that peak, the index experienced a sharp decline on 9 June, accompanied by exceptionally high trading volume. As a result of buyers defending the local lows, the price has since concentrated near the centre of the current range.
At present, the price is holding above the POC zone at 29,440–29,460, which may be viewed by market participants as the key point of attraction within the range. The price is approaching intermediate resistance at the upper boundary of the profile at 29,950, above which lies the red resistance level. RSI + MAs shows readings of 55, 43 and 45 — the oscillator remains above both moving averages, although the moving averages have yet to confirm a potential reversal and remain near the lower boundary of the neutral zone.
Key Takeaways
News of a pause in the US-Iran conflict supported the Nasdaq-100 at the market open, although concerns surrounding AI-related spending remain unresolved and were the primary driver of price action throughout June. The POC zone continues to serve as the key reference point for the balance between supply and demand: this is where the largest concentration of horizontal volume is located, and holding above this area could indicate that the market is preparing to continue its move towards the upper part of the range.
Trade global index CFDs with zero commission and tight spreads (additional fees may apply). Open your FXOpen account now or learn more about trading index CFDs with FXOpen.
This article represents the opinion of the Companies operating under the FXOpen brand only. It is not to be construed as an offer, solicitation, or recommendation with respect to products and services provided by the Companies operating under the FXOpen brand, nor is it to be considered financial advice.
ECB’s Lane: Lower Oil Prices Will Take Time to Feed Through Economy
European Central Bank Chief Economist Philip Lane said policymakers will remain flexible on interest rates as they assess how the recent decline in oil prices feeds through the economy, emphasizing that it is too early to draw conclusions about the inflation outlook. His remarks reinforce the ECB's data-dependent approach ahead of the next policy meeting.
Lane told BloombergTV that the Governing Council is committed to "not boxing ourselves in" on the trajectory for monetary policy, leaving open the possibility of another rate increase if inflation pressures prove more persistent than expected. While acknowledging that "the oil market has moved quite a bit since the last decision," he cautioned that policymakers need to "see how lower oil percolates across the economy" before adjusting their assessment of inflation risks.
Lane also suggested that confidence has yet to fully recover despite easing geopolitical tensions. "There has been some improvement in confidence but not to pre-war levels," he said, adding that "there hasn't been fast rethinking of investors and consumers." He also noted that oil prices for 2027 and 2028 are still expected to remain above pre-war levels, indicating that the ECB continues to see medium-term energy costs as a factor supporting a cautious approach to monetary policy.
Sunrise Market Commentary
Markets
US and EMU bond markets took a wait-and-see attitude yesterday ahead of a series of key eco data later this week that will help shape expectations on central bank policy going forward (EMU June CPI on Wednesday, US consumer confidence & JOLTS job data today, US manufacturing ISM and ADP job report on Wednesday and US payrolls on Thursday). US yields yesterday changed less than 2 bps across the curve. German yields rose marginally (2-y +2.3 bps, 30-y +0.4 bps). Brent oil ($73/72 area) is holding near the post-war lows even as military action over the weekend underscored the fragility of the ceasefire ahead of new talks scheduled for this week. At the same time, Iran indicated that still aims to keep control over any traffic through the Strait of Hormuz (with or without the cooperation of Oman). US equity markets regained their composure, rebounding from tech-related uncertainty last week (S&P +1.17%, Nasdaq +2.07%). On FX markets, the dollar was still in some kind of consolidation mode after a strong run since mid-June (supported by Fed Chair Warsh anti-inflation commitment at the June 17 Fed meeting). EUR/USD tried to regain the 1.14 market (close 1.1422, but returning back below 1.14 this morning). USD/JPY yesterday extensively tested the key 161.95 2024 top with a break higher to a four-decade yen low this morning (162.2). Until now, Japanese authorities didn't show up with more than verbal interventions to act against further yen erosion.
Yesterday evening after the close of the European markets, Chair Lagarde at the ECB forum in Sintra elaborated both on the reaction of the EMU economy and at the same time on the ECB reaction function in this new era. In the first place, the EMU economy showed resilience to a series of shocks over the previous years. This has reduced the need to use unconventional or forceful policy measures. The reaction of authorities to shocks often caused the outcome to be different from what it was in the past. Lagarde also assessed that these shocks have the capacity to escalate sharply, but also to swiftly unwind. This often put the CBs, including the ECB, in an intermediate zone between shocks they can look through and those they must react to forcefully. In this context, Lagarde also elaborated on the values of scenario analysis as core part of the decision making process with the bank having moved from 'forward guidance' to 'framework guidance'. As the market apparently understood the reaction function of the ECB quite well as the energy shock this year developed, it allowed the bank to take some more time to take robust decisions. This has created the space for monetary policy to go back to the basics: stabilising inflation with policy rates as a primary tool, acting in a measured way, and taking decisions meeting by meeting. Maybe in some way, there is also some kind of link/resemblance with Fed Chair Warsh pointing to the market reaction/value of market pricing as an important input for CB policy. Market current still prices one additional ECB rate hike by e.o.y.
News & Views
Shop price inflation in the UK was 1.2% y/y in June, the same as in May, the UK's British Retail Consortium said today. Food inflation decelerated from 2.7% to 2.4%, which BRC's chief executive Dickinson said was thanks to bumper crops and strong competition. Non-food prices rose 0.6%, slightly up from the 0.5% last month. Promotions across summer essentials in clothing have helped to keep a lid on this category. Dickinson warned that while a competitive market is keeping overall inflation in check right now, retailers are facing "mounting cost pressures, including higher National Insurance, the triple packaging tax and higher input costs from extreme weather and geopolitical tensions".
The US Supreme Court yesterday in a majority decision limited the president's power to remove Fed governors when doing so for "good reason". After being accused of mortgage fraud, president Trump sought to fire Fed governor Cook on the basis of "good reason". The Supreme Court considered this wasn't the case, allowing Cook to stay on board while the case is being resolved. However, the Court handed the president an important victory in a second ruling, which states that federal agencies that wield executive power must be ultimately answerable to the president. That means Rebecca Slaughter, the Democratic official at the Federal Trade Commission who was fired by Trump last year and at the center of the Supreme Court case, remains permanently dismissed. In a broader perspective, the ruling cleared the way for POTUS to fire, without cause, officials from many other similar agencies, including key ones such as the Securities and Exchange Commission.
European Currencies Enter Consolidation Ahead of Key Macroeconomic Data
Following the US dollar's notable strength last week, European currencies have entered a period of consolidation. Investors and market participants have temporarily reduced trading activity ahead of a series of key macroeconomic releases from the euro area, the UK and the US, which could determine the next direction for EUR/USD and GBP/USD. At the same time, markets continue to monitor developments in the Middle East, as easing geopolitical tensions have somewhat reduced demand for safe-haven assets, allowing investors to shift their focus back to economic fundamentals.
Investor sentiment has also been supported by reports suggesting that the US and Iran may be close to reaching an agreement to halt mutual strikes and resume negotiations. The restoration of shipping through the Strait of Hormuz has reduced concerns over disruptions to global oil supplies and contributed to greater stability across financial markets. Nevertheless, ongoing disagreements over the situation in the Strait of Hormuz and conflicting statements from Iranian officials indicate that geopolitical risks have not yet fully subsided.
EUR/USD
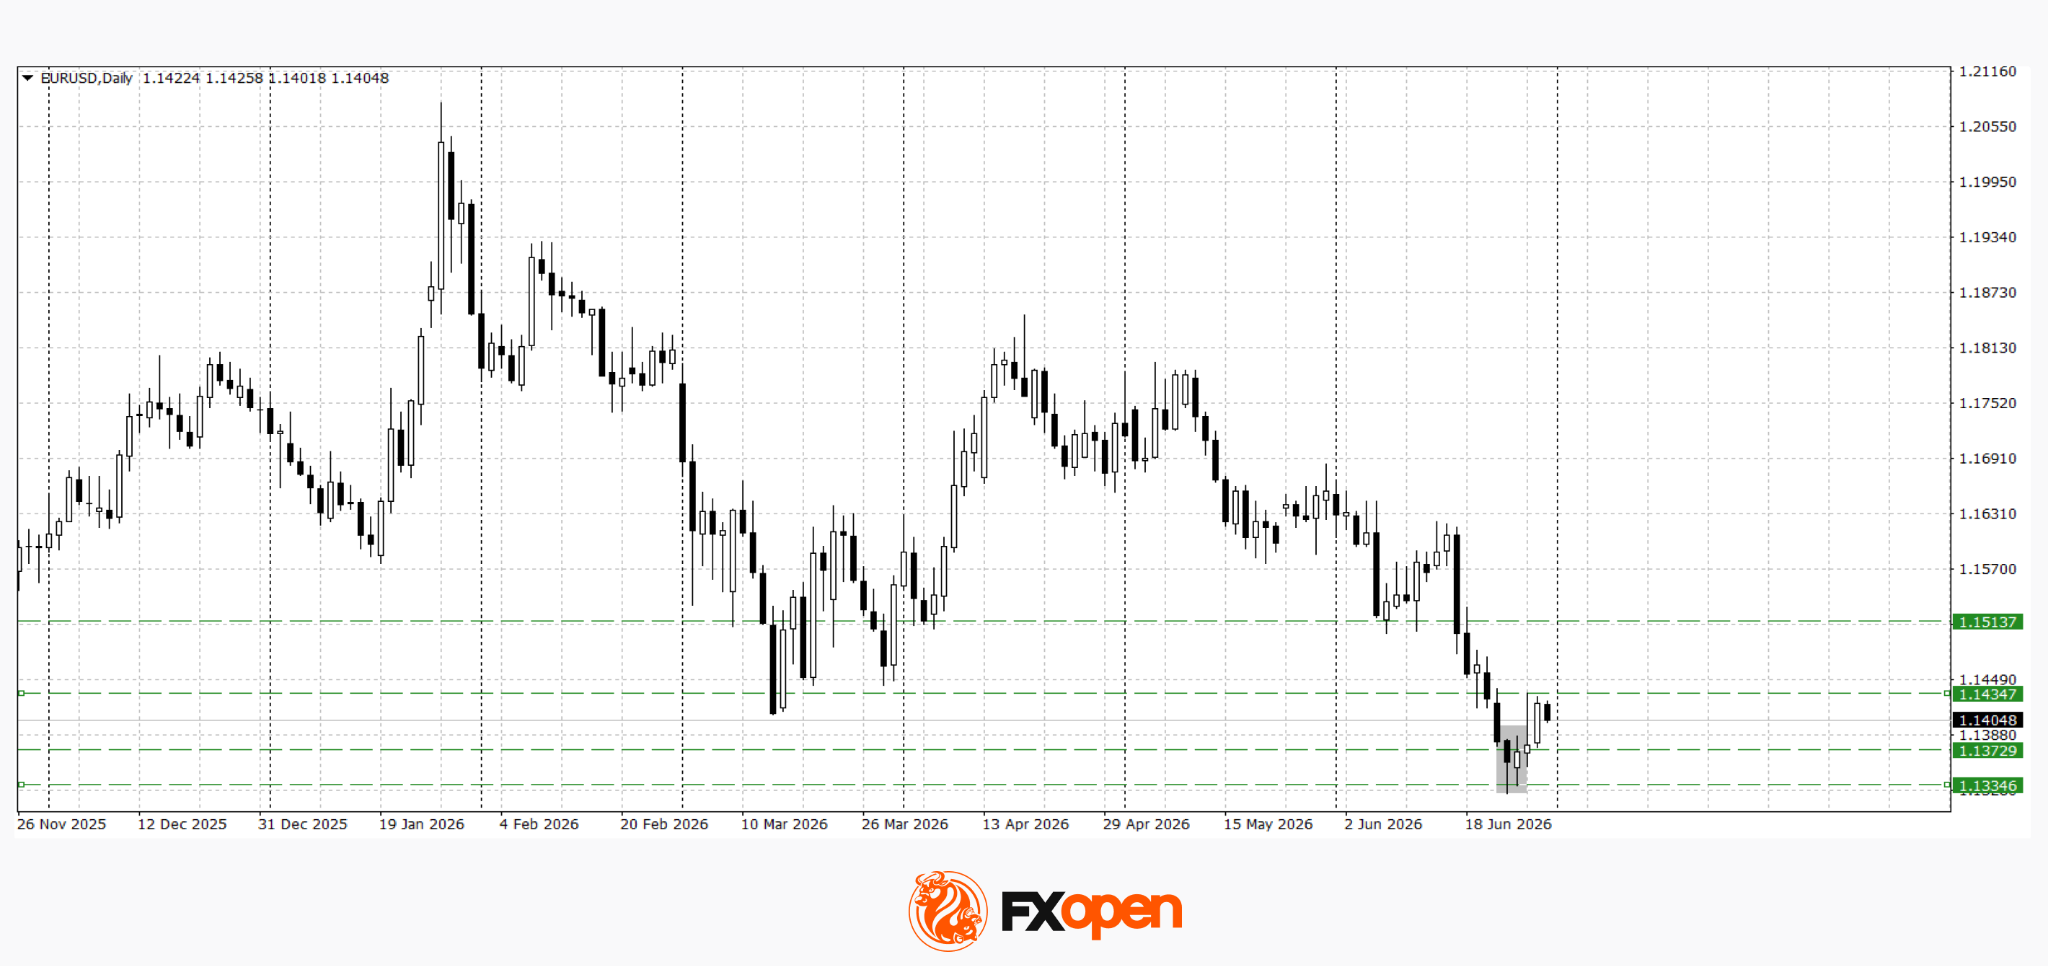
Following a test of the March low, a bullish Piercing Line candlestick pattern formed on the daily timeframe. Technical analysis suggests that EUR/USD is trading within a sideways range between 1.1340 and 1.1430. Price action around these boundaries, together with the incoming macroeconomic data, should provide further clues regarding the pair's next directional move.
Key events for EUR/USD:
- Today at 09:45 (GMT+3): France CPI.
- Today at 15:00 (GMT+3): Germany CPI.
- Today at 17:00 (GMT+3): US JOLTS Job Openings.
GBP/USD
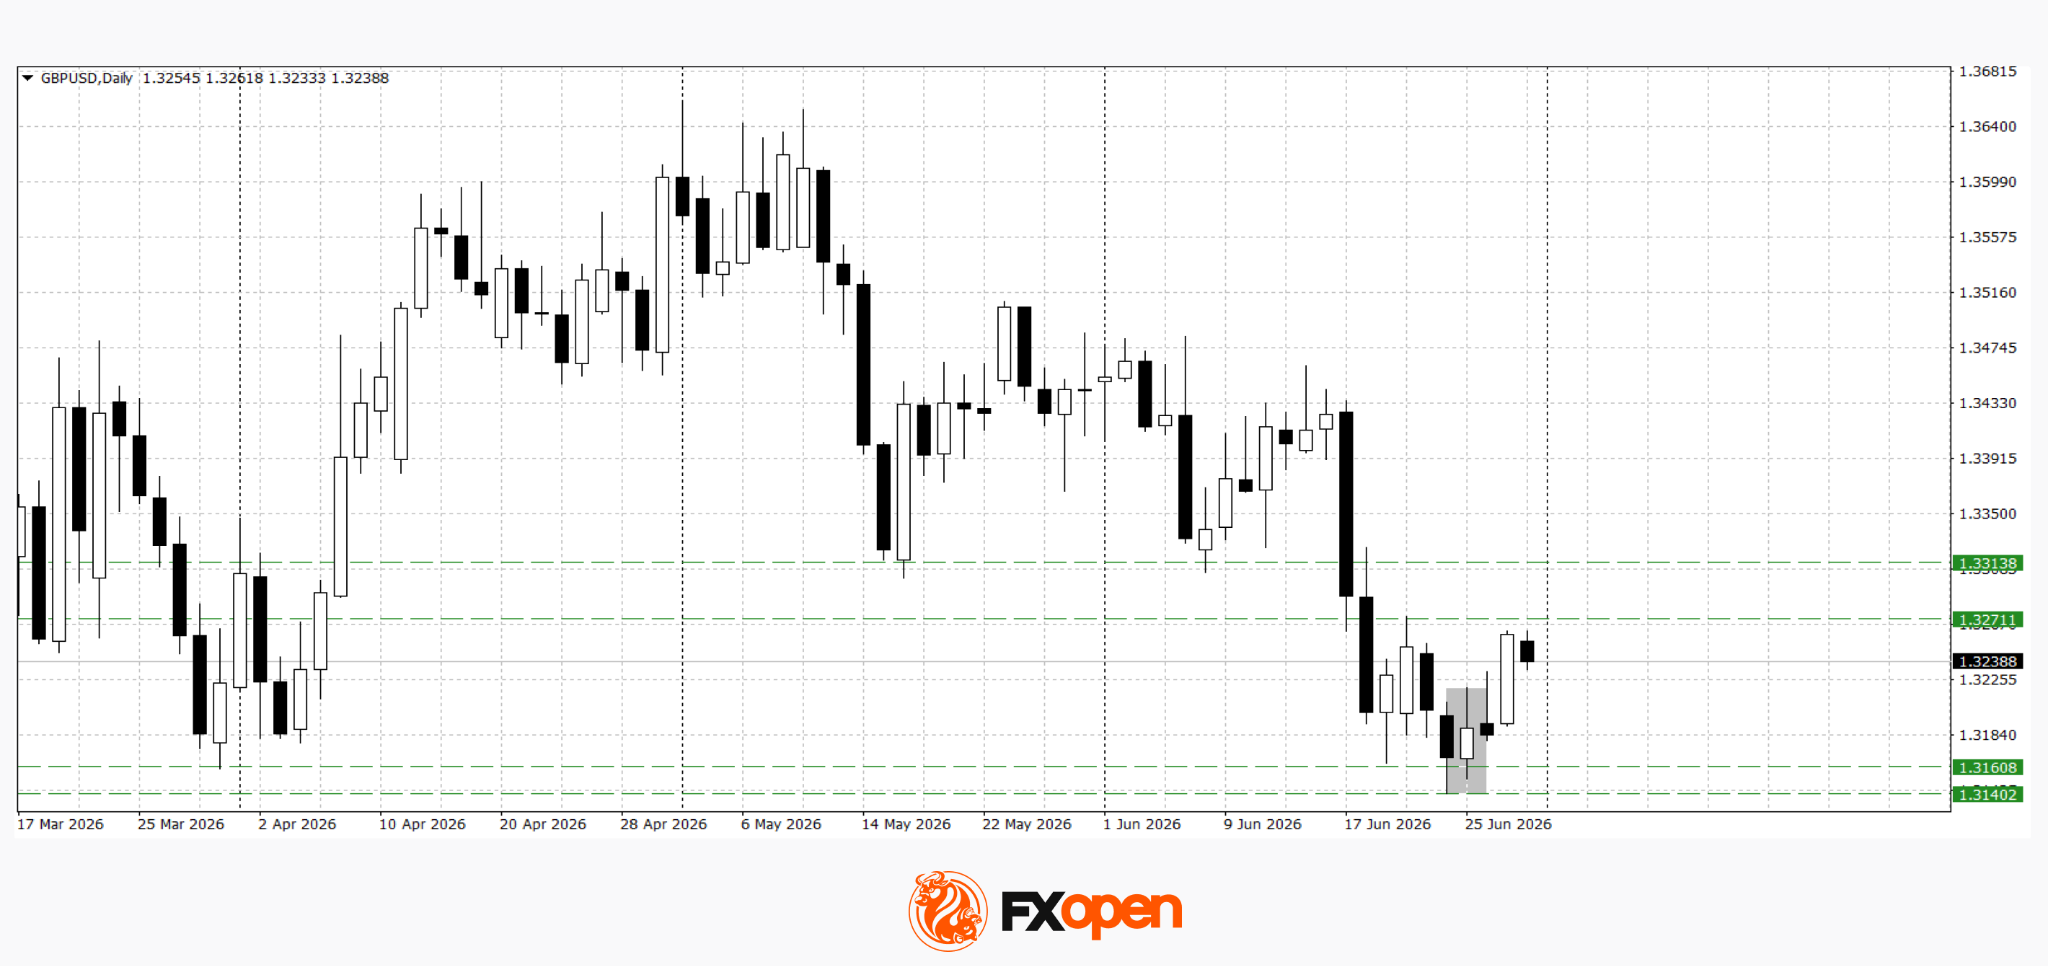
After testing this year's March low at 1.3160, sterling buyers regained the initiative and formed a bullish Piercing Line candlestick pattern. The pair has since rebounded towards 1.3270, although any further upside is likely to depend on incoming macroeconomic data. Technical analysis suggests the pair may retest the 1.3270 level. A decisive break and close above this resistance could pave the way for further gains towards 1.3300–1.3310, while rejection from current resistance may trigger a decline back towards the 1.3140–1.3160 area.
Key events for GBP/USD:
- Today at 09:00 (GMT+3): UK GDP.
- Today at 13:40 (GMT+3): Speech by Bank of England Financial Policy Committee member Sarah Breeden.
- Today at 17:00 (GMT+3): US CB Consumer Confidence Index.
Following the sharp moves seen in recent sessions, the foreign exchange market has entered a wait-and-see mode. The release of key economic data on both sides of the Atlantic is likely to determine whether the current consolidation becomes the starting point for a recovery in European currencies or gives way to a renewed strengthening of the US dollar.
Trade over 50 forex markets 24 hours a day with FXOpen. Take advantage of low commissions, deep liquidity, and spreads from 0.0 pips (additional fees may apply). Open your FXOpen account now or learn more about trading forex with FXOpen.
This article represents the opinion of the Companies operating under the FXOpen brand only. It is not to be construed as an offer, solicitation, or recommendation with respect to products and services provided by the Companies operating under the FXOpen brand, nor is it to be considered financial advice.
Preview of RBNZ: Keep Calm and Focus on the Data
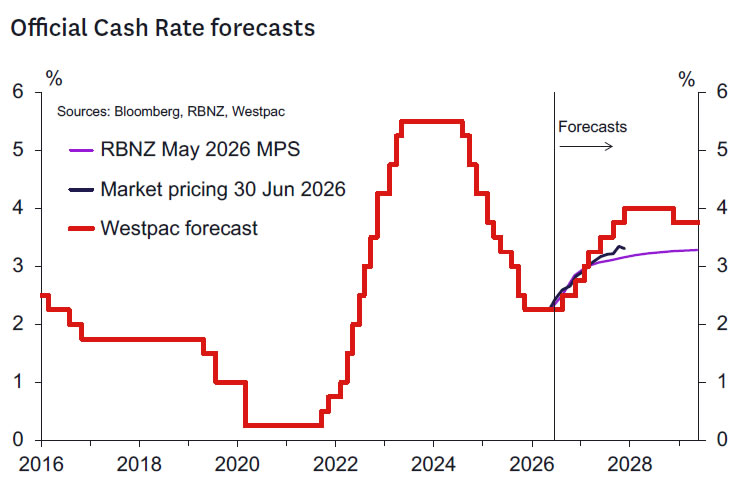
- We expect the RBNZ to leave the OCR at 2.25% at the 8 July Review.
- Much has changed over the past six weeks. Therefore, while three MPC members had voted for a rate hike in May, we think the "on hold" decision may well be reached by consensus.
- Forward guidance should remain consistent with a lift in the OCR this year. However, the message is expected to be more data dependent than came across at the May Statement.
- The press release will likely reaffirm that the timing of OCR increases will depend on what data and other developments suggest about the outlook for medium-term inflation pressures.
"What we're saying is it's likely we'll see OCR hikes at coming meetings, but we're not being, you know, exact... how much and at what meeting because we will consider, you know, the incoming data and how the inflation outlook evolves. So, if we see oil prices falling really much more than expected, if we see much much weaker growth, then we may not hike."
- Governor Anna Breman, Heather du Plessis-Allan Drive interview, 27 May 2026
RBNZ Decision and Communication
We expect the OCR to remain at 2.25% at next week's 8 July policy meeting. A tightening bias will remain in place that will be explicitly data dependent. In determining when that bias might be acted upon, key factors cited will be the extent of second round pricing pressures, wages pressures and evidence of increasing medium to long term inflation expectations. Evidence that the economic recovery is resuming and the output gap narrowing would also prompt policy tightening at some stage, as was the RBNZ's forecast in the February Statement. The language pointing to OCR increases as likely in coming meetings could be kept but with a more explicit rider that these are conditional on evidence warranting those increases.
While three MPC members voted for a rate hike in May, the significant developments over the past six weeks make it quite possible that a vote is not required on this occasion. It would be perfectly reasonable for those previously hawkish members to change their view given the relatively quick resolution of the Iran tensions have caught most if not all commentators by surprise. Data dependence is a virtue not a failing in a well-functioning MPC.
Should a vote be needed, then we expect only a small minority of external members to support an OCR increase in July. We don't think any of the doves from the May meeting will want to join the hawkish group. There is also a strong prospect that the hawks from last time will be happy to review the key data that will be released in the weeks that follow the July meeting and raise the case for an OCR rise at the September meeting, should that data support that stance.
The discussion will aim to redirect market attention on upcoming data to justify future OCR hikes. Markets became unduly fixated on a July hike after the May meeting and saw it as relatively independent of incoming data and developments in the Middle East, which was unfortunate. We expect the MPC to take the opportunity to correct that impression.
Prospects for a normalisation of the OCR will remain a feature of the RBNZ's communication. But we expect the Bank to shift the frame of reference towards the view the MPC held pre-war. This envisaged a single OCR hike no sooner than the end of this year. As inflation is still higher than anticipated back in February, we think they will signal bringing forward of the date of lift off in the OCR to September but suggest a gradual trajectory from there if second-round inflation pressures from the Middle East supply shock remain in check. The option of consecutive increases in the OCR from September might still be a possibility but would not be presented as base case and would be dependent on data warranting a less gradual cadence of OCR increases. We don't expect the MPC to present a September OCR increase as a given. A slow bounce back of economic activity and evidence of weak underlying inflation pressures in the June quarter CPI could justify delaying to December and thus moving the RBNZ's stance all the way back to that communicated in the February 2026 Statement. Reintroducing data dependence into the MPC's future decision-making framework will aim to preserve the option to push the tightening cycle back to December should data suggest that appropriate.
We expect market pricing to take a bit more out of the amount of tightening expected for 2026 and move to a situation where markets price between one and two 25bp increases by year end. From there the data will determine how market pricing evolves.
Arguments in Favour of a Hike
The most prominent argument we have heard among market participants expecting a July hike is that this was more-or-less promised in the May Statement. It's certainly the case that the RBNZs Q3 2026 assumption of an average OCR of 2.51% is most consistent with a July hike and for some members a July hike may have been the presumption in the absence of a marked change in the inflation outlook. But we certainly don't agree that a hike was in any way promised.
The Governor described OCR increases "in coming meetings", which was deliberately and appropriately vague given the uncertain nature of the environment. The quote we included on the front page of this note illustrates the conditionality of the policy outlook. The Governor explicitly noted in a radio interview after the May meeting that "... if we see oil prices falling really much more than expected, if we see much much weaker growth, then we may not hike". And in various speaking engagements the Governor has referred to a desire to see evidence of second-round pricing dynamics, rising wage pressures and increasing inflation expectations to confirm that any earlier hike in the OCR was necessary. No such evidence has accumulated since May. Similarly, in her public appearances, Assistant Governor Silk has noted that all options were on the table for the July meeting, including a "hold". We think that the near $30/bbl decline in oil prices since the May meeting was probably beyond even the most optimistic scenario that Silk might have envisaged when she made that comment.
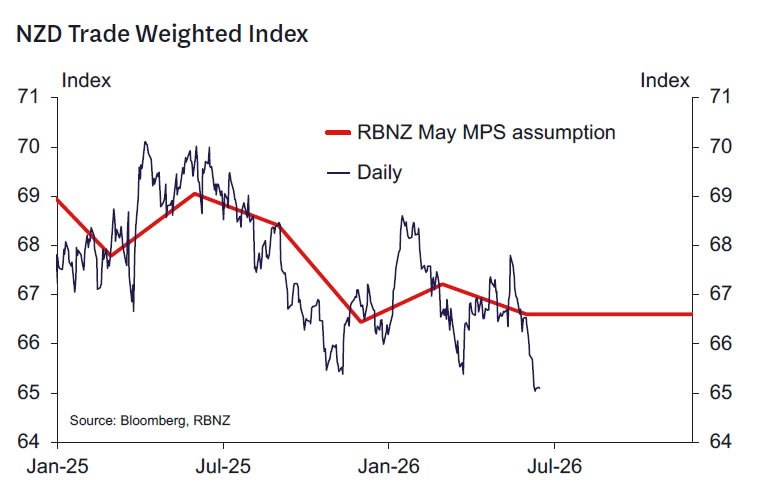
Another argument is the weakening in the exchange rate in the face of wide interest rate differentials. It is the case that the US dollar has been stronger since the FOMC shifted towards a tightening bias at their last meeting. Similarly, the Reserve Bank of Australia Board sent a message in their last meeting that cash rate increases were still possible. The associated weakening in the NZD has added to inflation pressures. But it's still unclear how persistent these will prove to be in much the same way we don't know how persistent energy related costs pressures will be. More generally the weaker NZD is a positive economic influence as it is assisting the competitive parts of the economy that are the key drivers of economic recovery. It's also useful additional pressure on less competitive parts of the economy to adjust (for example import demand, the construction and real estate sectors). The risks of FX depreciation are more likely better managed by retaining the view that the OCR will eventually need to return to developed country norm levels, adjusted for risk premia, as opposed to justify what might be premature OCR increases.
The resolution of at least some of the uncertainty associated with the Iran war will be a fillip to growth in the second half of 2026. The RBNZ has modest expectations for Q3 GDP (0.2% growth) that should be revised higher. Similarly, forecasts for later quarters could be revised higher in line with the stronger anticipated terms of trade now energy prices are lower. Business and consumer confidence, along with housing market prospects, should bounce as the Iran war uncertainty is reduced. Indeed, there is some evidence of this in today's monthly business confidence survey that shows general business confidence rising in June. We think there is some merit to these arguments. But importantly it seems very unlikely that future upgrades to the growth outlook will be sufficient to restore the RBNZ's February Statement growth outlook, when recall the RBNZ forecast no more than one 25bp hike in the OCR this year. Today's business survey also shows that its very much early days in the business sector recovery given that backward looking measures of activity suggest still weakening growth momentum. Also the level of business confidence, while higher than that seen in May, is some distance below the levels seen in early 2026, when the RBNZ saw OCR increases coming at the end of 2026.
Arguments in Favour of No Change
No further evidence on second round inflation impacts, rising wages pressures or increasing inflation expectations has accumulated since the May meeting. Indeed, short term inflation expectations appear to have reduced in business and consumer surveys as energy prices have fallen and will likely continue to decline if current energy price levels are sustained. Westpac's employment confidence survey shows a still fragile labour market that seems unlikely to support upward pressure on wages.
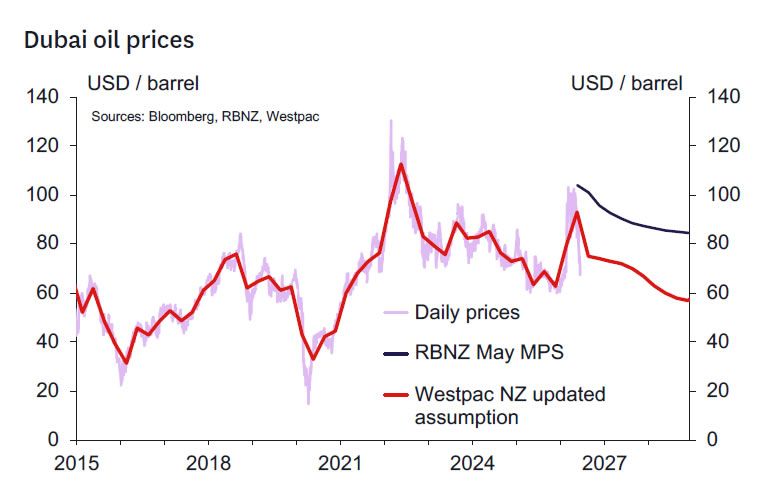
The Iran war has resolved (at least for now) unexpectedly quickly. A $30/bbl decline in oil prices is big news, sufficient to change the medium-term outlook, just as a $30/bbl increase was on the way up. With oil and refined fuels prices now well below the levels assumed in prior forecasts (including the RBNZ's May forecasts), forecasts of peak and end year inflation are being revised lower. For example, Westpac now sees CPI inflation peaking a quarter earlier in the June quarter at 4% and ending 2026 at 3.5%. The risks of prolonged inflation dynamics - such as those that had clearly bothered MPC member Prasanna Gai - taking hold must have a much lower probability now compared to that contemplated back in May. Similarly risks to inflation expectations have reduced.
Importantly, further key information will be available soon. The June quarter CPI (released 21 July) will show how widespread inflation pressures are. The monthly indicators provide little insight but to the extent they do, they have shown less inflation than previously feared. The June quarter QSBO will be available in a week and will similarly provide indicators on businesses' pricing and margins as well as activity indicators. The June quarter labour market reports due early August will shed light on the strength of the labour market and wage pressures. The best measures of inflation expectations are also available in August. This avalanche of relevant data scheduled between the July and September meetings always made a July hike a courageous move. With the sharp decline in energy prices significantly reducing the merit of pre-emptive action we suspect even the hawkish MPC members will now be content to see what this data reveals.
Activity data seemingly confirm a stagnant economy in the June quarter. Most indicators suggest little growth occurred in the June quarter, hence the output gap should have widened. Q1 GDP data was pretty much in line with RBNZ views once revisions are considered (the economy was just 0.1% larger than assumed in the May MPS).
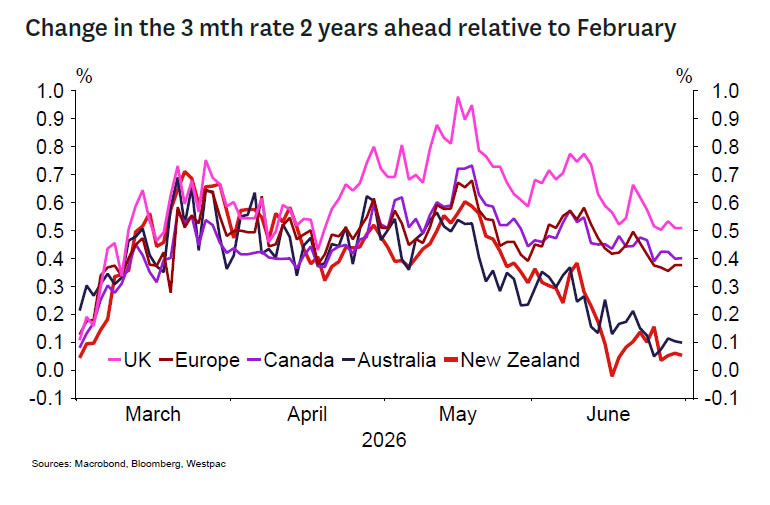
It's also useful to remember that global views on the need for interest rate increases have generally pulled back noticeably (with the key exception of the United States). Market pricing of the expected change in 90-day rates in the coming 2 years has pulled back across most peer economies with the adjustment to Australasian interest rate expectations being greater than for most. We note that the Bank of Canada remains cool on the potential for interest rate increases this year. This is interesting as Canada seems to be the closest comparator to New Zealand in that both countries are operating with a negative output gap and have similar monetary policy frameworks.
Scenarios
More hawkish and dovish possibilities exist including:
- A hawkish scenario where the OCR is increased and language suggesting the RBNZs views haven't shifted much. Markets would rationally assume at least 3, possibly 4 hikes in aggregate for 2026. We see this as implausible and assign a 10% probability to it.
- A dovish scenario that seriously questions a hike before December. The forward guidance could be omitted noting that inflation risks seem much less prominent relative to the still large level of excess capacity. Evidence of strong core inflation and broadening second-round inflation pressures would need to be seen to justify a lift in the OCR, and the statement could note that such evidence is lacking at this stage. The February MPS forecasts could be explicitly referred to as being nearer to the MPC's current frame of reference. This is more plausible and we attach a 30% probability to this scenario.
Kelly's Take
This is an easy decision. While I advocated for an increase in May, there seems much to be gained from waiting to see the outcome of the June quarter CPI. Certainly, the risks of prolonged second-round price impacts are lower than thought earlier given the Iran conflict seems to have resolved much sooner than expected and energy prices have declined far sooner than expected.
Higher interest rates are in prospect in time. But the urgency to begin the process now when such critical evidence is available just around the corner is gone. I suspect a gradual approach of 25bp increases in September and December should prove sufficient for now. The economy will continue to recover through the second half of the year, calling for a return of the OCR to hopefully not much higher than neutral levels (in the high 3s in my view) next year.
I see the risk that the exchange rate will depreciate further over the balance of the year given steep negative interest rate differentials. But if this occurs, this will aid the needed rebalancing of the economy. The market needs to be reminded of the importance of data dependence in determining future OCR adjustments.
Elliott Wave View: GBPJPY Advancing to Finish Five Wave Diagonal
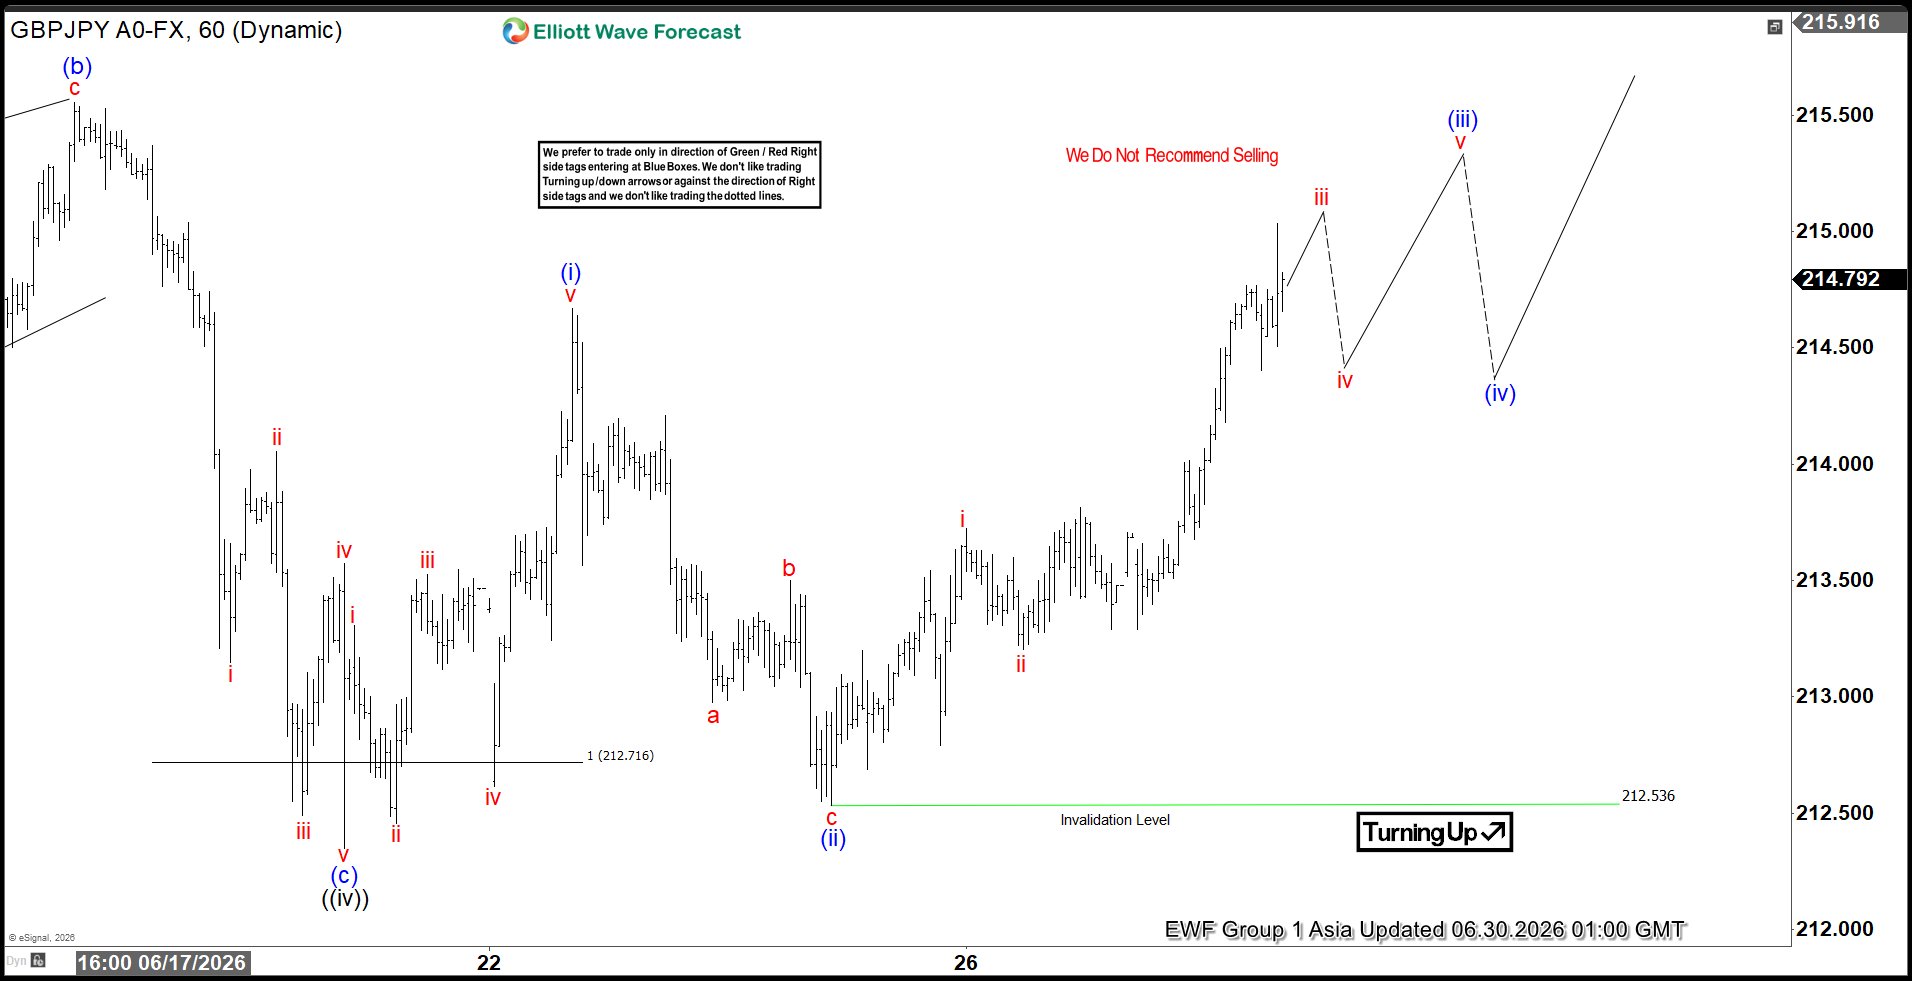
The short‑term Elliott Wave view in GBPJPY shows the cycle from the April 30, 2026 low unfolding as a diagonal. From that low, wave ((i)) ended at 214.05, followed by a corrective pullback in wave ((ii)) that reached 211.18. The pair then advanced in wave ((iii)) toward 215.6. A retracement in wave ((iv)) completed at 212.34, as reflected in the one‑hour chart. This sequence sets the foundation for wave ((v)), which is developing as a five‑wave structure.
From the end of wave ((iv)), wave (i) advanced to 214.67. The subsequent pullback in wave (ii) concluded at 212.53. In the near term, as long as the pivot at 212.53 remains intact, pullbacks should find support in either a three‑swing or seven‑swing corrective sequence. This support is expected to guide the pair higher, completing wave ((v)) of wave 1 at a larger degree.
Once wave 1 finishes, GBPJPY should enter a corrective phase in wave 2. That retracement will correct the cycle from the April 30 low and is likely to unfold in three or seven swings. Such a correction would reset conditions, preparing the market for another rally. The structure emphasizes the importance of the 212.53 pivot. Holding above this level sustains the bullish bias and supports the view that the diagonal pattern is progressing toward completion.
GBPJPY 60-Minute Elliott Wave Chart
GBPJPY Elliott Wave Video:
https://www.youtube.com/watch?v=X7T0fQ9Bodo
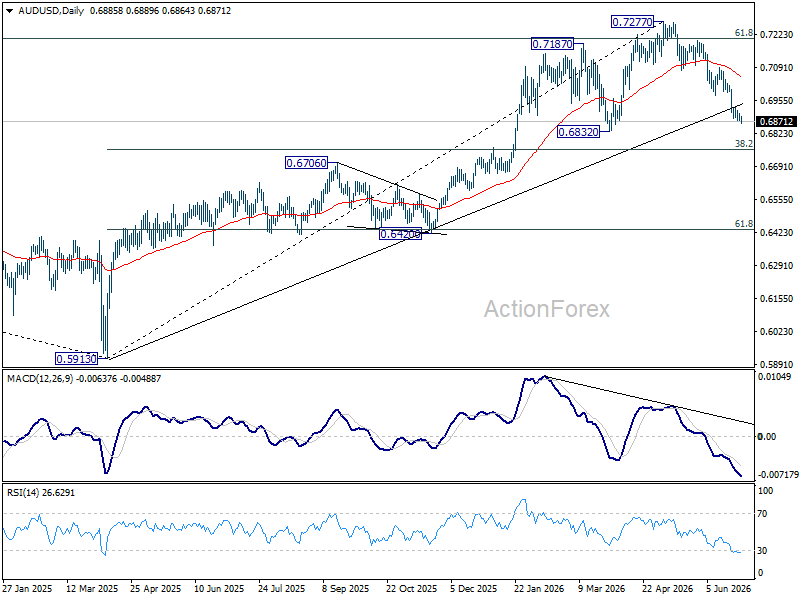
AUD/USD Falls Despite Hawkish RBA Minutes as Markets Doubt August Hike
The Australian Dollar barely reacted to the hawkish sets of RBA minutes. Instead, AUD/USD drifted lower in Asian trading, suggesting investors are no longer judging the Reserve Bank by what it says, but by what they believe it can realistically do.
On paper, the minutes kept August very much alive. Policymakers reiterated that monetary policy "needed to remain restrictive" and made clear they were prepared to raise the cash rate again "if necessary." Yet markets had already priced in that rhetoric. What stood out instead was the Board's emphasis on using time to assess how previous tightening is flowing through the economy. Investors interpreted that not as a prelude to another hike, but as confirmation that the RBA is firmly in watch-and-wait mode.
The market's skepticism reflects growing concern about Australia's domestic economy rather than any loss of confidence in the RBA's commitment to fighting inflation. Consumer sentiment remains close to its weakest level in half a century, while the housing market is showing increasingly clear signs of cooling after three rate hikes this year. Those conditions raise the economic cost of further tightening. As a result, many investors view the RBA's tough language as a form of "open-mouth operations"—using hawkish communication to restrain inflation expectations without necessarily intending to follow through with another immediate rate increase.
That leaves the Australian Dollar dependent on developments abroad rather than at home. Thursday's US Non-Farm Payrolls report may prove far more important for AUD/USD than the RBA minutes themselves. A strong payrolls report would reinforce the Dollar's advantage and could push the pair through the key 0.6832 support level. A weaker report, however, could allow AUD/USD to stabilize, although a sustained recovery may still require investors to regain confidence that the RBA is capable—not just willing—to tighten policy again.
Technically, the decline from the 0.7277 medium-term high remains in progress, with 0.6832 acting as the next major support level. A decisive break there would expose 38.2% retracement of 0.5913 to 0.7277 at 0.6756.
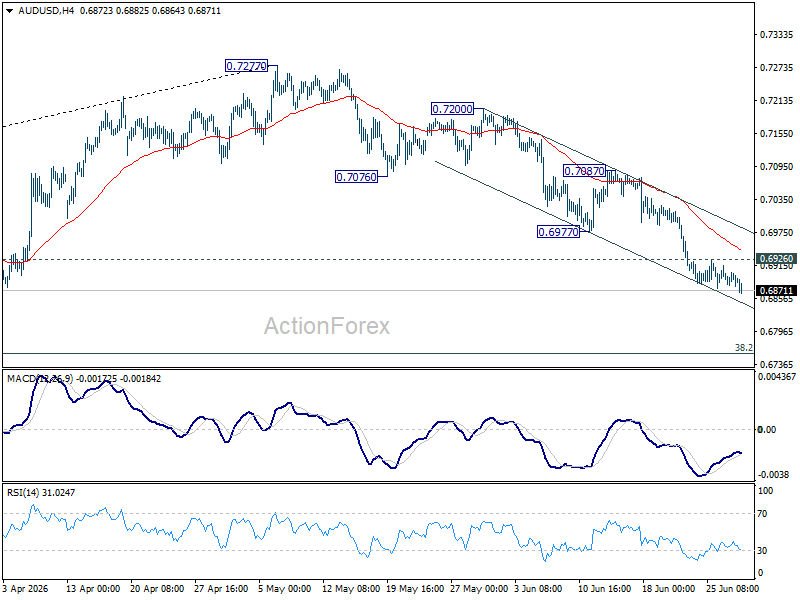
For now, however, the broader pullback is still viewed as a correction within the larger uptrend from the 2024 low at 0.5913, suggesting strong buying interest could emerge around the 0.6756 area. Initial resistance is seen at 0.6926, while 0.6977, a former support level, is expected to cap any recovery.