
Sample Category Title
Fed’s Goolsbee: Jobs data weak, but recession not imminent
Chicago Federal Reserve President Austan Goolsbee addressed the recent economic concerns in an interview with CNBC, noting that last Friday's jobs numbers were "weaker than expected" but not yet indicative of a recession.
He emphasized the Fed's commitment to its core mandates: "The Fed's job is very straightforward: maximize employment, stabilize prices and maintain financial stability. That's what we're going to do."
Goolsbee highlighted the Fed's forward-looking approach, stating, "If the conditions collectively start coming in like that on the through line, there's deterioration on any of those parts, we're going to fix it."
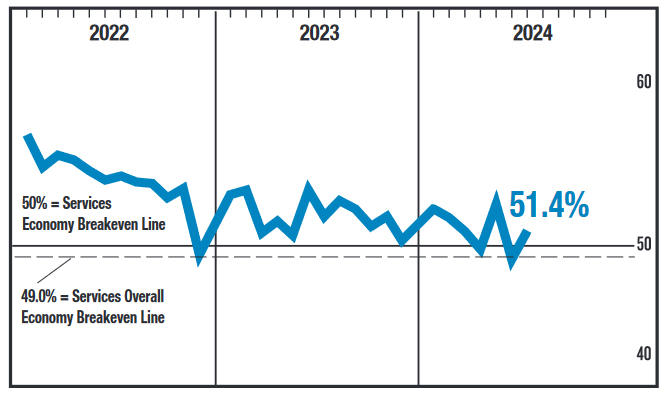
US ISM services rises to 51.4, corresponds to 0.8% annualized GDP growth
US ISM Services PMI rose from 48.8 to 51.4 in July, matched expectations. Looking at some details, business activity/production rose from 49.6 to 54.5. New orders rose from 47.3 to 52.4. Employment jumped from 46.1 to 51.1. Prices rose from 56.3 to 57.0.
ISM said: "The past relationship between the Services PMI® and the overall economy indicates that the Services PMI® for July (51.4 percent) corresponds to a 0.8-percentage point increase in real gross domestic product (GDP) on an annualized basis."
AUD/USD Technical: Dropped Towards 0.6360 Key Range Support Ahead of RBA
- AUD/USD has been the worst performer among the major currencies in the past 4 weeks due to a double whammy slow-down growth effect from the US and China.
- RBA’s “hawkish hold” monetary policy stance on Tuesday may offer a relief for the AUD/USD.
- The recent 6.6% decline in the AUD/USD has almost reached an extreme oversold condition since December 2021.
In the past four weeks, the Aussie dollar has faced similar bloodshed with the major benchmark stock indices ranging from the US, and Europe to Asia on a synchronized global risk-off episode that intensified last week after the odds of a hard-landing recessionary environment in the US have increased.
Global markets witnessed a flight to safety to longer tenure US Treasury bonds and gold (XAU/USD) that outperformed in a mixed-bag US dollar environment.
The Aussie dollar is considered a higher-beta currency as it tends to be referenced as a proxy for growth, in turn also commodities-related due to Australia being the world’s largest iron ore producer that supplied most of its iron ore to China, its biggest export market.
Hence, the Aussie dollar is being hampered by a double whammy economic growth slow-down effect from two of the world’s largest economies, the US and China. In addition, China after the recent conclusion of its Third Plenum, top China policymakers emphasized the continuation of piecemeal stimulus policies rather than massive accommodative policies via heavy infrastructure spending to jumpstart the current lackluster internal demand environment.
The Aussie dollar is the worst-performing major currency against the US dollar
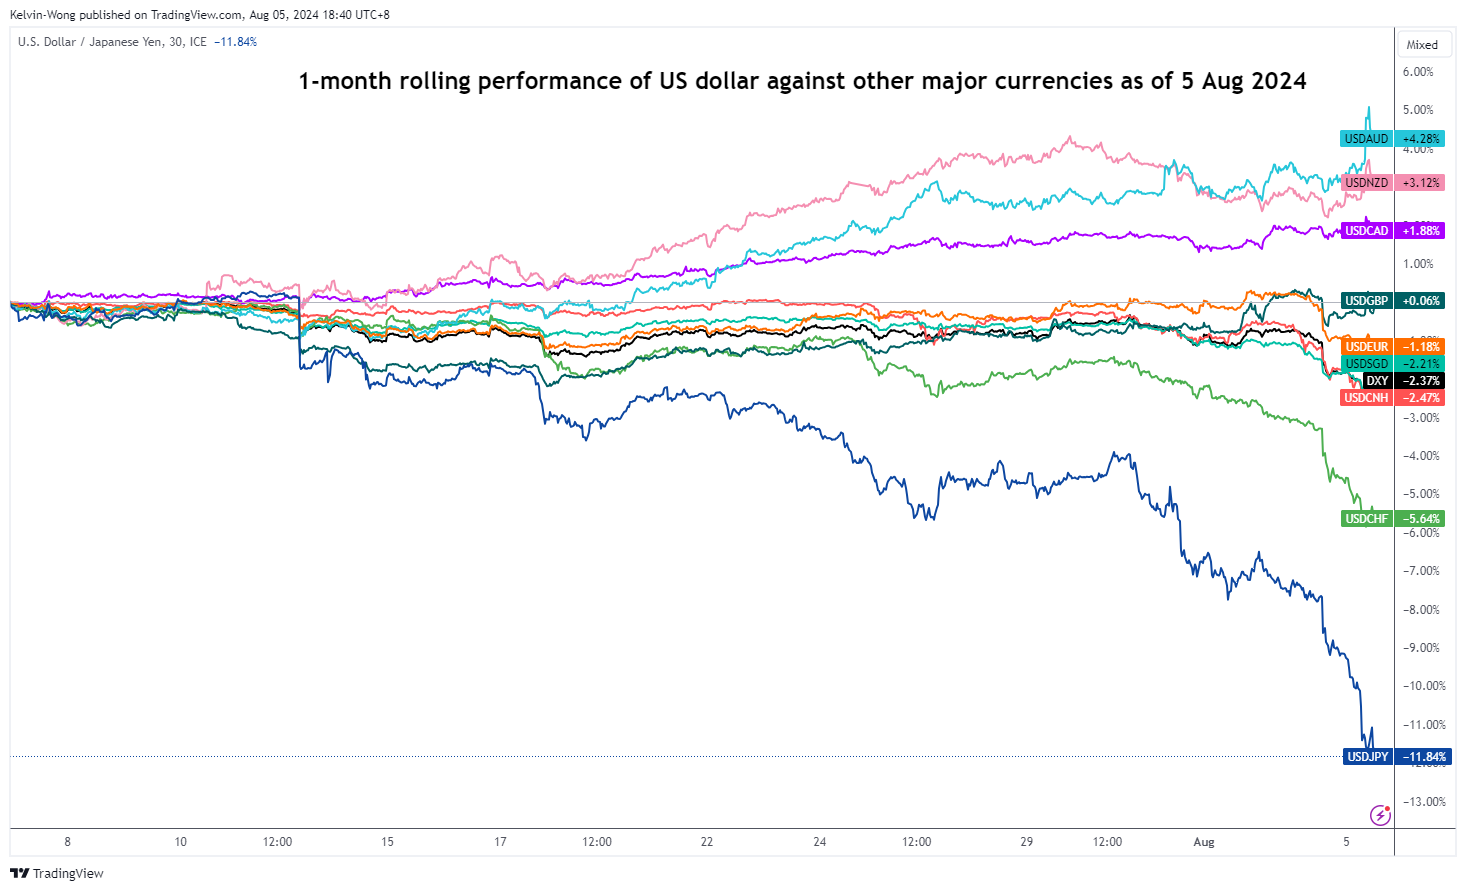
Fig 1: 1-month rolling performance of the US dollar against major currencies as of 5 Aug 2024 (Source: TradingView, click to enlarge chart)
Thus, the Aussie dollar has been the weakest currency among the majors. Based on a one-month rolling performance basis, the US dollar has gained by 4.20% against the Aussie dollar and in contrast weakened against the safe haven proxies; the US dollar underperformed against the Swiss franc and Japanese yen by 5.60% and 11.85% respectively at this time of the writing.
RBA may offer a relief to the battered down AUD/USD
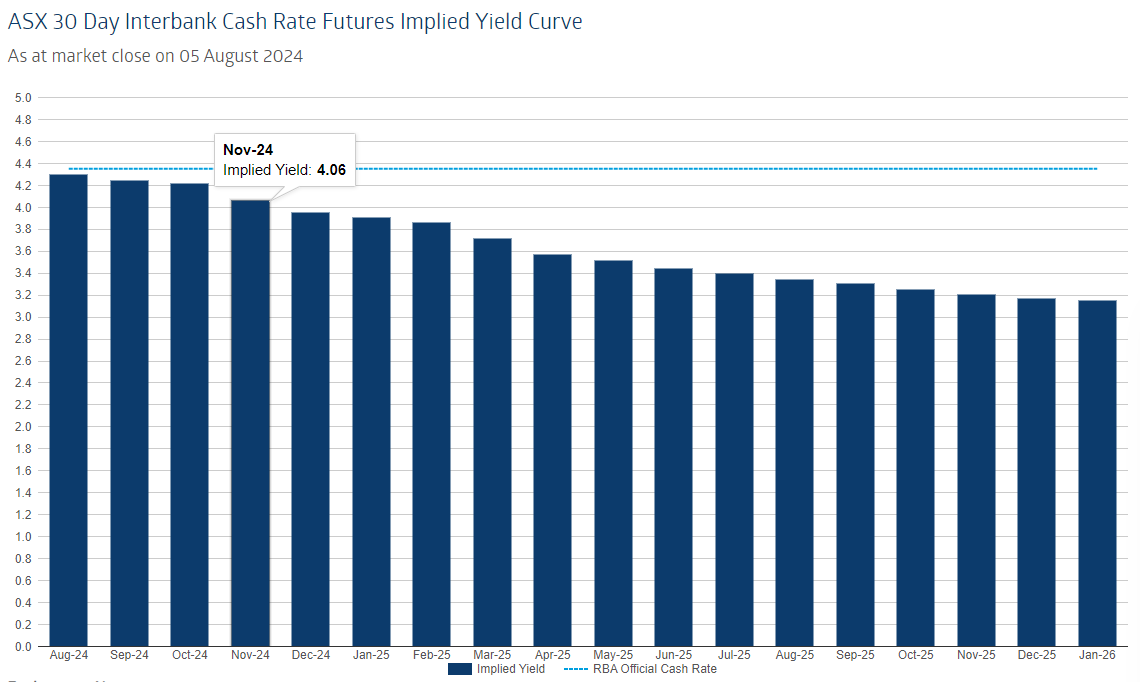
Fig 2: ASX 30-day interbank cash rate futures implied yield curve as of 5 Aug 2024 (Source: RBA Rate Tracker from ASX, click to enlarge chart)
Despite Australia’s core inflation decelerated unexpectedly to 3.9% y/y for the second quarter from 4% in the first quarter, most economists expect RBA to hold its policy cash rate at 4.35% for a sixth consecutive meeting on Tuesday, 6 August, and leave the options open for its remaining monetary policy meetings in 2024.
Another potential impact on the AUD/USD is likely to come from its latest quarterly update of economic forecasts that will be released on Tuesday as well; so far past remarks from RBA Governor Bullock implied that RBA is not in a hurry to cut interest rates as current inflationary trend in Australia is still well above of its 3% to 2% target.
At this juncture, as of Monday, 5 August, the ASX 30-day interbank cash rate futures implied yield curve indicated an implied yield of 4.06% for the November 2024 contract which suggests a potential first RBA rate cut to occur towards the end of the year, in the November meeting versus a much more dovish US Federal Reserve (see Fig 2).
Latest data from the CME FedWatch tool has priced in with almost certainty that a 50 basis points cut in the Fed funds rate is to be enacted in the September FOMC meeting followed by a high chance of 78% for another 50 bps cut to bring it down to 4.25%-4.50% in the November meeting.
AUD/USD has almost reached an extremely oversold condition
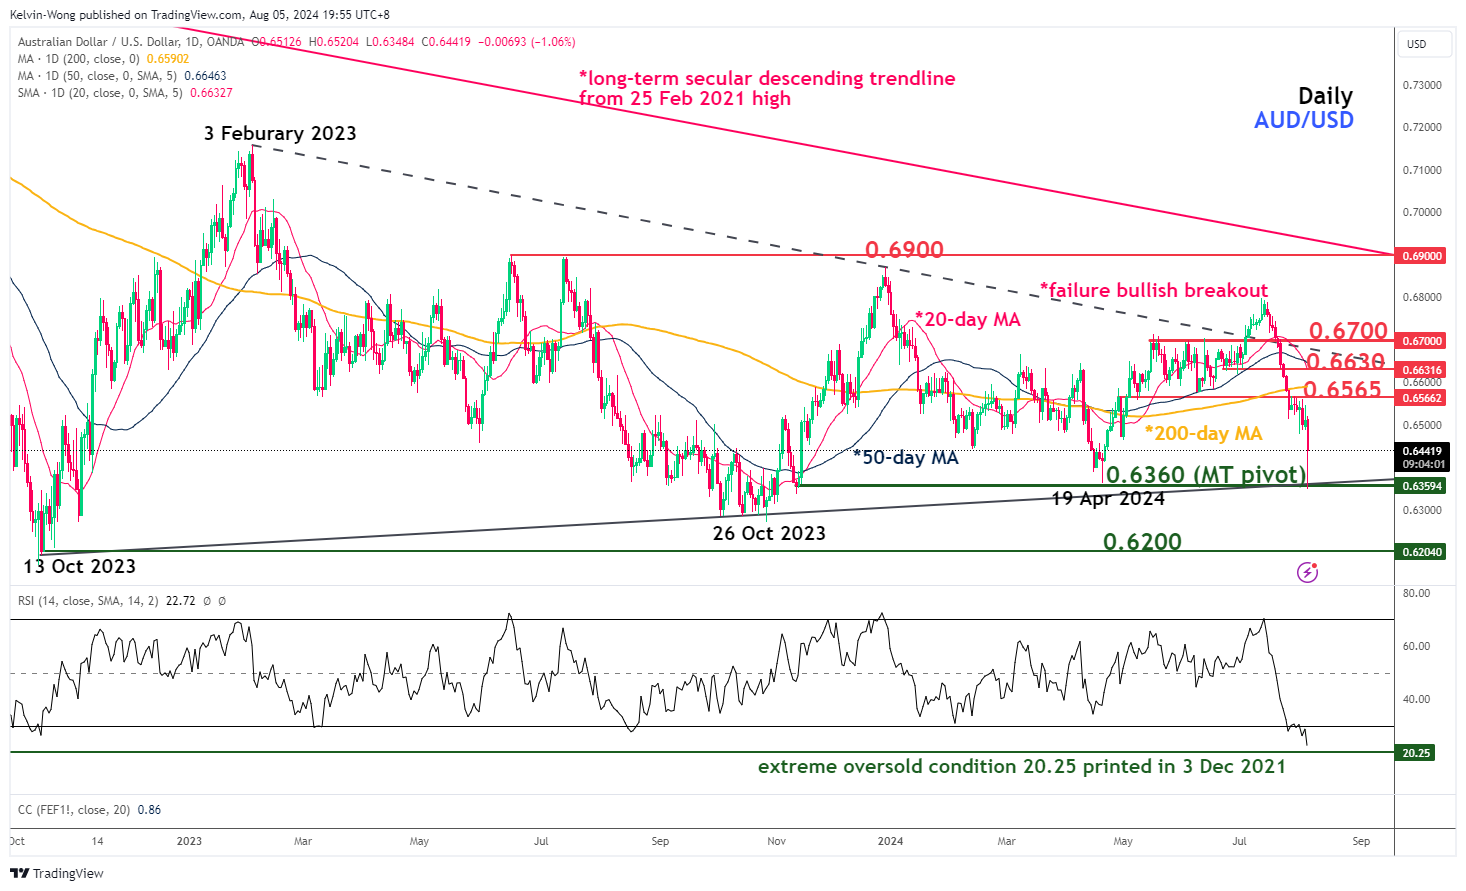
Fig 3: AUD/USD medium-term trend as of 5 Aug 2024 (Source: TradingView, click to enlarge chart)
The 6.6% decline seen in the AUD/USD from its 12 July high of 0.6798 in the past 4 weeks has caused the daily RSI momentum indicator to hit an oversold condition of 23.40 at this juncture, its most extreme oversold level reached since 3 December 2021 reading of 20.25.
If the 0.6360 key medium-term pivotal support holds, the AUD/USD may see a potential mean reversion rebound to retest the intermediate resistances of 0.6565 and 0.6630 (also the 20-day and 50-day moving averages).
However, failure to hold at 0.6360 may ignite a bearish “Symmetrical Triangle” range breakdown scenario to expose the first major support of 0.6200.
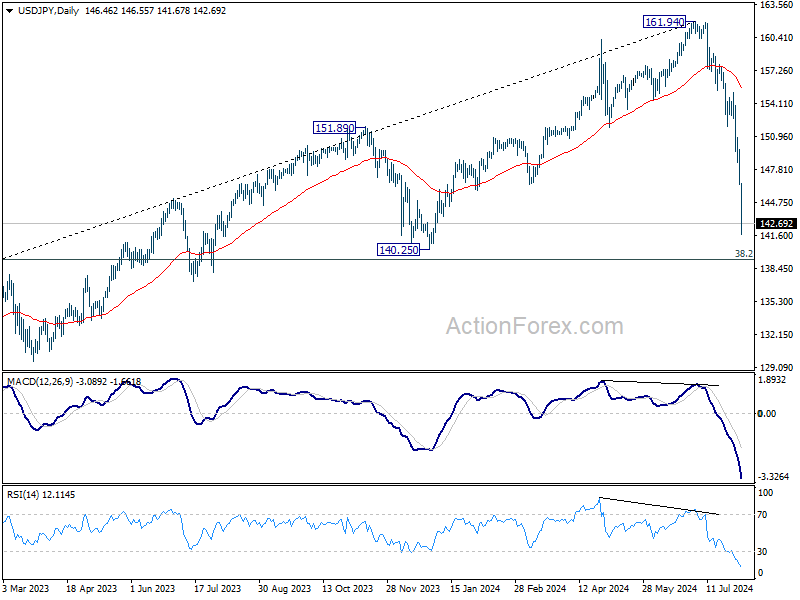
USD/JPY Mid-Day Outlook
Daily Pivots: (S1) 145.40; (P) 147.59; (R1) 148.76; More...
Intraday bias in USD/JPY remains on the downside for the moment. Current fall from 161.94 should target 140.25 support next. On the upside, above 146.40 minor resistance will turn intraday bias neutral and bring consolidations first, before staging another fall.
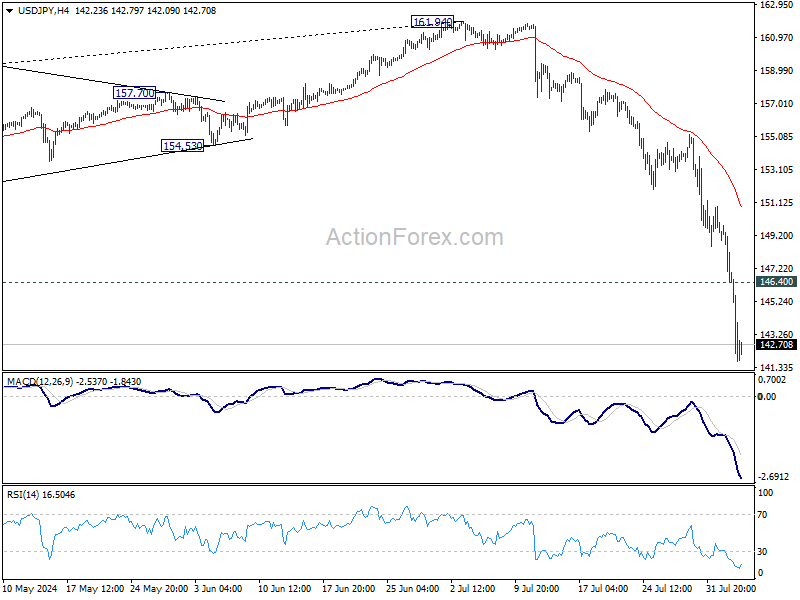
In the bigger picture, the strong break of 55 W EMA (now at 149.98) argue that fall from 161.94 medium term is correcting whole up trend from 102.58 (2021 low). Deeper decline could be seen to 38.2% retracement of 102.58 to 161.94 at 139.26, which is close to 140.25 support. In any case, risk will stay on the downside as long as 55 W EMA (now at 149.98) holds.
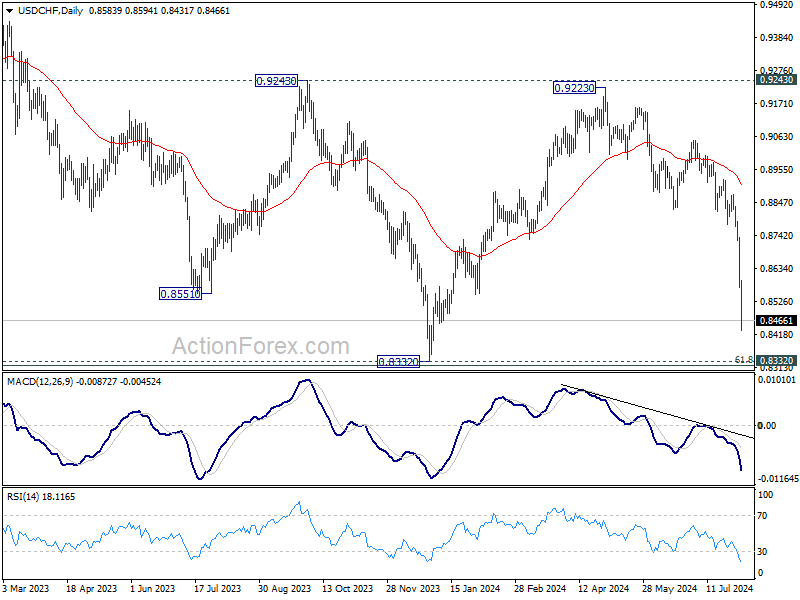
USD/CHF Mid-Day Outlook
Daily Pivots: (S1) 0.8523; (P) 0.8631; (R1) 0.8689; More…
Intraday bias in USD/CHF remains on the downside at this point. Current fall from 0.9223 should target a retest on 0.8332 low. On the upside, above 0.8594 minor resistance will turn intraday bias neutral and bring consolidations, before staging another fall.
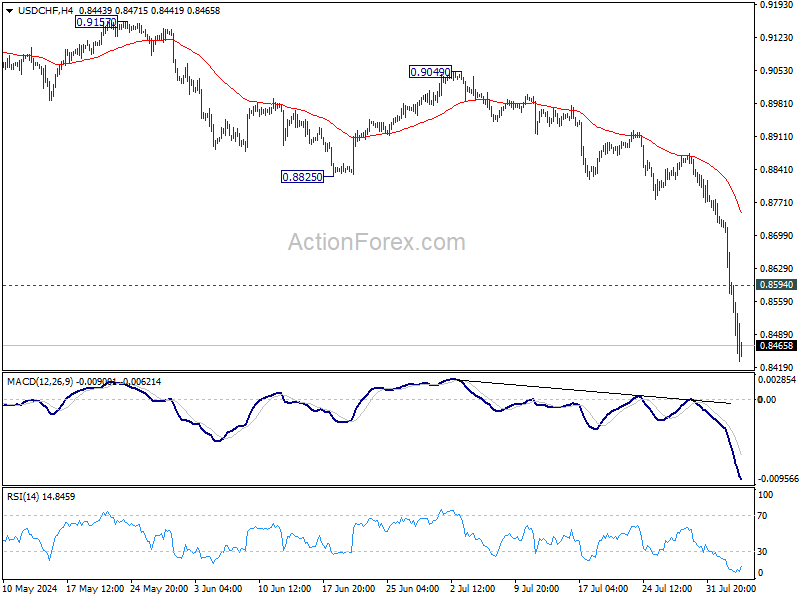
In the bigger picture, price actions from 0.8332 (2023 low) are currently seen as a medium term corrective pattern, with fall from 0.9223 as the second leg. Strong support could be seen from 0.8332 to bring rebound. Yet, overall outlook will continue to stay bearish as long as 0.9243 resistance holds. Firm break of 0.8332, however, will resume larger down trend from 1.0146 (2022 high).
GBP/USD Mid-Day Outlook
Daily Pivots: (S1) 1.2729; (P) 1.2784; (R1) 1.2861; More...
Range trading continues in GBP/USD and intraday bias stays neutral for the moment. Further decline is in favor with 1.2863 resistance intact. On the downside, below 1.2706 will target 1.2612 support first. Decisive break there should confirm that rise from 1.2298 has completed. However, break of 1.2863 will turn bias back to the upside for retesting 1.3043 resistance instead.
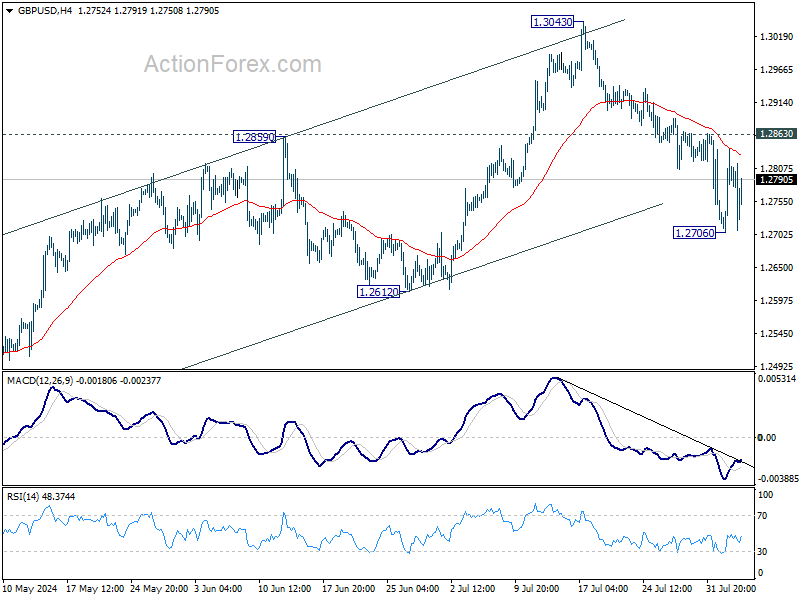
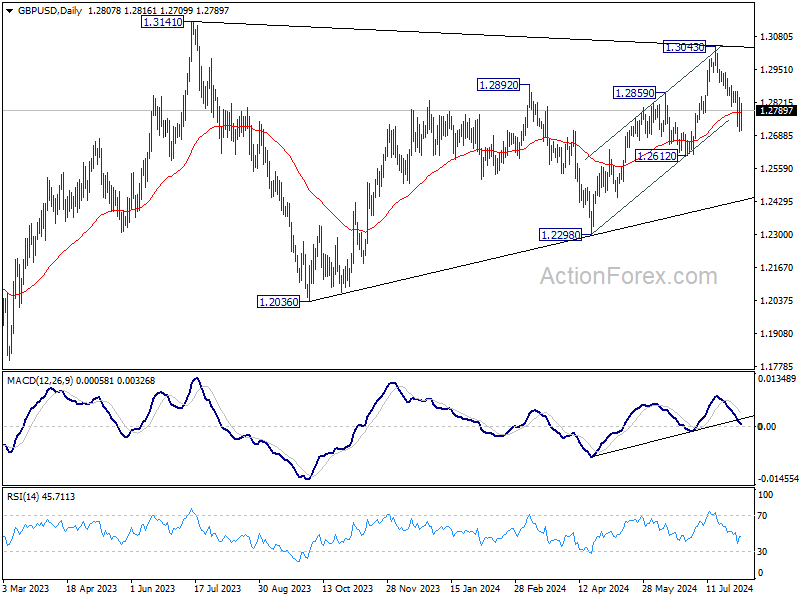
In the bigger picture, current development suggests that corrective pattern from 1.3141 is extending with fall from 1.3043 as another leg. Break of 1.2612 support would strengthen this case. But still, downside should be contained by 1.2036/2298 support zone even in case of deep decline. Rise from 1.0351 (2022 low) remains in favor to resume at a later stage.
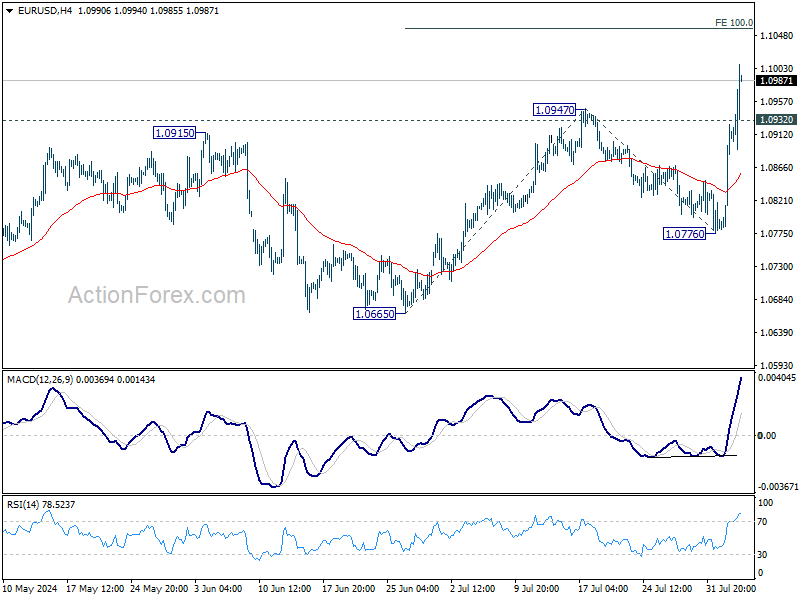
EUR/USD Mid-Day Outlook
Daily Pivots: (S1) 1.0820; (P) 1.0873; (R1) 1.0965; More.....
EUR/USD's strong break of 1.0947 resistance confirms resumption of the rise from 1.0665. Intraday bias remains on the upside for 100% projection of 1.0665 to 1.0947 from 1.0776 at 1.1056 next. On the downside, below 1.0932 minor support will turn intraday bias neutral and bring consolidations, before staging another rally.
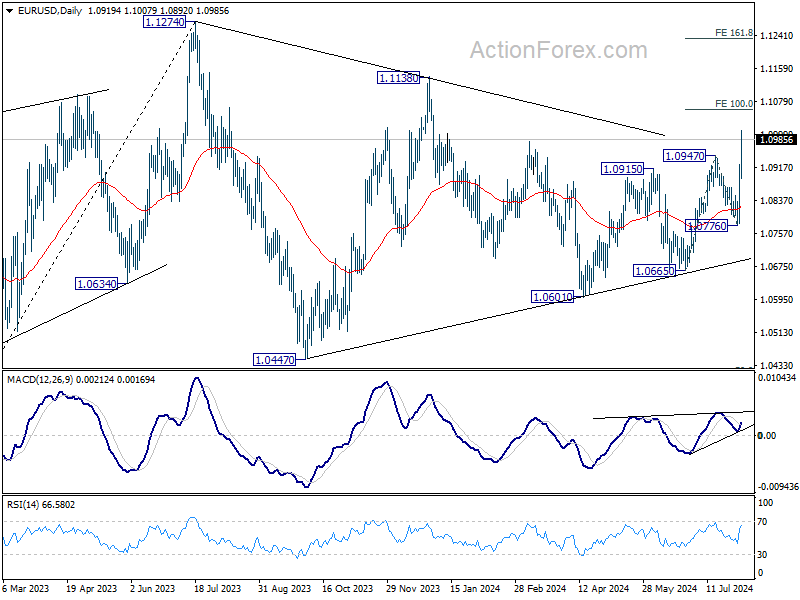
In the bigger picture, price actions from 1.1274 are viewed as a corrective pattern that's still be in progress. Break of 1.1138 resistance will be the first signal that rise from 0.9534 (2022 low) is ready to resume through 1.1274 (2023 high). However, break of 1.0776 support will extend the correction with another falling leg back towards 1.0447 support.
Global Markets Crashing: Nikkei’s Historic 12.4% Plunge, DOW Futures Down 1100 Points
Global stock markets are in crash mode today, beginning with the massive historic -12.4% decline in Nikkei. Major European indexes are also trading deeply in the red, with losses around -3%, though these are overshadowed by the severe drop in Japan. Concurrently, DOW futures are down over -1100 points, with S&P 500 futures down -4.4% and NASDAQ futures down -5.7%. US 10-year yield has continued its steep fall, diving below the 3.7% handle. Given the current panic mode in the markets, even a strong upside surprise in US ISM services data is unlikely to provide support.
In the currency markets, Yen and Swiss Franc are the clear runaway leaders, with Euro trailing in a distant third. Australian Dollar is the worst performer, looking ahead to RBA rate decision in the upcoming Asian session. Sterling is the second worst, followed by Kiwi. Dollar and Canadian Dollar are positioned in the middle.
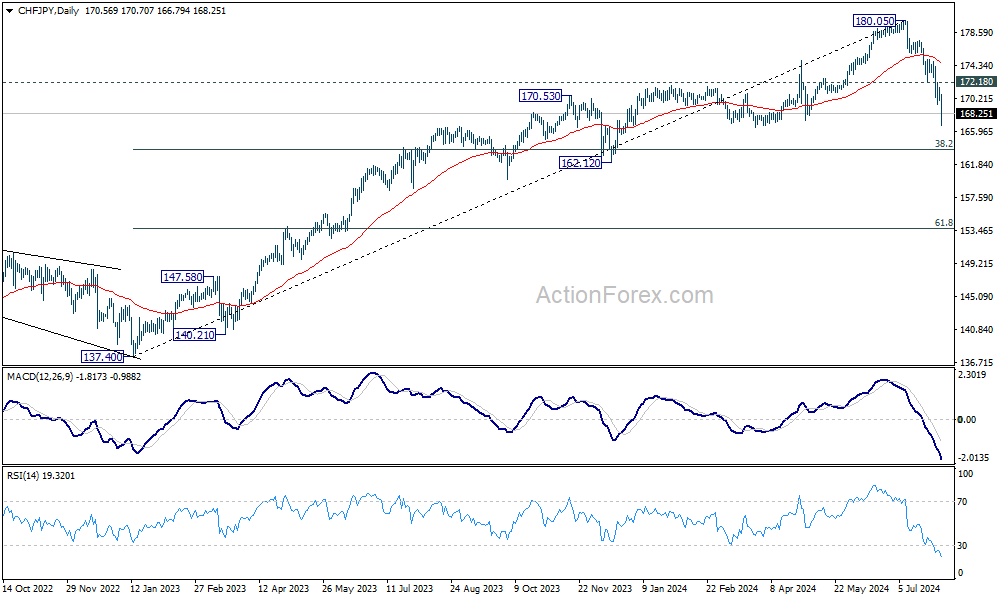
Technically, Yen is clearly overpowering Swiss Franc even though both are strong. CHF/JPY's current fall from 180.05 is seen as correcting rise from 137.40 first. Deeper fall is expected as long as 172.18 resistance holds, to 38.2% retracement of 137.40 to 180.05 at 163.75. Strong support should be seen there to bring rebound, at least on first attempt. However, powerful break of 163.75 will argue that like other Yen crosses, CHF/JPY is also already in a larger scale correction.
In Europe, at the time of writing, FTSE is down -3.09%. DAX is down -3.51%. CAC is down -2.78%. UK 10 year yield is down -0.086 at 3.756. Germany 10-year yield is down -0.081 at 2.100. Earlier in Asia, Nikkei fell -12.4%. Hong Kong HSI fell -1.46%. China Shanghai SSE fell -1.54%. Singapore Strait Times fell -4.07%. Japan 10-year JGB yield fell -0.205 to 0.754.
Eurozone Sentix falls to -13.8, ECB under pressure to cut further and faster
Eurozone Sentix Investor Confidence fell sharply from -7.3 to -13.8 in August, marking its lowest level since January. Current Situation Index dropped from -15.8 to -19.0, the lowest since February, while Expectations Index declined from 1.5 to -8.8, the lowest since last December.
Globally, Sentix Investor Confidence Index also tumbled, falling from 5.9 to -1.5, its lowest level since December. Current Situation Index decreased from 6.0 to -0.6, the lowest since January, and Expectations Index dropped from 5.7 to -2.4, the lowest since November.
Sentix commented on the data, stating that "Following the severe setback of the 'first mover' in the previous month, there is now another, more pronounced economic slump in August. The global recovery comes to a halt."
They added that the economic downturn in Eurozone should put ECB under pressure to "cut interest rates further and faster". Investors are now expecting ECB to address the economic weakness more aggressively, even though the Sentix Inflation Barometer is not indicating any sustained easing in the inflation environment.
Eurozone PPI at 0.5% mom, -3.2% yoy in Jun
Eurozone PPI rose 0.5% mom in June, but down -3.2% yoy, comparing to expectation of 0.3% mom, -3.2% yoy. For the month. Industrial producer prices increased by 0.1% for intermediate goods,1.6% for energy, 0.1% for capital goods, and 0.1% for non-durable consumer goods. Prices remained stable for durable consumer goods
EU PPI was up 0.5% mom, down -3.1% yoy. The highest monthly increases in industrial producer prices were recorded in Estonia (+2.2%), Spain and Romania (both +1.9%) and Greece (+1.8%). The largest decreases were observed in Bulgaria (-1.0%), Czechia, France and Finland (each -0.3%).
Eurozone PMI composite finalized at 50.2, growing at snail's pace
Eurozone PMI Services was finalized at 51.9 in July, down from June's 52.8, a 4-month low. PMI Composite was finalized at 50.2, down from June's 50.9, a 5-month low. These figures indicate a slowing economy as the services sector loses momentum and the industrial sector continues its decline.
Cyrus de la Rubia, Chief Economist at Hamburg Commercial Bank, stated, "The eurozone's economy is growing at a snail's pace." He noted that while the services sector isn't picking up speed as it did earlier in the year, the industrial slump persists. The HCOB Composite Output PMI barely stays above the expansion line, signaling a weak start to H2 despite surprisingly strong economic growth in the second quarter. De la Rubia added, "Given this situation, our 0.7% growth forecast for the year is still conservative."
Inflation remains a significant concern. Although sales prices are increasing at their slowest rate in 38 months and input costs are generally following suit, inflation is still high relative to the weak economy. Historically, when PMI activity index was at 52.0 or lower, selling prices typically stayed flat, and input prices rose much more slowly than they are now. De la Rubia attributes this to wage pressure caused by demographic shifts, which complicates ECB's efforts to achieve its 2% inflation target.
UK PMI services finalized at 52.5, composite at 52.8
UK PMI Services was finalized at 52.5 in July, up from June's 52.1. PMI Composite was finalized at 52.8, up from June's 52.3.
Joe Hayes, Principal Economist at S&P Global Market Intelligence, noted that the UK service sector saw a "modest rebound" following a subdued end to Q2. Business Activity Index saw a slight uptick, but New Business Index jumped by over three points to its highest level in 14 months, reflecting an influx of new clients and contracts. Hayes pointed out that the accelerated expansion in sales activity indicates improved business and consumer confidence, suggesting a positive outlook for GDP growth in Q3.
Hayes highlighted ongoing issues with "sluggish progress on inflation." While price pressures on input costs and output prices are at their lowest since early 2021, the respective PMIs remain above pre-pandemic levels. These benchmarks are critical for BoE to hit before it can declare success in combating inflation.
Japan's PMI services finalized at 53.7, concerns on sustained inflationary pressure
Japan's PMI Services was finalized at 53.7 in July, up from June's 49.4. PMI Composite was finalized at 52.5, up from June's 49.7.
Usamah Bhatti, Economist at S&P Global Market Intelligence, highlighted a "renewed upswing" in the services sector at the start of Q3, driven by "improved demand conditions and stronger customer numbers." This growth was largely domestic, as new export business declined for the first time this year. The outlook for the service sector remains positive, with outstanding business levels increasing and strong confidence in the 12-month outlook.
While the combined output of the manufacturing and services sectors expanded at a "moderate pace," the growth was primarily driven by the service sector, with manufacturing experiencing a slight contraction. Private sector companies reported that input price inflation remained "stubbornly high," affecting total output. There are concerns that "sustained inflationary pressure" could pose a downside risk to the economy in the coming months.
China's Caixin PMI services rises to 52.1, composite falls to 51.2
China's Caixin PMI Services increased from 51.2 to 52.1 in July, surpassing the expected 51.4 and remaining in expansionary territory for the 19th consecutive month. Meanwhile, PMI Composite fell from 52.8 to 51.2, but still marking the ninth consecutive month of expansion.
Wang Zhe, Senior Economist at Caixin Insight Group, noted that while the services sector saw improvement, manufacturing faced greater pressure. "The former outperformed the latter in terms of supply, demand and employment," Wang said. Despite this, composite prices remained weak, especially on the sales front, which further squeezed company profit margins. Market optimism improved, although it remained at a low level.
The latest data revealed that China's real GDP growth in Q2 slowed to 4.7% yoy, significantly lower than market expectations. This slowdown suggests that it will be challenging for the country to meet its annual growth target of around 5%. Wang said the primary issues remain insufficient effective domestic demand and weak market optimism.
EUR/USD Mid-Day Outlook
Daily Pivots: (S1) 1.0820; (P) 1.0873; (R1) 1.0965; More.....
EUR/USD's strong break of 1.0947 resistance confirms resumption of the rise from 1.0665. Intraday bias remains on the upside for 100% projection of 1.0665 to 1.0947 from 1.0776 at 1.1056 next. On the downside, below 1.0932 minor support will turn intraday bias neutral and bring consolidations, before staging another rally.
In the bigger picture, price actions from 1.1274 are viewed as a corrective pattern that's still be in progress. Break of 1.1138 resistance will be the first signal that rise from 0.9534 (2022 low) is ready to resume through 1.1274 (2023 high). However, break of 1.0776 support will extend the correction with another falling leg back towards 1.0447 support.
Economic Indicators Update
| GMT | Ccy | Events | Actual | Forecast | Previous | Revised |
|---|---|---|---|---|---|---|
| 23:50 | JPY | BoJ Meeting Minutes | ||||
| 01:00 | AUD | TD Securities Inflation M/M Jul | 0.40% | 0.30% | ||
| 01:45 | CNY | Caixin Services PMI Jul | 52.1 | 51.4 | 51.2 | |
| 07:45 | EUR | Italy Services PMI Jul | 51.7 | 53 | 53.7 | |
| 07:50 | EUR | France Services PMI Jul F | 50.1 | 50.7 | 50.7 | |
| 07:55 | EUR | Germany Services PMI Jul F | 52.5 | 52 | 52 | |
| 08:00 | EUR | Eurozone Services PMI Jul F | 51.9 | 51.9 | 51.9 | |
| 08:30 | EUR | Eurozone Sentix Investor Confidence Aug | -13.9 | -5.5 | -7.3 | |
| 08:30 | GBP | Services PMI Jul F | 52.5 | 52.4 | 52.4 | |
| 09:00 | EUR | Eurozone PPI M/M Jun | 0.50% | 0.30% | -0.20% | |
| 09:00 | EUR | Eurozone PPI Y/Y Jun | -3.20% | -3.30% | -4.20% | -4.10% |
| 13:45 | USD | Services PMI Jul F | 56 | 56 | ||
| 14:00 | USD | ISM Services PMI Jul | 51.4 | 48.8 |
EUR/USD Analysis: The Rate Has Risen to a Nearly 5-Month High
As shown by today’s EUR/USD chart, the rate rose this morning to 1.096 – its highest level since mid-March.
On one hand, this was driven by the weakness of the dollar. The USD fell sharply against other currencies following the release of labour market news on Friday (data from ForexFactory hereafter):
→ The unemployment rate reached 4.3% – the highest since autumn 2021;
→ In July, employers created only 114,000 jobs (excluding the agricultural sector) compared to the forecast of 175,000. Last month’s figure was 179,000;
→ Wage growth is showing signs of slowing down.
The rapid deterioration of the labour market is an early sign of a recession. This is indicated by the rule of Claudia Sahm, who worked at the Federal Reserve for over 10 years.
On the other hand, the EUR/USD is rising due to the strength of the euro. Today, the Purchasing Managers' Index (PMI) figures were released in Europe – all are above the 50.0 level, indicating growth in the Eurozone economies.
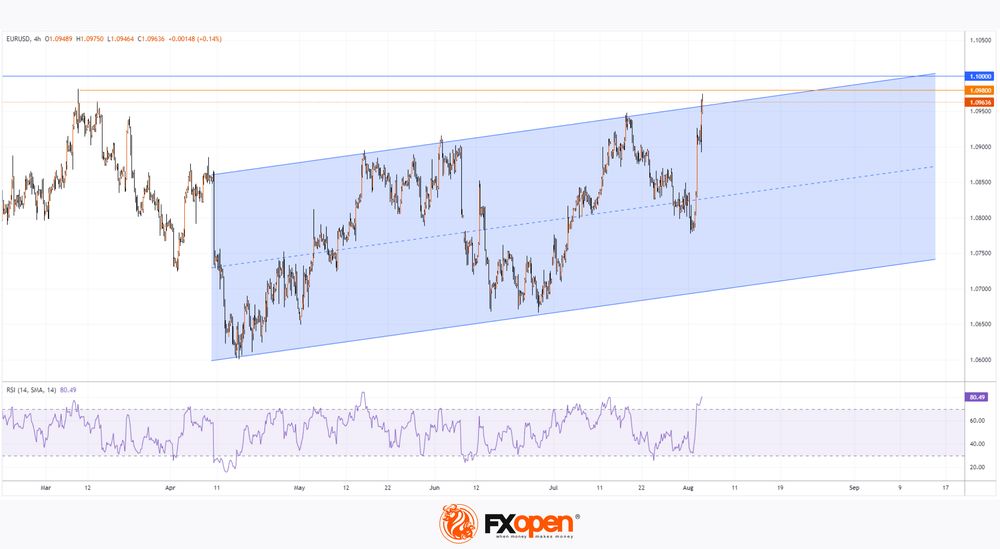
As today's technical analysis of the EUR/USD chart shows:
→ The price movement since mid-April has formed the bounds of an upward channel (shown in blue);
→ This morning, the price is above the upper boundary, and the RSI indicator points to a strongly overbought market;
→ The price is close to a resistance block formed by the psychological level of 1.1 and the April high around 1.098.
This creates a vulnerable situation for a false breakout of the resistance block.
Thus, the EUR/USD rate may form a similar pattern to what happened with GBP/USD:
→ On 18 July, we noted bearish signs when it breached the psychological level of 1.300;
→ Over the following 15 days, the rate dropped by approximately 2.5%.
Trade over 50 forex markets 24 hours a day with FXOpen. Take advantage of low commissions, deep liquidity, and spreads from 0.0 pips. Open your FXOpen account now or learn more about trading forex with FXOpen.
This article represents the opinion of the Companies operating under the FXOpen brand only. It is not to be construed as an offer, solicitation, or recommendation with respect to products and services provided by the Companies operating under the FXOpen brand, nor is it to be considered financial advice.