Sample Category Title
Nikkei 225 Index Has Plummeted to a Nine-Month Low
As shown by the Nikkei 225 (Japan 225 on FXOpen) chart:
→ In less than a month, the index price has dropped by more than 25%, providing grounds to suggest the start of a bear market;
→ The price has approached the psychological level of 30,000 points – the last time the price was this low was in autumn 2023.
Bearish sentiment is being driven by a combination of the following factors:
→ Negative news from the US labour market, published on Friday – this has significantly increased discussions about the likelihood of a recession;
→ The Bank of Japan’s interest rate hike last Wednesday to support the excessively weak yen.
As we wrote on 15 July, while analysing the Nikkei 225 index (Japan 225 on FXOpen):
→ Signs of bearish activity were observed around the 41,330 level;
→ The upward channel may break in the second half of the year.
It turned out that the bullish channel was broken much earlier and in an extremely aggressive manner – the bulls attempted to resume the trend from its lower boundary (shown by the black arrow), taking advantage of the 38,000 support, but were defeated.
What could happen next?
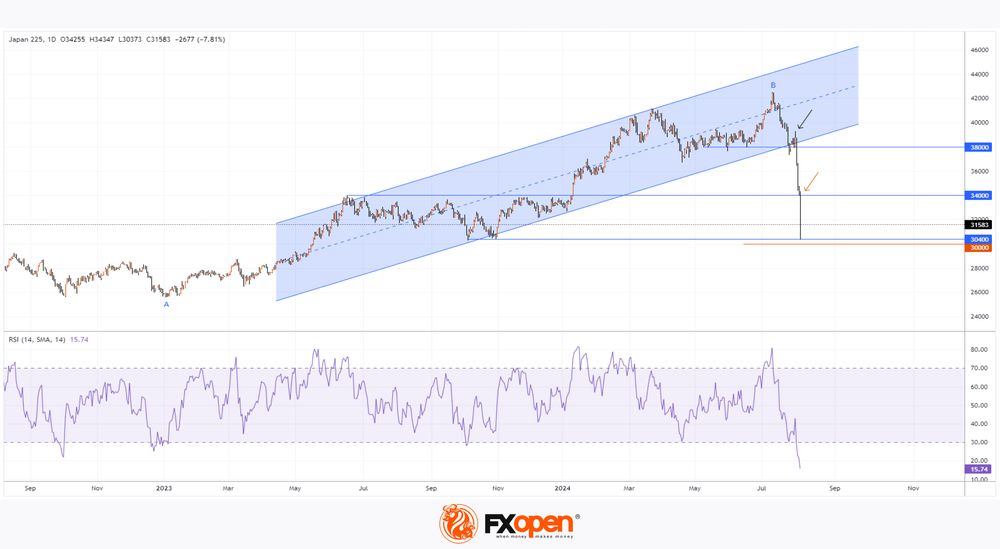
Technical analysis of the Nikkei 225 (Japan 225 on FXOpen) chart shows:
→ The price broke through (shown by the orange arrow) the previous resistance at 34,000, which is around 50% of the upward move from A to B;
→ The RSI index has moved into deep oversold territory;
→ The price has fallen into the region of the block formed by the 30,400 support and the psychological level of 30,000 – note the strong rebound from it, indicating the activation of demand (these are signs of an emotional selling climax in Wyckoff method terminology).
Given the abnormal surge in volatility, it is reasonable to assume that the market may enter a consolidation phase to establish a new balance of supply and demand, taking into account the latest news releases. It is possible that the mentioned support block will hold, and the 34,000 level will influence the Nikkei 225 (Japan 225 on FXOpen) price in forming the upper boundary of the anticipated consolidation range.
Trade global index CFDs with zero commission and tight spreads. Open your FXOpen account now or learn more about trading index CFDs with FXOpen.
This article represents the opinion of the Companies operating under the FXOpen brand only. It is not to be construed as an offer, solicitation, or recommendation with respect to products and services provided by the Companies operating under the FXOpen brand, nor is it to be considered financial advice.
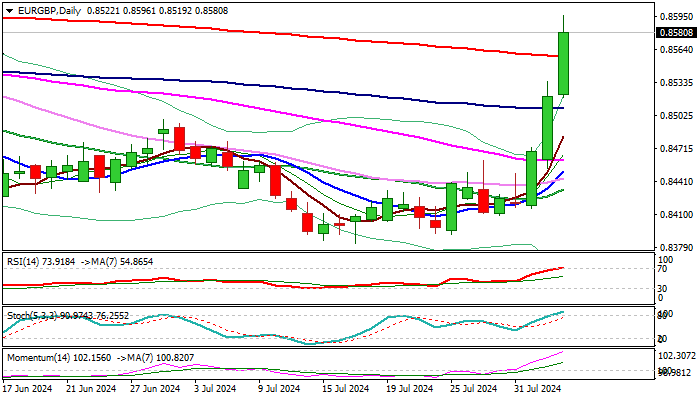
EUR/GBP: Overbought Conditions Warn of Correction of Steep Three-Day Rally
EUR/GBP – strong three day rally (the cross was up 2.1%) started to lose traction after hitting fresh high of nearly three months on Monday (0.8596).
Overbought daily studies warn of partial profit taking following steep ascend, which will mark positioning for fresh push higher.
Broken 200DMA offers initial support at 0.8558), followed by more significant top of thick daily cloud (0.8520) which should ideally contain pullback., though deeper dips cannot be ruled out and expected to find footstep at 0.8500 zone (broken 100DMA / former top of July 1).
Caution on dip below cloud base (0.8466) which would sideline bulls.
Res: 0.8596; 0.8620; 0.8643; 0.8682.
Sup: 0.8558; 0.8520; 0.8490; 0.8461.
Rapid Yen Appreciation: Key Factors Boosting JPY
The Japanese yen continues its recovery rally. The USDJPY pair falls to 143.38 on Monday.
This development is likely only the midpoint of the process as the market regains past losses and brings the JPY to equilibrium. USDJPY is currently at its lowest level since 3 January.
Several reasons are driving this movement. The first is the winding down of carry trade operations on the yen. The process started earlier when it became clear that the Bank of Japan was moving towards tightening monetary conditions.
The second concern is that a US recession is playing an important role. Friday's employment data was weaker than expected, triggering fears that the Federal Reserve might delay its decision on interest rate cuts. The market is worried the Fed could be late in making a crucial decision.
The third key factor for the JPY is the increased attractiveness of the yen as a safe-haven asset amid escalating geopolitical tensions in the Middle East. The ongoing conflict in the region poses a hypothetical threat to global stability, and investors are factoring in this risk and favouring safe-haven assets.
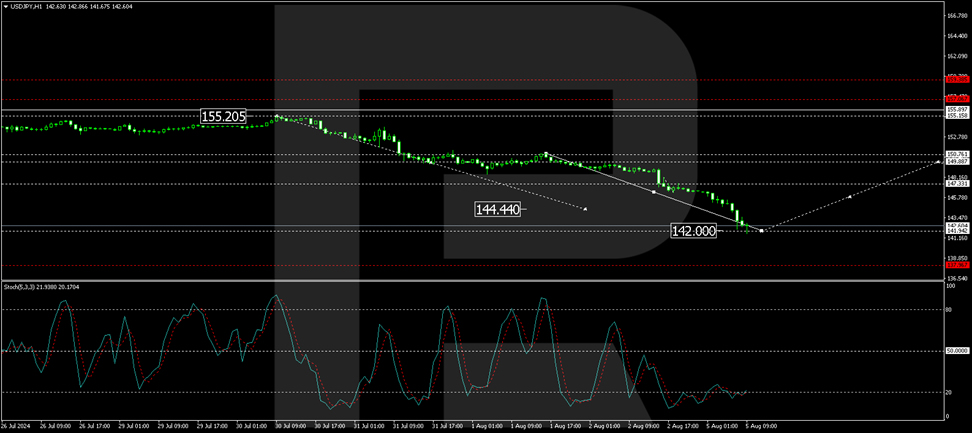
Technical analysis: USD/JPY
The pair formed a consolidation range of around 149.80 before breaking downwards on impactful news. The decline reached 142.00, setting a local low. We anticipate a new consolidation phase above this level. An upward break could see a corrective move towards 149.80. Conversely, a downward exit might extend losses towards 138.10. The MACD indicator supports this bearish outlook, showing continued downward momentum.
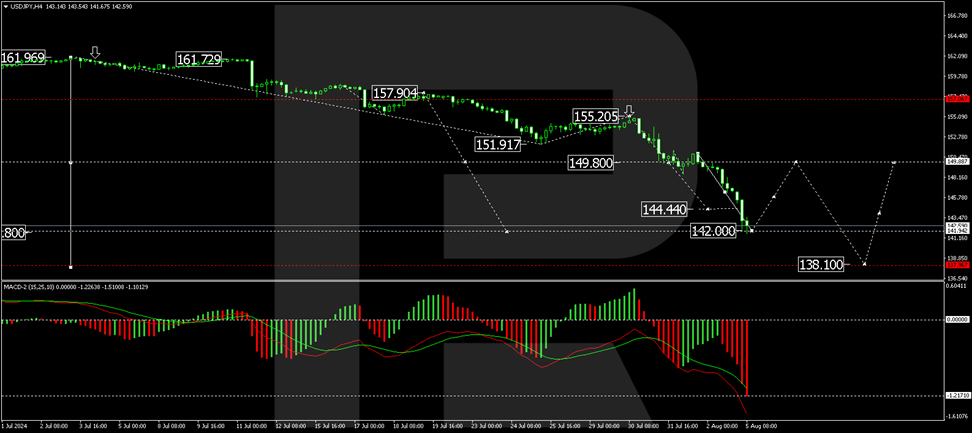
After reaching 142.00, a corrective phase to 147.33 may unfold, representing an intermediate target. Following this correction, a further decline to 144.66 could occur. This analysis aligns with the Stochastic oscillator, indicating a potential for an upward correction from oversold levels.
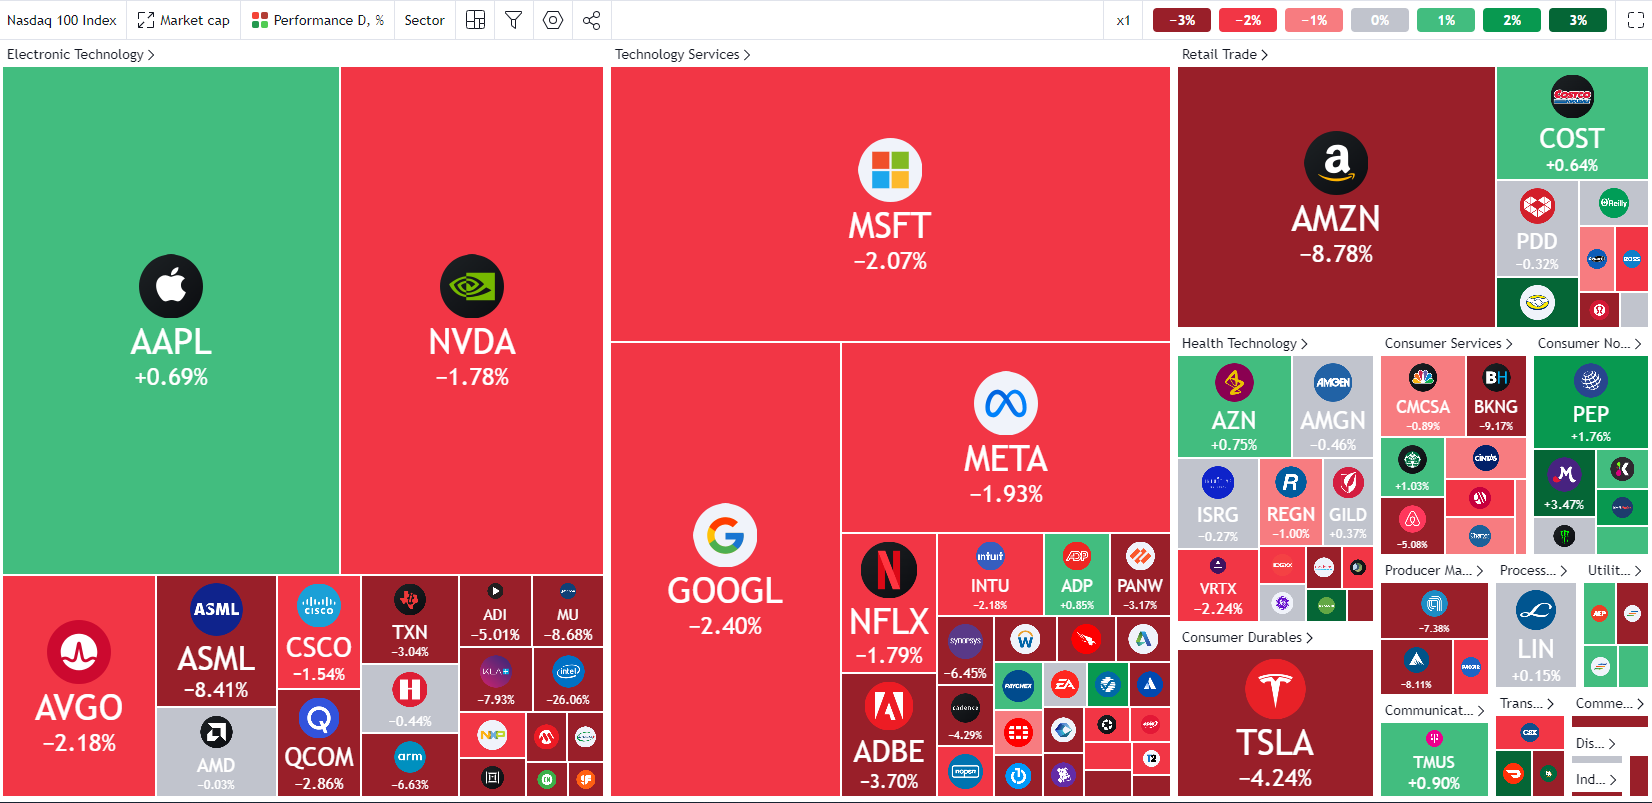
Global Stock Rout as Nasdaq 100 Futures Falls 6%, Safe Havens Bid
- Global markets extend losses, Nikkei plummets, Nasdaq 100 enters correction territory.
- Selloff attributed to recession fears, profit-taking, and geopolitical tensions.
- Goldman Sachs raises recession odds, Australian government increases terrorism threat level.
- Nasdaq 100 technical analysis indicates potential for further decline or dip-buying rebound.
Global markets extended their losses in Asian trading as concerns about a global recession continued to weigh on sentiment. In Japan, the Nikkei has dropped by as much as 12%, marking its largest two-day decline in history with a total loss of 18.2%.
The Nasdaq 100 fell by as much as 6.5% as the “Magnificent 7” stocks continued to decline, with NVIDIA down approximately 8.8% in pre-market trading. This has firmly placed the index in correction territory. A report indicating that the company’s new AI chip will be delayed did not help matters, though the selloff is more attributable to global sentiment.
Source: TradingView (click to enlarge)
Despite the economic slowdown that markets are anticipating, the magnitude of the selloff does resemble panic selling in many ways. However, given the unprecedented rally in the first half of 2024, much of this could also be attributed to profit-taking and repositioning. The S&P 500 exemplifies this shift, having shed only 3% month-to-date (MTD) and down around 7% from its recent all-time high of approximately 5669.
Safe havens experienced some gains this morning, with gold opening higher and reaching a peak of $2458/oz before retreating. Currently, the precious metal is down around 0.5% for the day. In the forex market, the Yen and the Swiss Franc have benefited from rising safe haven appeal and the unwinding of carry trades.
Changes in rate cut expectations have been accompanied by an increase in recession probabilities. Goldman Sachs has raised its 12-month recession odds by 10 percentage points to 25%, according to an analyst note. Goldman further indicated that another weak job report in September could prompt a 50 basis points cut by the Federal Reserve.
Meanwhile, geopolitical tensions in the Middle East continue to keep market participants on edge. This was exacerbated by the Australian Government raising its terrorism threat level to “probable” from “possible,” citing a global rise in politically motivated violence and extremism. This move could be in response to widespread riots across the UK over the weekend, which targeted immigration.
With markets already contending with a range of external threats, these new developments only add another layer of uncertainty moving forward.
US Earnings and Data Releases
Later in the day we will get a peak at the employment numbers from the service sector as the ISM non-manufacturing data is released. This will be the major piece of economic data from the US and could mean that market moves will largely be driven by external factors this week.
On the earnings front, Disney (DIS.N) will report this week but Caterpillar (CAT.N) will likely get more attention. Caterpillar may provide some insight into the state of the consumer and manufacturing as well.
Technical Analysis Nasdaq 100
From a technical perspective, the Nasdaq 100 is in correction territory. Last week’s selloff continued into the Asian session, with the index tapping into a key support area around 17300 before a significant rebound. At the time of writing, the index is trading at 17730.
Price is currently testing the 200-day moving average (MA), and a continued selloff could see the index revisiting the daily low around the 17300 level. A break below this point opens up the possibility of testing support at the 17000 mark and potentially the 16600 mark.
Conversely, a deeper retracement and some dip buying could push the index toward resistance at the 18416 level. Beyond this, the 100-day MA and resistance around the 19000 handle may come back into focus.
Nasdaq 100 Chart, August 5, 2024
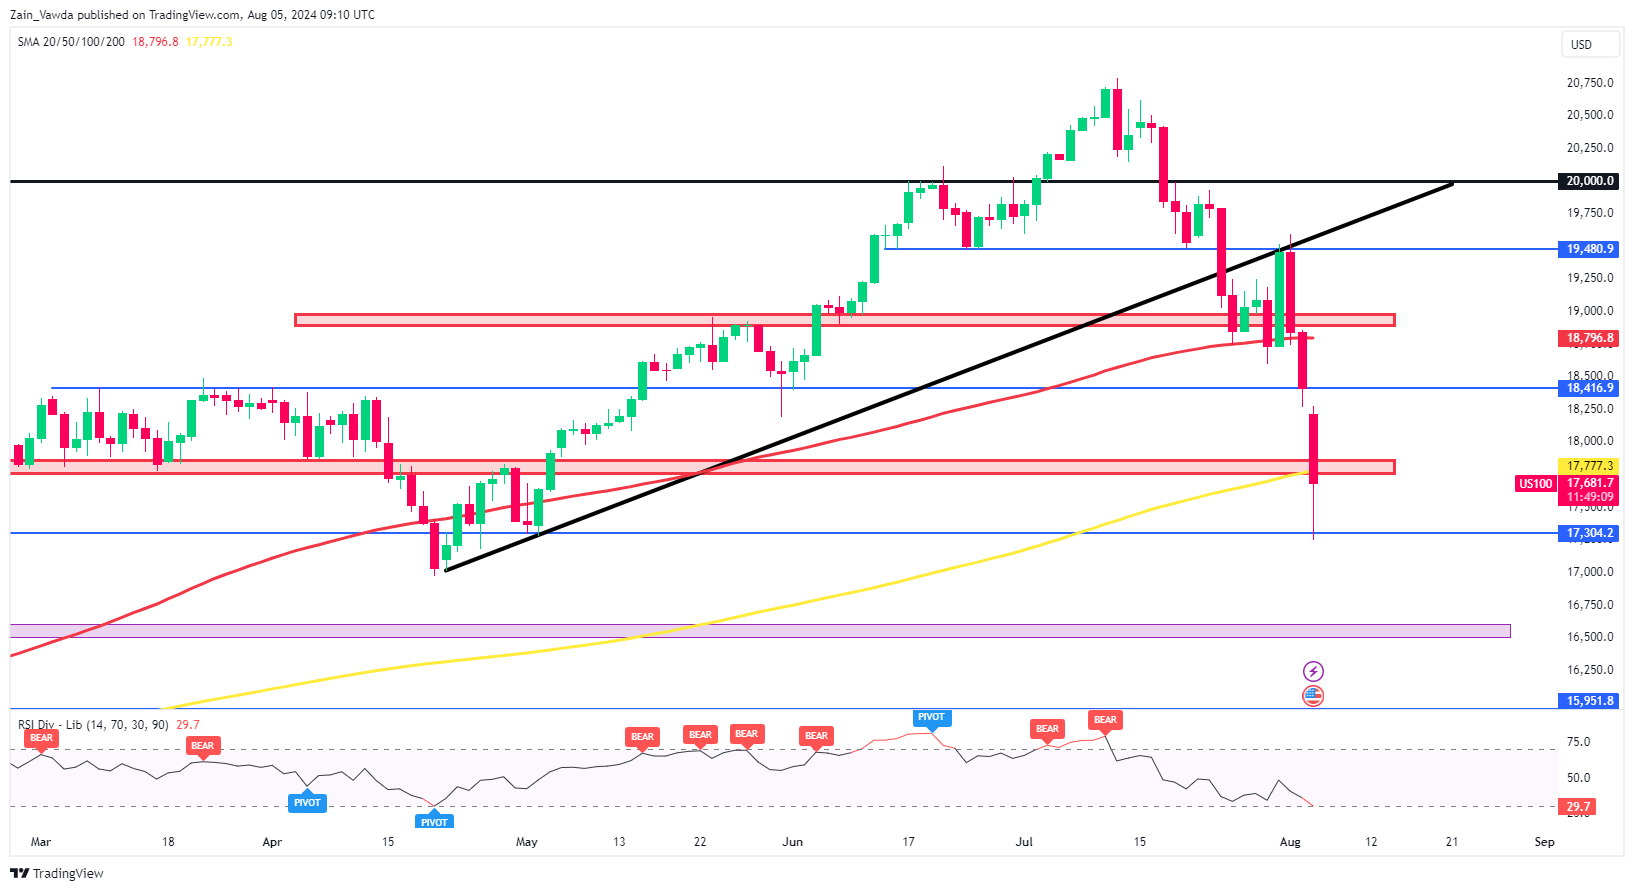
Source: TradingView (click to enlarge)
Support
- 17300
- 17000
- 16600
Resistance
- 18416
- 18800
- 19000
Fact of the Day: Berkshire Hathaway Have Reduced Their Stake in Apple by 55.8% Since the End of 2023.
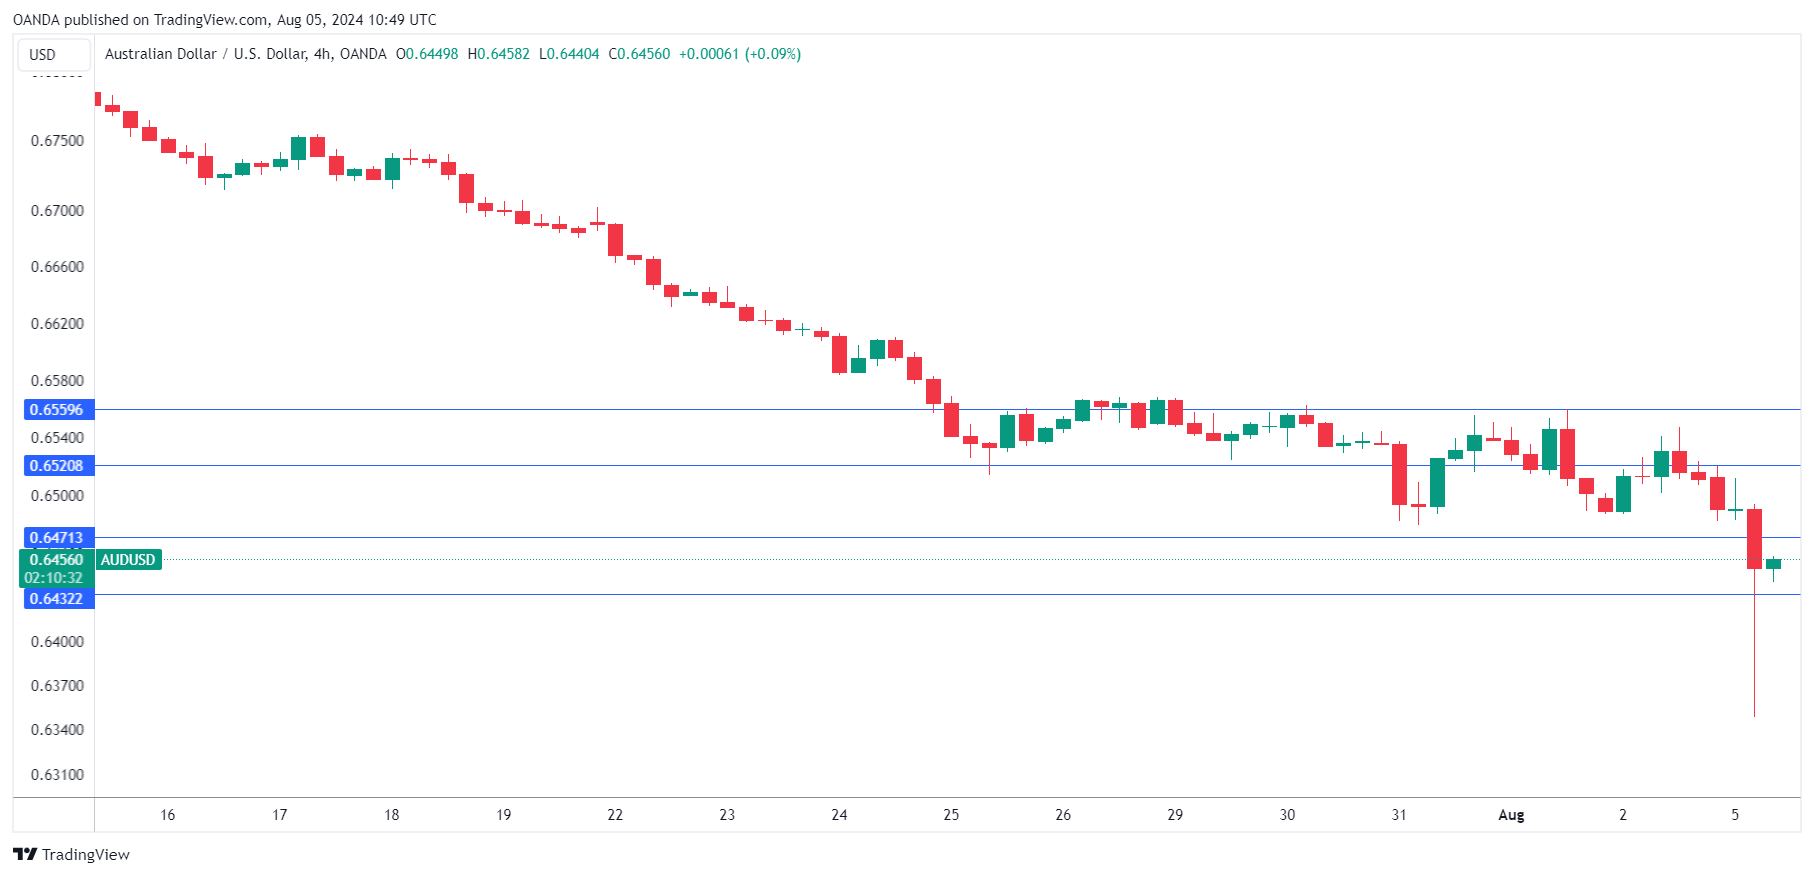
Aussie Slides on Fears Over the US Economy
The Australian dollar has taken a nasty spill to start off the trading week. AUD/USD dropped as much has 2.5% in the Asian session and fell to its lowest levels since November 2023. The Aussie has pared those losses and is down 0.96% at the time of writing, trading at 0.6448.
RBA likely to deliver hawkish hold
The Reserve Bank of Australia meets early Tuesday and it’s a virtual certainty that the Bank will hold the cash rate at 4.35%. The RBA has maintained rates six straight times and policy makers have discussed raising rates at recent meetings. This goes against the grain of the current trend in which central banks are lowering rates.
The RBA would prefer to lower rates, which are at a 12-year high and are squeezing businesses and households. The problem remains stubborn inflation, which moved the wrong way in the second quarter, rising from 3.6% to 3.8%. This is well above the RBA’s upper band of its target range of between 1 and 3% and it won’t be a surprise if policy makers again debate raising rates at tomorrow’s meeting before keeping rates on hold.
With the RBA expected to stay pat, the markets will be focusing on the rate statement and Governor Bullock’s press conference. The message from the RBA is expected to be along the lines that inflation remains too high and it’s premature to cut interest rates.
Fed expected to stay on sidelines
The Federal Reserve is aiming for a soft landing for the US economy, but concerns are rising that the economy could tip into recession. US nonfarm payrolls for July slowed to 114 thousand on Friday, much lower than the revised 179 thousand in June and the market estimate of 175 thousand.
The labour market has cooled much more quickly than expected, and there have been calls for an emergency unscheduled rate cut. The Fed would prefer not to make such a move, which could panic the markets, but the next meeting on September 18th is looking far away. Can the Fed afford to wait until then to deliver a rate cut?
AUD/USD Technical
- AUD/USD pushed through 0.6471 and is testing support at 0.6432
- There is resistance at 0.6520 and 0.6559
Could Data Open the Door to RBNZ Cut Next Week?
- Market in crisis mode after Friday’s US labour report
- An RNBZ rate cut could be on the cards if data weakens
- China’s problems hamper progress in the region
- Kiwi in desperate need of good data prints
Markets in disarray
With the market digesting last week’s events, especially Friday’s US labour market report that triggered discussions of a US recession, and the heightened probability for aggressive rate cuts by the Fed during 2024, the focus turns to the Asia-Pacific region. The RBA is holding its rate-setting meeting on Tuesday with the market seeing decent chances of a rate hike while the neighboring Reserve Bank of New Zealand is preparing for its August 14 gathering.
Is the RBNZ ready to pull the trigger?
The early July RBNZ meeting proved slightly more dovish than widely expected as Governor Orr et al were possibly keeping their options open while waiting for the critical end-July Fed gathering. However, they did highlight the importance of incoming inflation data by stating that “the extent of this monetary policy restraint will be tempered over time consistent with the expected decline in inflation pressures.”
The inflation report for the second quarter of 2024 surprised on the downside and showed a significant slowdown in quarterly CPI. The year-on-year figure dropped to the lowest level since July 2021 and, while it is still above the 1-3% target range, a downtrend is firmly in place. The market is currently fully pricing in a 25bps rate cut at the early October meeting, with a non-negligible chance for a move next week.
The remaining data since the July RBNZ meeting, for example consumer confidence and business sentiment surveys, have been positive but the focus is now firmly on Tuesday’s employment report and Thursday’s inflation expectations indicator published by the RBNZ.
Considering that the latter reflects the business managers´ inflation expectations two years from now, this indicator has been successfully capturing the recent disinflationary trend. The last print in May dropped to 2.33%, the lowest level since August 2021. Another move lower on Thursday would cement rate cut expectations by the RBNZ, since inflation will probably return to the 1-3% target range during Q3.
Importantly, the labour market report for the second quarter of 2024 will be published on Tuesday. Compared to other regions, the unemployment rate has been aggressively climbing higher since the 2022 lows, helping labour costs gradually ease, in effect removing one of the main headaches faced by other central banks.
China’s problems hamper growth in the region
Staying in the region, the market remains gravely concerned about China. The recent interest rate reductions could ease the pressure on the banking sector, but they probably cannot solve the housing sector problem. China’s Politburo highlighted the administration’s focus on supporting domestic demand, but this is a colossal task when the housing market is struggling.
Following the recent downside surprise in GDP for the second quarter of 2024 and the mixed PMI surveys, the calendar this week is rich with trade data and Friday’s inflation report. Since printing at 0.7% in March 2023, headline CPI has been drifting lower, which is another indication of low domestic demand. An upside surprise on Friday is probably not in the cards, but inflation could rise in the medium-term if the producer price index maintains its recent uptrend from the mid-2023 lows.
Kiwi could benefit from stronger data
The kiwi remains under pressure as the strong correction in the kiwi/dollar pair from the early June highs might still have legs, despite the dollar weakening across the board on the back of expectations for aggressive easing by the Fed.
A positive set of data releases this week could considerably dent the decent chances of a rate cut at next week’s RBNZ meeting and allow the kiwi to resume its climb towards the 0.6050 area.
On the flip side, the combination of a weakening labour market and softer inflation expectations could really put Governor Orr et al in a dilemma to cut, thus reducing chances for a meaningful recovery in the kiwi.
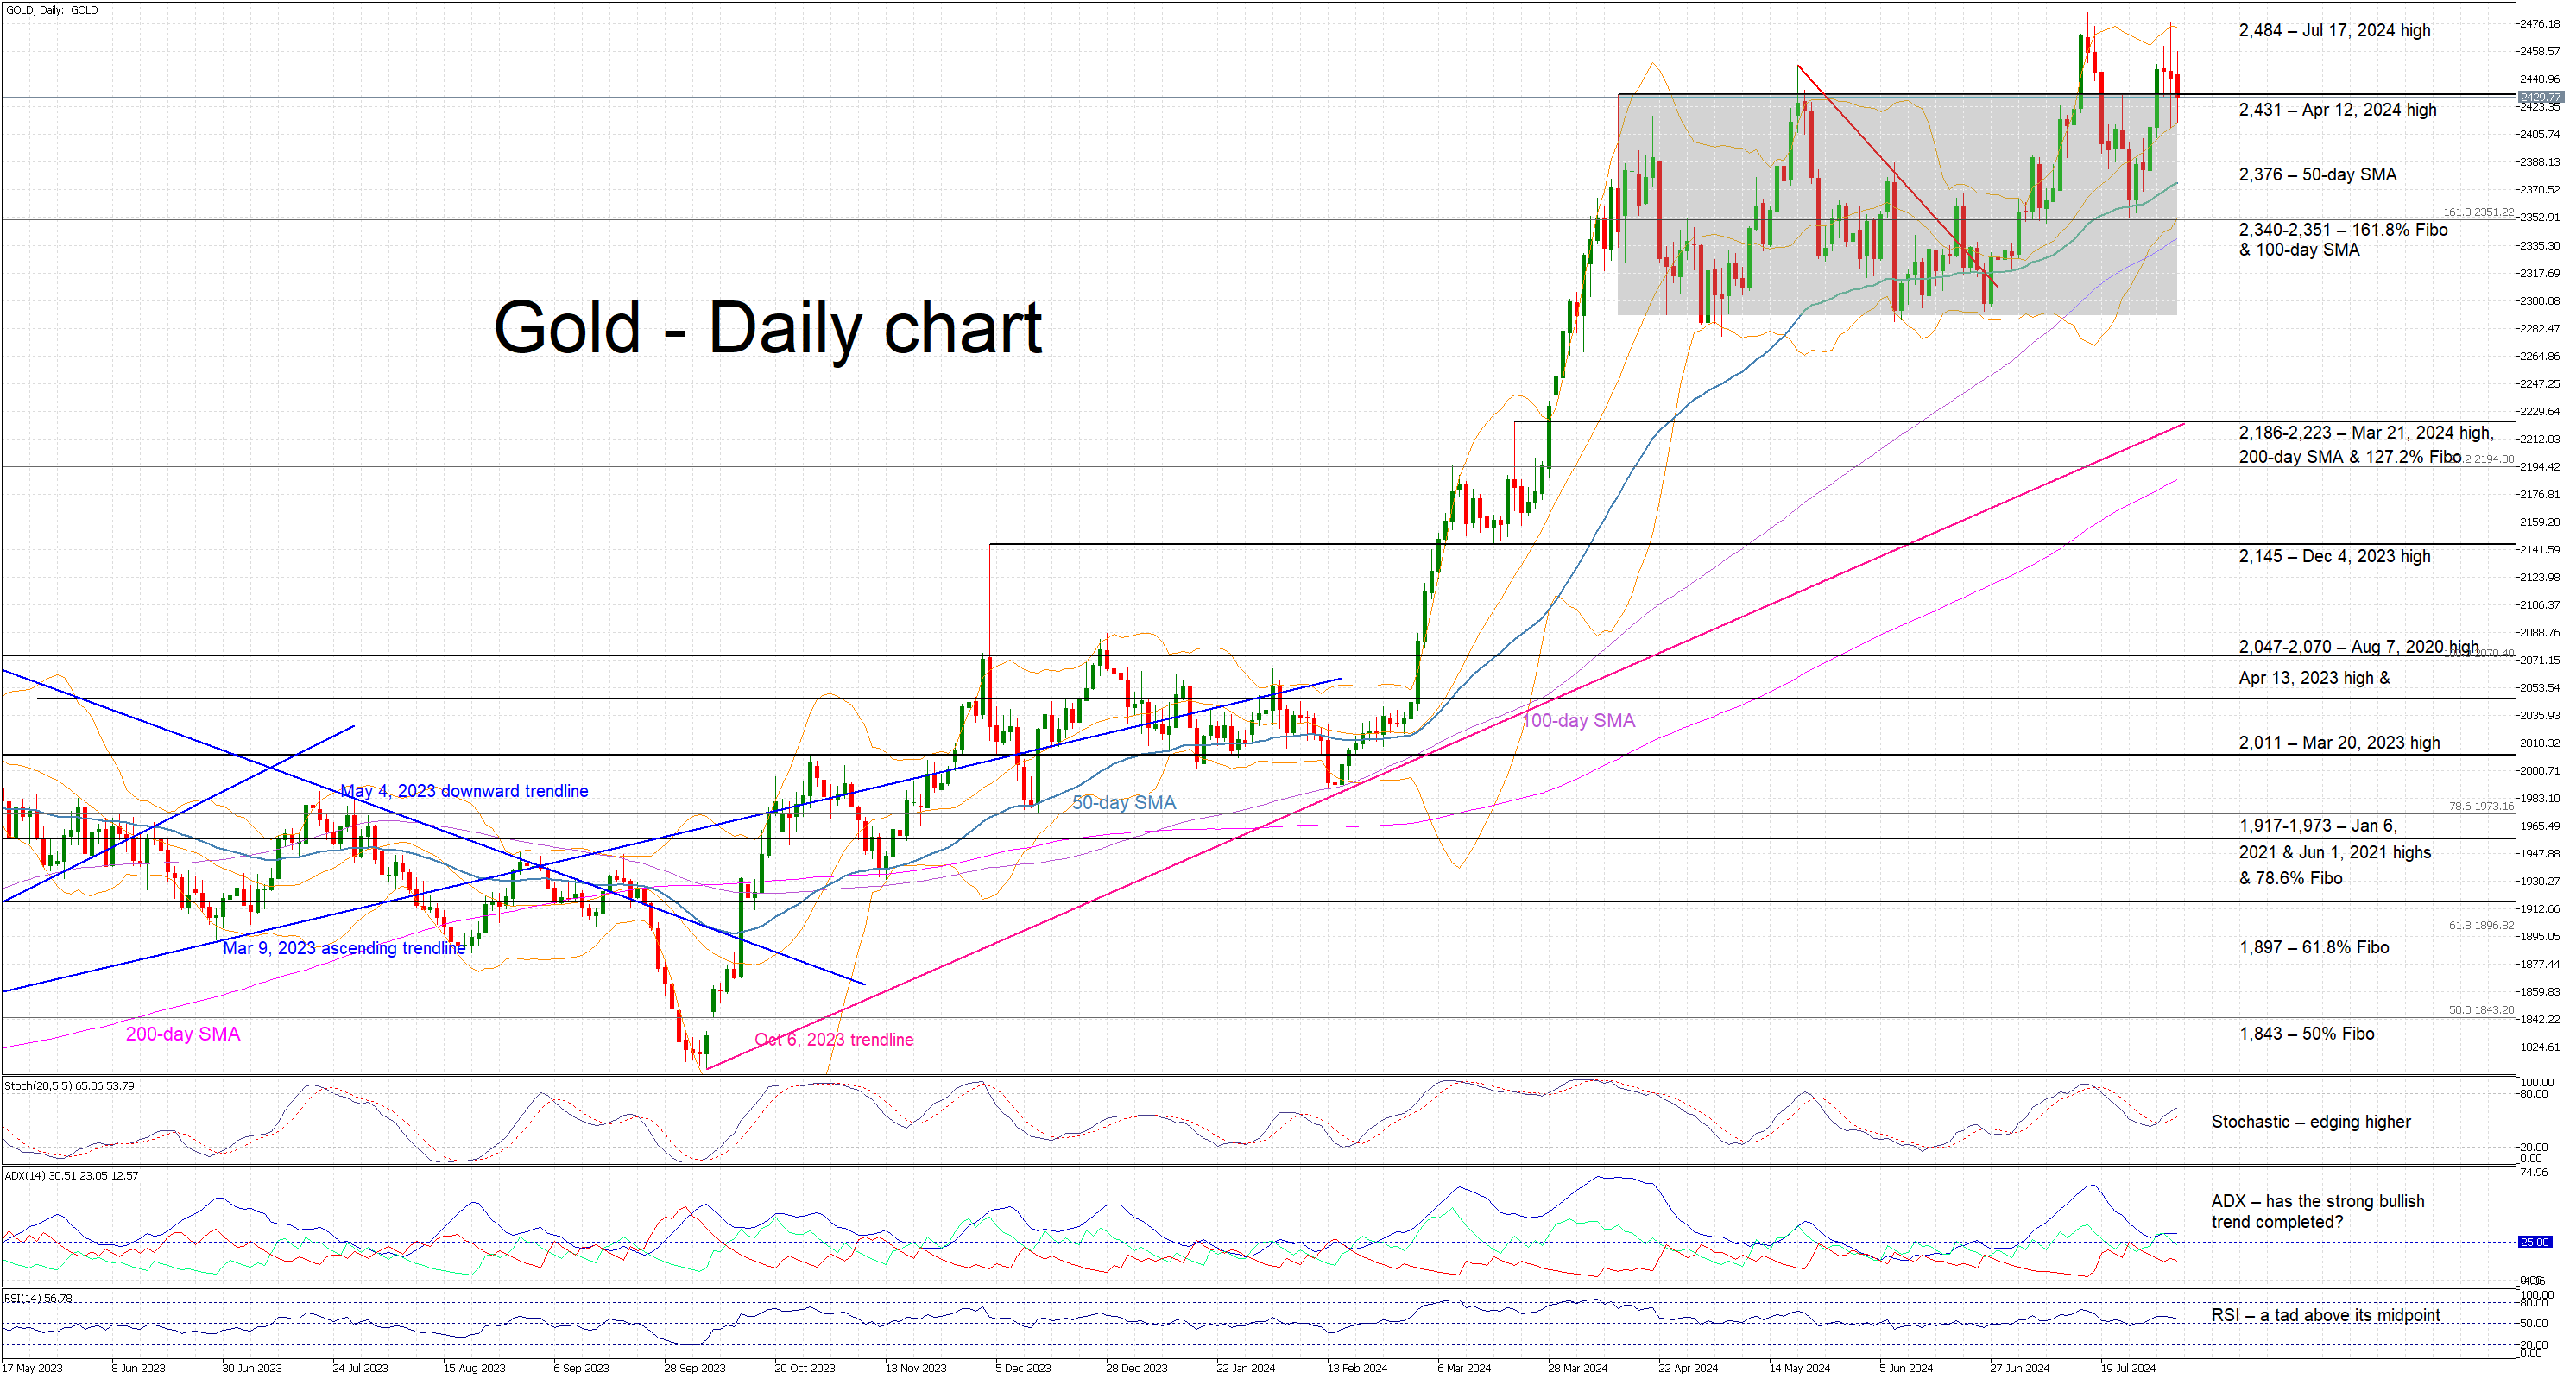
Gold Rally in Question
- Gold is lower today, but close to recent highs
- Geopolitics and dollar underperformance support gold
- Momentum indicators are tentatively bullish
Gold is trading lower again today, recording its third consecutive red candle, but remaining a tad below its recent all-time high. It is currently testing the upper boundary of the rectangle that has been defining market action since early April. Developments in the Middle East, the increased chances of an aggressive easing by the Fed and the stock markets being under pressure are possibly limiting the bears’ ability to stage a strong correction.
In the meantime, the momentum indicators are tentatively bullish. The RSI remains above its midpoint but shows little appetite for a move higher. Similarly, the Average Directional Movement Index (ADX) is hovering a tad above its 25 midpoint and thus pointing to a muted bullish trend in gold. More importantly, the stochastic oscillator has crossed above its moving average (MA) and it is currently moving towards its overbought territory.
Should the bulls remain hungry, they could try to keep gold above the recent rectangle and the April 12, 2024 high at 2,431, and then gradually stage a move, which might not be as straightforward as it sounds, towards the all-time high of 2,484.
On the flip side, the bears are keen for the current correction to pick up speed. They could try to push gold below the 2,431 level and then have a go at overcoming the support set by the 50-day simple moving average (SMA) at 2,376. If successful, they could then lead gold towards the busier 2,340-2,351 range, which is populated by the 100-day SMA and the 161.8% Fibonacci extension of March 8, 2022 – September 28, 2022 downtrend.
To sum up, gold is in the red today, and increasing risk appetite is most likely needed for gold bears to retake market control.
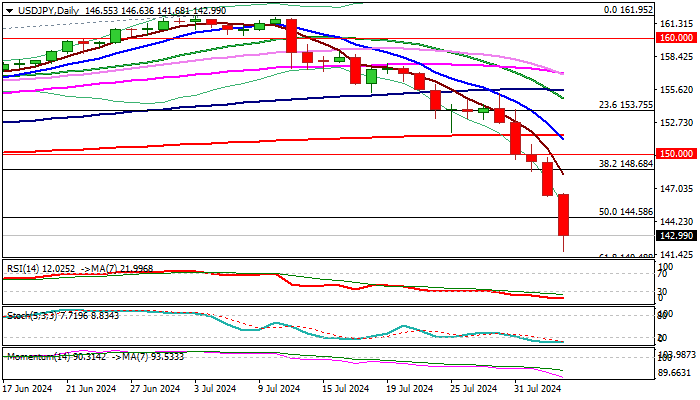
USD/JPY: Falls to Eight-Month Low, Eyes Key 140.00 Support Zone
USDJPY fell sharply overnight, hitting the lowest since early January, extending steep bear-leg off 155.21 lower top into fifth consecutive day.
The pair was down 3.3% in Asian session on Monday, remaining under increased pressure after downbeat US NFP data further soured dollar’s sentiment.
Large bearish candle of last week (USDJPY was down 4.7% for the week, in the biggest weekly drop since the second week of November 2022) weighs heavily on near-term action, in addition to firmly bearish daily studies (the latest formation of 5/200 and 10/200DMA death-cross) reinforcing negative near-term outlook.
Key supports at 140.25/00 (Dec 28 low / psychological) are coming in focus), though strongly oversold conditions on daily chart may spark a partial profit-taking.
Bounce is likely to be limited and ideally capped under today’s peak at 146.63, to provide better levels for re-entering bearish market, for push towards 140 zone, violation of which to generate another strong bearish signal.
Res: 144.58; 146.48; 146.68; 148.68.
Sup: 141.68; 141.00; 140.25; 140.00.
Crypto Investors Have Lost Their Nerve
Market picture
The cryptocurrency market was hit by a sell-off over the weekend, the likes of which haven’t been seen in a long time. We would not have been surprised to see such a sell-off before the halving due to the last takeout of buyers before the start of active growth. There is nothing unusual about such a downward amplitude in a bear market either, but not now, when the 4-year cyclical pattern should work on the bulls’ side.
Our pessimistic scenario of a 20% decline in capitalisation to the $1.79 area has worked out, having made a very fast drop to the lower boundary of the corridor since March.
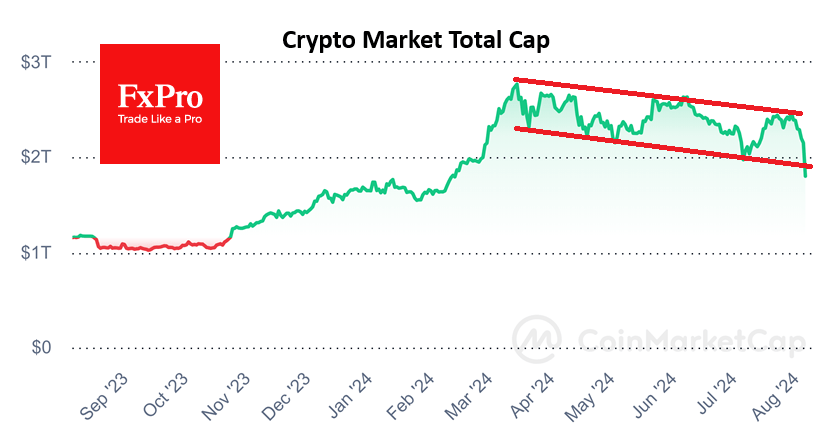
Bitcoin is down 13.5% from its peak at last week’s close and has lost another 15% since the start of the day on Monday, falling below $49K at one point. Active pressure on the first cryptocurrency started after a failed attempt to go above $70K and overcome the resistance of the descending channel seven days ago.
At the same time, its lower boundary turned out to be not so strong, and the price flew through it with an acceleration, finding itself also under the 50- and 200-day moving averages. Worse, at its lowest point, Bitcoin dipped below its 50-week average. Without strong buyer support right now, it goes even lower, and it would trigger an even more active sell-off as it did in late 2021 and early 2022. If it doesn’t hold either, it’s worth preparing for a failure towards $42K.

News background
According to forecasting platform Polymarket, 48% of users believe Bitcoin will fall below the $60K mark in August. 26% of customers bet that BTC will drop to $55K. 12% of users anticipate the first cryptocurrency to collapse to $50K. Historically, August and September are considered the weakest months for BTC.
MicroStrategy acquired an additional 12,222 BTC for $805 million in Q2, bringing its total holdings to 226,500 BTC (~$14.7 billion). The average purchase price was $36,821 per coin; they spent a combined $8.5bn.
According to CNBC, Morgan Stanley’s 15,000 financial advisors will offer spot bitcoin-ETF investments to their clients. The bank made this move first among Wall Street giants, reflecting the new stage of Bitcoin adoption. The reason behind the decision was the high demand from customers.
VanEck CEO Jan Van Eck said the first cryptocurrency is maturing, and its capitalisation will eventually reach half that of gold. Based on gold’s current market capitalisation, the forecast calls for BTC to rise to $350,000 per coin. If central banks incorporate bitcoin into their ecosystems, it could potentially boost the asset’s price to $1 million.
Hong Kong’s largest online brokerage, Futu Securities International, has launched cryptocurrency trading for its 22 million users. Customers can trade BTC and ETH using Hong Kong dollars or US dollars.
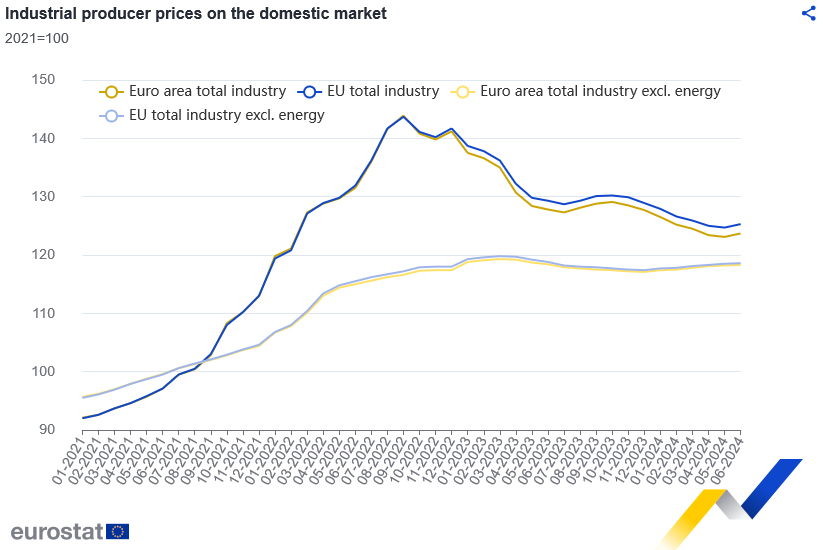
Eurozone PPI at 0.5% mom, -3.2% yoy in Jun
Eurozone PPI rose 0.5% mom in June, but down -3.2% yoy, comparing to expectation of 0.3% mom, -3.2% yoy. For the month. Industrial producer prices increased by 0.1% for intermediate goods,1.6% for energy, 0.1% for capital goods, and 0.1% for non-durable consumer goods. Prices remained stable for durable consumer goods
EU PPI was up 0.5% mom, down -3.1% yoy. The highest monthly increases in industrial producer prices were recorded in Estonia (+2.2%), Spain and Romania (both +1.9%) and Greece (+1.8%). The largest decreases were observed in Bulgaria (-1.0%), Czechia, France and Finland (each -0.3%).