
Sample Category Title
RBA maintains cash rate, anticipates inflation resurgence post-mid-2025
RBA kept its cash rate target unchanged at 4.35%, as widely expected. Maintaining its stance of "not ruling anything in or out," the highlighted that underlying inflation "remains too high" and stated it will be "some time yet" before inflation sustainably returns to the target range. The central bank emphasized that monetary policy will need to be "sufficiently restrictive" until the Board is confident that inflation is moving sustainably towards the target range.
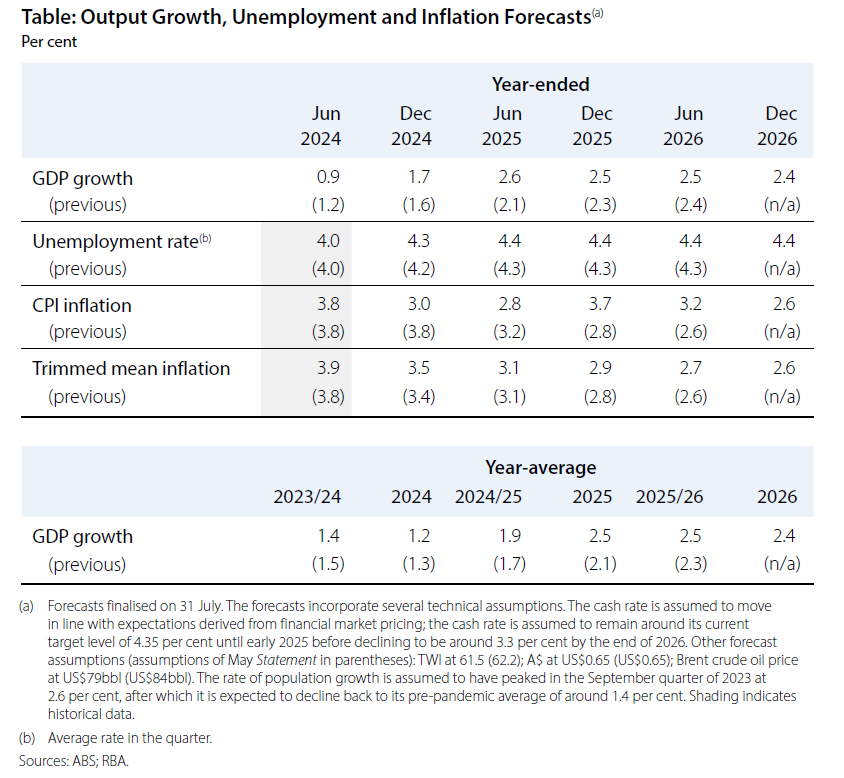
In its new economic projections, RBA forecasts headline inflation to briefly dip to 2.8% in June 2025, back in the target range, but expects it to surge above the target in subsequent quarters before falling back to 2.6% by the end of 2026. Meanwhile, growth projections have been generally upgraded.
Details of the new economic projections include:
CPI at:
- 3.0% by the end of 2024, downgraded from the prior 3.8%.
- 3.7% by the end of 2025, upgraded from the previous 2.8%.
- 2.6% by the end of 2026 (new projection).
Trimmed mean CPI at:
- 3.5% by the end of 2024, up from 3.4%.
- 2.9% by the end of 2025, up from 2.8%.
- 2.6% by the end of 2026 (new projection).
Year-average GDP growth in:
- 2024 downgraded from 1.3% to 1.2%.
- 2025 upgraded from 2.1% to 2.5%.
- 2026 projected to be 2.4% (new).
Unemployment rate at:
- 4.3% by the end of 2024, up from the prior 4.2%.
- 4.4% by the end of 2025, up from 4.3%.
- be 4.4% by the end of 2026 (new projection).
(RBA) Statement by the Reserve Bank Board: Monetary Policy Decisions
At its meeting today, the Board decided to leave the cash rate target unchanged at 4.35 per cent and the interest rate paid on Exchange Settlement balances unchanged at 4.25 per cent.
Inflation remains above target and is proving persistent.
Inflation has fallen substantially since its peak in 2022, as higher interest rates have been working to bring aggregate demand and supply closer towards balance. But inflation is still some way above the midpoint of the 2–3 per cent target range. In underlying terms, as represented by the trimmed mean, the CPI rose by 3.9 per cent over the year to the June quarter, broadly as forecast in the May Statement on Monetary Policy (SMP). But the latest numbers also demonstrate that inflation is proving persistent. In year-ended terms, underlying inflation has now been above the midpoint of the target for 11 consecutive quarters. And quarterly underlying CPI inflation has fallen very little over the past year.
The outlook remains highly uncertain.
The economic outlook is uncertain and recent data have demonstrated that the process of returning inflation to target has been slow and bumpy.
The central forecasts set out in the latest SMP are for inflation to return to the target range of 2–3 per cent late in 2025 and approach the midpoint in 2026. This represents a slightly slower return to target than forecast in May, based on estimates that the gap between aggregate demand and supply in the economy is larger than previously thought. In part, this reflects an increase in the forecast for domestic demand. But it also reflects a judgement that the economy's capacity to meet that demand is somewhat weaker than previously thought, evidenced by the persistence of inflation and ongoing strength in the labour market.
There is substantial uncertainty around these forecasts. Revisions to consumption and the saving rate in the most recent National Accounts, high unit labour costs and the persistence of inflation – particularly in the services sector – suggest there are upside risks to inflation. Wages growth appears to have peaked but is still above the level that can be sustained given trend productivity growth.
On the other hand, momentum in economic activity has been weak, as evidenced by slow growth in GDP, a rise in the unemployment rate and reports that many businesses are under pressure. And there is a risk that household consumption picks up more slowly than expected, resulting in continued subdued output growth and a noticeable deterioration in the labour market.
More broadly, there are uncertainties regarding the lags in the effect of monetary policy and how firms' pricing decisions and wages will respond to the slower growth in the economy at a time of excess demand, and while conditions in the labour market remain tight.
There also remains a high level of uncertainty about the overseas outlook. The outlook for the Chinese economy has softened and this has been reflected in commodity prices. Some central banks have eased policy, although they remain alert to the risk of persistent inflation. Globally, financial markets have been volatile of late and the Australian dollar has depreciated. Geopolitical uncertainties remain elevated, which may have implications for supply chains.
Returning inflation to target is the priority.
Returning inflation to target within a reasonable timeframe remains the Board's highest priority. This is consistent with the RBA's mandate for price stability and full employment. To date, longer-term inflation expectations have been consistent with the inflation target and it is important that this remain the case.
Inflation in underlying terms remains too high, and the latest projections show that it will be some time yet before inflation is sustainably in the target range. Data have reinforced the need to remain vigilant to upside risks to inflation and the Board is not ruling anything in or out. Policy will need to be sufficiently restrictive until the Board is confident that inflation is moving sustainably towards the target range.
The Board will rely upon the data and the evolving assessment of risks to guide its decisions. In doing so, it will continue to pay close attention to developments in the global economy and financial markets, trends in domestic demand, and the outlook for inflation and the labour market. The Board remains resolute in its determination to return inflation to target and will do what is necessary to achieve that outcome.
Oil (CL) Should Continue Lower to Build an Impulsive Structure
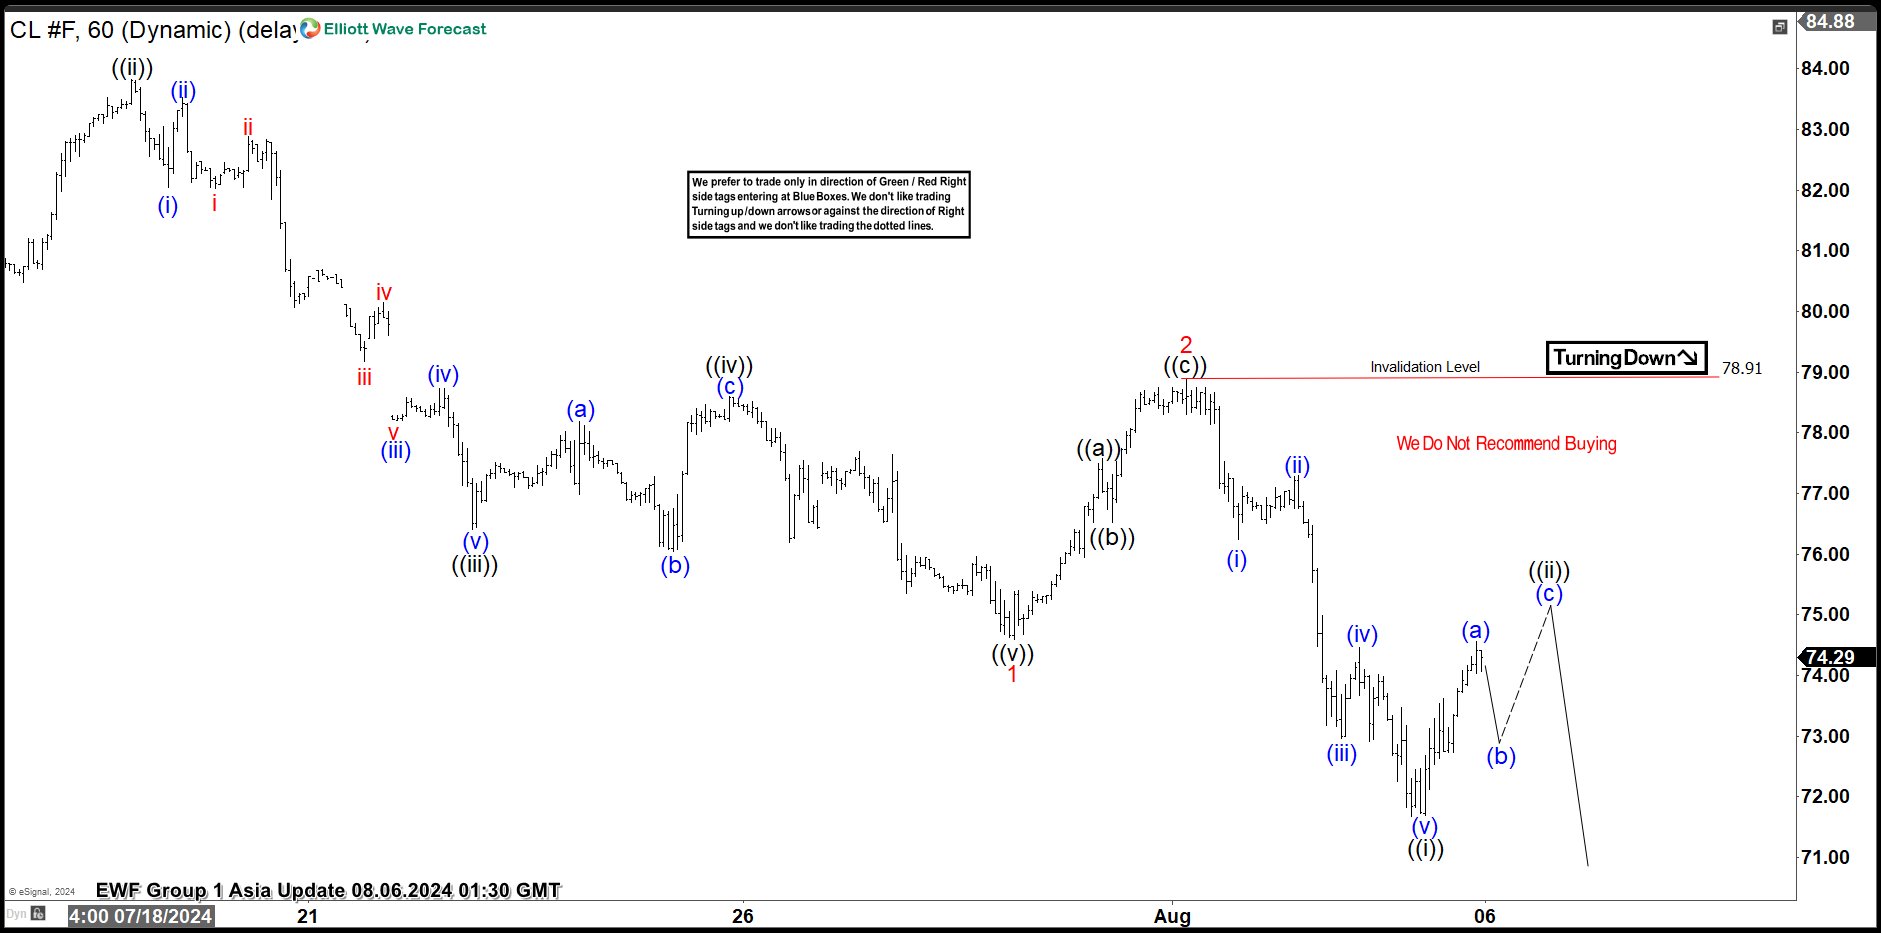
Short Term Elliott Wave View in Oil (CL) suggests that cycle from 4.12.2024 high is in progress as a 5 waves impulse Elliott Wave structure. Down from 4.12.2024 high, wave (1) ended at 72.48 and rally in wave (2) ended at 84.55. The commodity has turned lower in wave (3) with internal subdivision as another impulse in lesser degree. Down from wave (2), wave (i) ended at 83.07 and rally in wave (ii) ended at 83.45. Oil then extended lower in wave (iii) towards 81.25 and wave (iv) ended at 82.16. Final leg wave (v) ended at 80.81 which completed wave ((i)) in higher degree. Wave ((ii)) unfolded in an expanded flat structure where wave (a) ended at 83.74. Wave (b) lower ended at 80.22, and rally in wave (c) ended at 83.82 which completed wave ((ii)).
Oil has turned lower in wave ((iii)) ended at 76.40 low. The market built an expanded flat correction as wave ((iv)) finishing at 78.60 high and turned lower again. CL broke below wave ((iii)) to end wave ((v)) of 1 at 74.59 low and also we ended wave 1 of (3). Up from wave 1, the market bounce in a zig zag correction ending wave 2 at 78.88 high and starting wave 3 of (3) to the downside. After 5 swings lower, wave ((i)) of 3 completed at 71.67 low and currently we are calling 3 swings higher to end wave ((ii)) pullback before resuming lower. Therefore, we expect further downside to complete wave ((iii)) of 3. Near term, as far as pivot at 78.88 high stays intact, expect rallies to fail in 3, 7, or 11 swing for further downside.
Oil (CL) 60 Minutes Elliott Wave Chart
CL Elliott Wave Video
https://www.youtube.com/watch?v=FRr-f6Y9O8o
Bitcoin Crashes Below $50K Amid Global Market Turmoil
Key Highlights
- Bitcoin price declined over 20% and even crashed below $50,000.
- BTC traded below a key bullish trend line with support at $67,500 on the 4-hour chart.
- USD/JPY tumbled and declined below the 145.00 support.
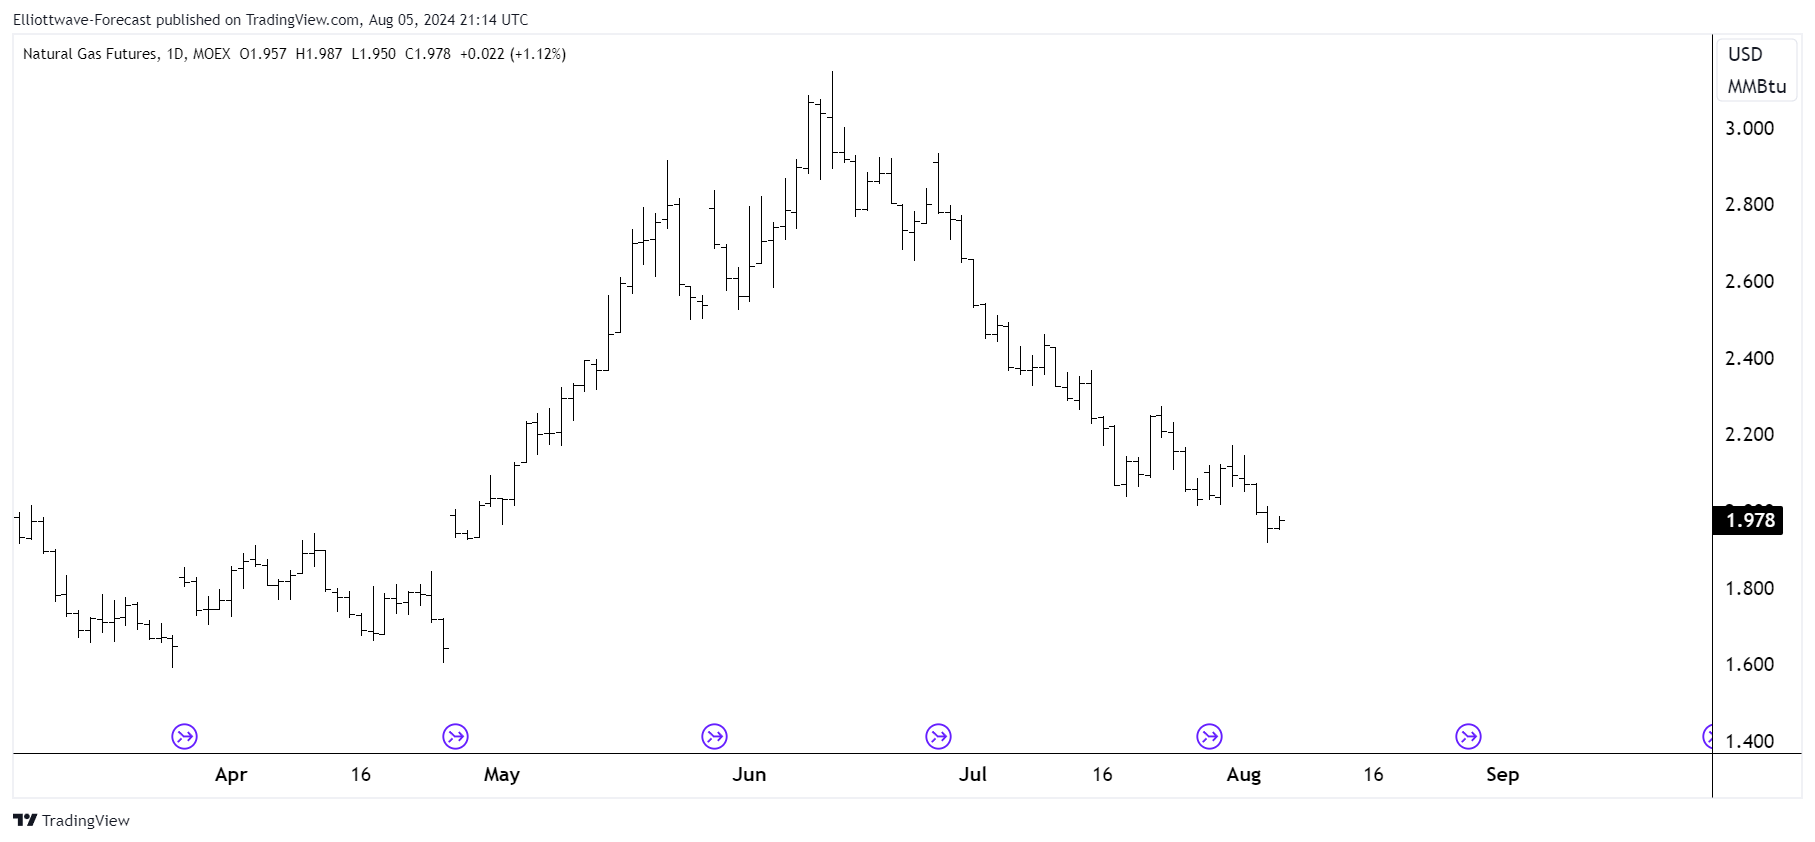
- Oil prices declined further and traded below $74.20.
Bitcoin Price Technical Analysis
Bitcoin price started a fresh decline after it failed to stay above $65,000. BTC/USD traded below the $63,500 and $62,000 support levels to enter a bearish zone.
Looking at the 4-hour chart, the price settled below the $60,000 level, the 100 simple moving average (red, 4 hours), and the 200 simple moving average (green, 4 hours). It seems like the increased prospect of a U.S. economic downturn and bigger rate cuts from the Federal Reserve caused major moves in stocks and cryptocurrencies.
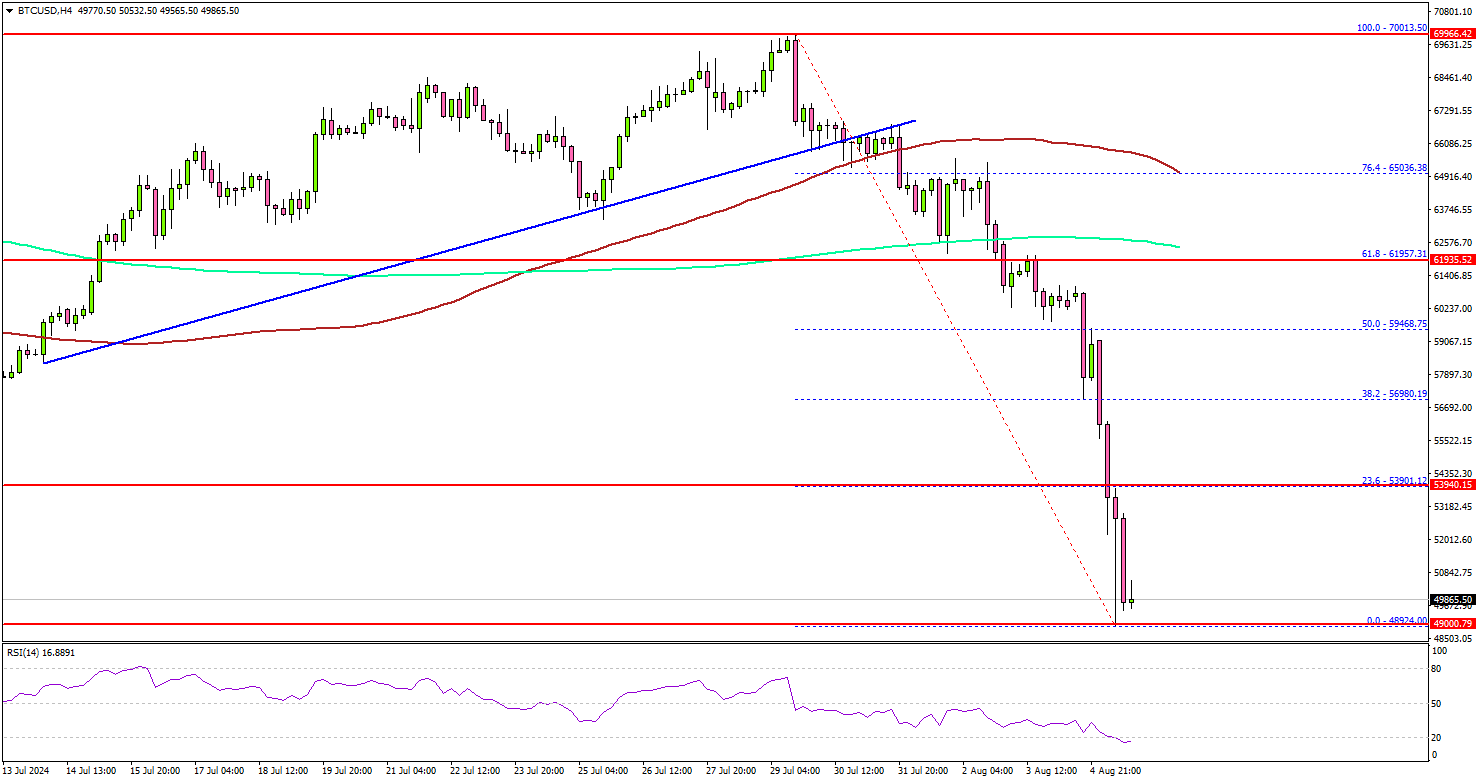
The Japanese yen rallied to seven-month highs as USD/JPY declined below the 145.00 support. Looking at Bitcoin, the bears took control and pushed the price below the $50,000 level.
It has been down over 20% in the past few days and still signaling more downsides. Immediate support is near the $48,500 level. The next key support sits at $46,000.
A downside break below $46,000 might send Bitcoin toward the $45,000 support. Any more losses might send the price toward the $52,500 support zone.
On the upside, the price might struggle to clear the $53,500 resistance. A successful close above $53,500 might start another steady increase. In the stated case, the price may perhaps rise toward the $55,000 level.
Looking at USD/JPY, the pair declined heavily below the 146.50 and 145.00 levels. The next major support sits at 140.00.
Today’s Economic Releases
- US Goods and Services Trade Balance for June 2024 - Forecast $-72.4B, versus $-75.1B previous.
Japan’s nominal wages surge 4.5% yoy in Jun, outpacing inflation for first time in 27 months
Japan's nominal wages, or average monthly cash earnings, rose by 4.5% yoy in June, significantly exceeding expectations of a 2.3% yoy increase. This marks the 30th consecutive month of wage growth. More importantly, with CPI rising 3.3% yoy in the same month, real wages increased by 1.1% yoy, marking the first gain in 27 months as wage growth finally outpaced inflation.
A Ministry of Health, Labor and Welfare official commented, "We will monitor incoming data closely to see if the trend has really changed as there is a possibility that those firms that paid bonuses in July might have just moved up the timing this year."
Excluding bonuses and non-scheduled payments, average wages climbed 2.3% yoy, while overtime and other allowances rose by 1.3% yoy.
Also released, household spending in June fell by -1.4% yoy, worse than the expected -0.9% yoy decline, marking the second consecutive month of decline following a -1.8% drop yoy in May.
Fed’s Daly raises alarm over “real weakness” in slowing labor market
San Francisco Fed President Mary Daly commented in a forum overnight, stating that "we've now confirmed that the labor market is slowing". She emphasized the importance of ensuring that this slowdown does not turn into a downturn.
However, she expressed her concern that "it's too early to tell" whether the labor market is "slowing to a sustainable pace which allows the economy to continue to grow" or if it is approaching a point of "real weakness."
Daly also mentioned that she expects interest rates to eventually come down "to preserve the balance" of full employment and price stability. However, she cautioned that she is not prepared to specify when or by how much, as she plans to review more data before the next Fed policy meeting in September.
The Rise and Fall of Copper – Could You Have Caught the Top With These Forecasting Techniques?
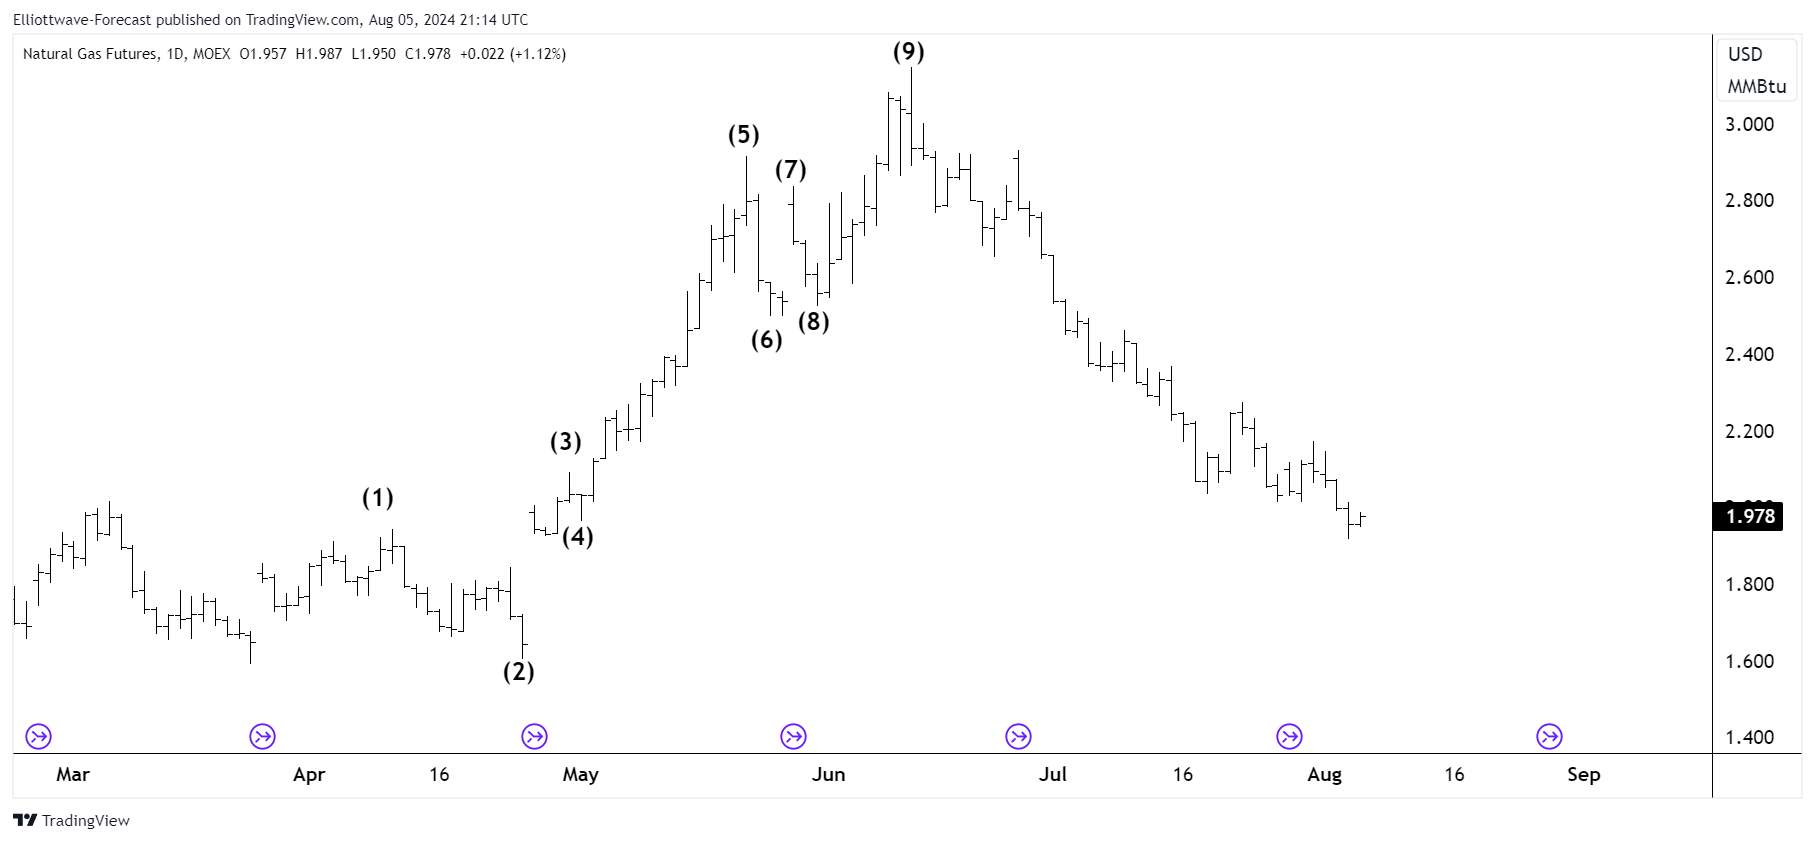
Copper has been a hot commodity, literally. If we look at Copper’s price action history on the daily chart, there is a giant spike from the 3.60 to 5.25 area in just a few months. After that, Copper has crashed back down to just 4.10 today shown here. What forecasting techniques could we have used to predict this rise and fall of copper?
Could any trader have predicted the rise and fall of copper in just 5 short months? Let’s review some signs the top of the market gave us at the peak and trough to help us see how the pattern emerges.
Counting Waves
To start off with the initial breakout in March 2024 made new highs with strength. This is a tell-tale sign of an impulse wave getting underway, new highs out of the previous sideways zone. From the bottom here we can actually count a total of 9-waves up as pictured h
This is a tell-tale sign of an impulse wave, because they always subdivide into 5-9-13 waves, and then keep adding 4 from there. This wave moving up clearly as a 9-wave structure definitely could have aided in catching the top.
Trend Lines
The next thing that helps find the top of copper is this trend line pictured here:
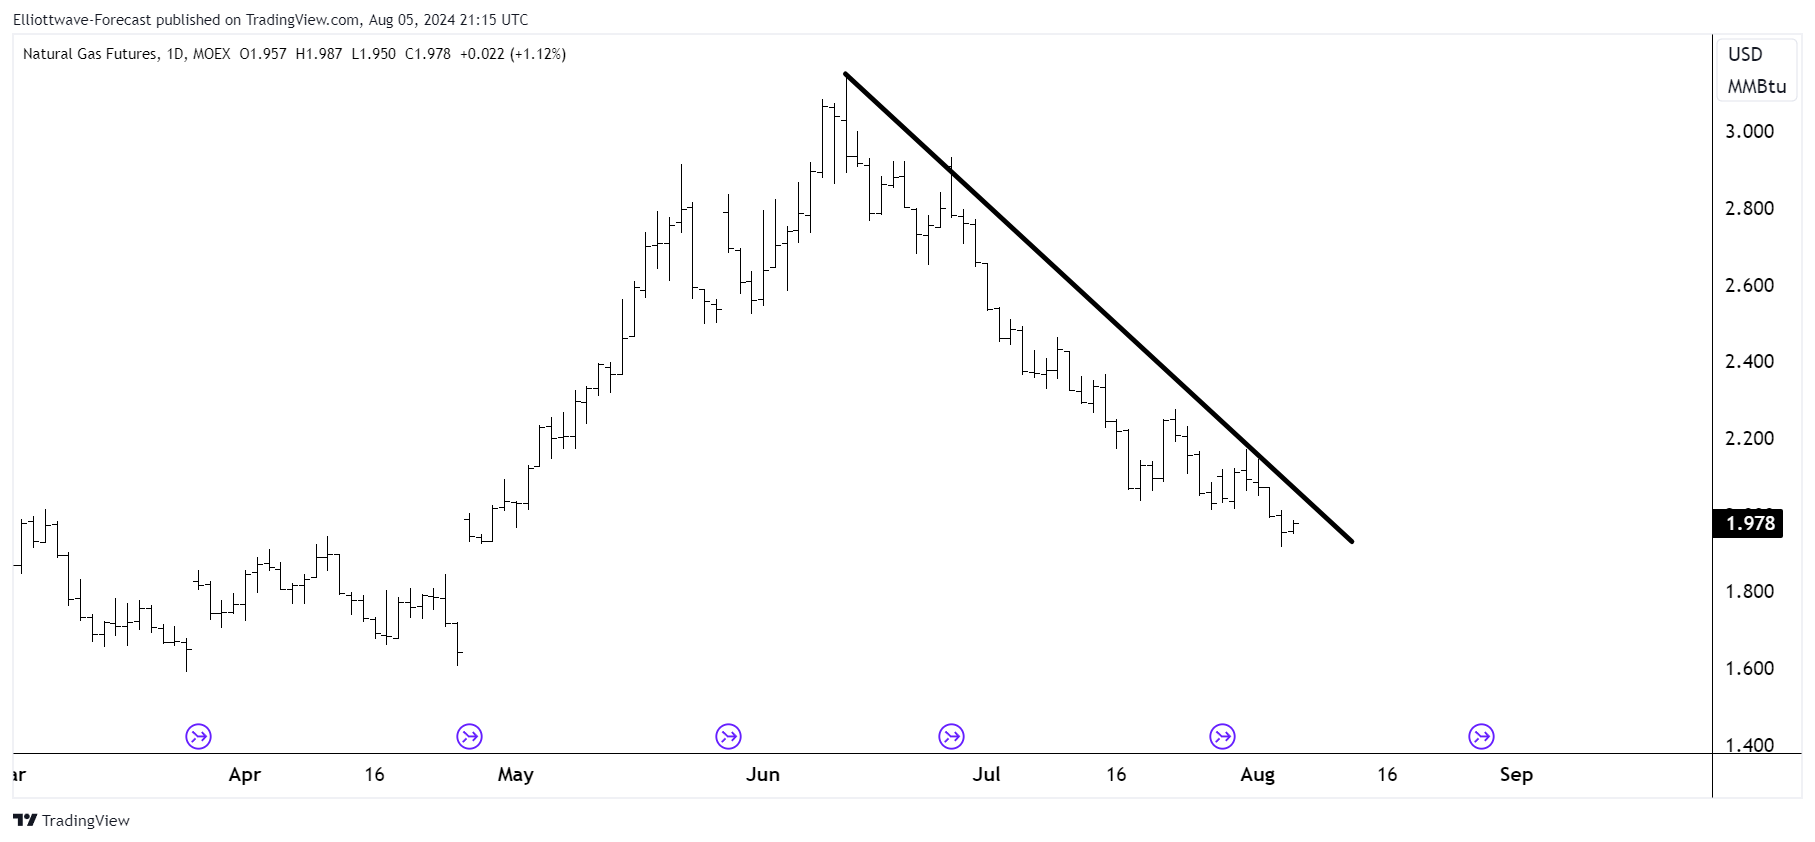
Trend lines when combined with Elliott Wave, and correlations can be very effective. In this situation the best-fitting trend line is drawn from the pivots of 27 March 2024, and 29 May 2024. Price closing below this line helped to identify a downturn in copper. Trend lines are rough estimates though and are best combined with other techniques to identify tops and bottoms.
Utilizing a set of tools to predict markets can drastically improve your cohesion and profits when interacting with it. These 2 tools, trend lines, and wave counting are really good to use in the market. They are also simple to use. Next time you’re wondering when a trend will reverse, try these two tools out and make better informed decisions.
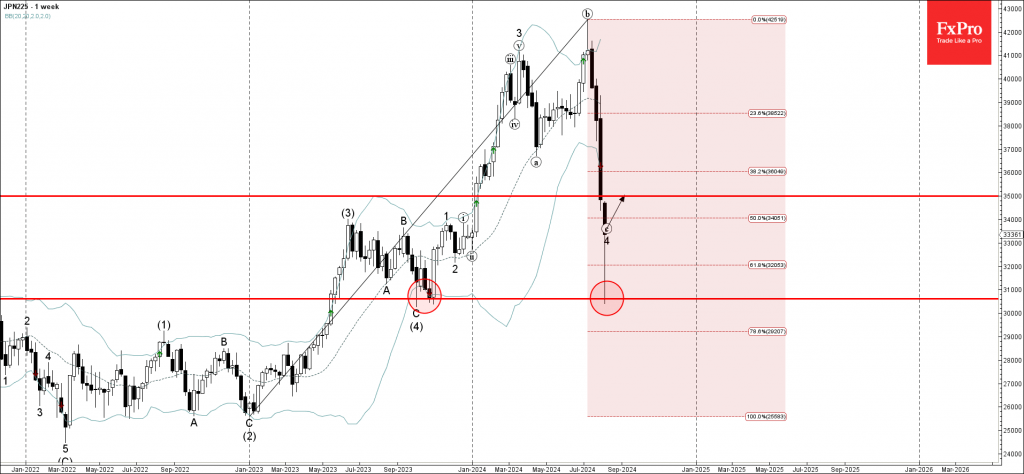
Nikkei 225 Wave Analysis
- Nikkei 225 reversed from support level 30600.00
- Likely to rise to resistance level 35000.00
Nikkei 225 index recently reversed up from the key support level 30600.00, former support from the end of 2023.
The support level 30600.00 was strengthened by the nearby 61,8% Fibonacci correction of the previous weekly uptrend from the start of 2023.
Given the predominant daily uptrend, Nikkei 225 index can be expected to rise further toward the next resistance level 35000.00.
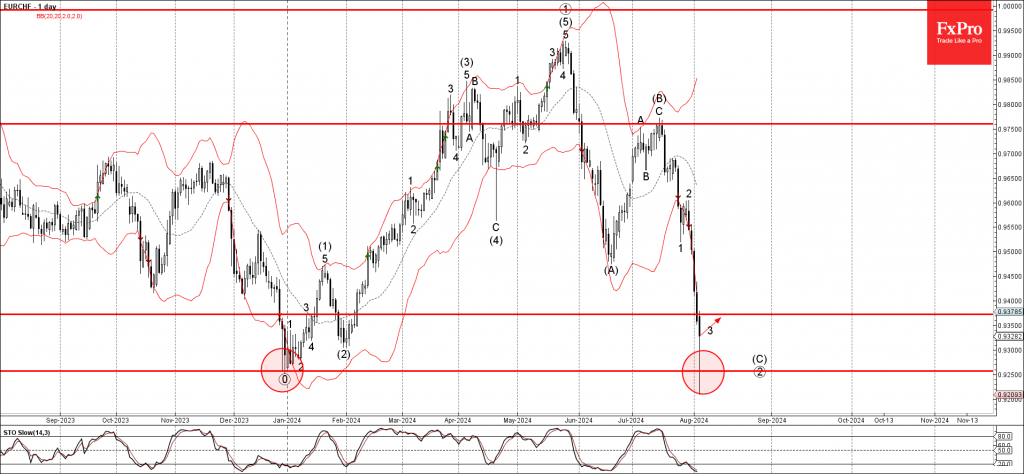
EURCHF Wave Analysis
- EURCHF reversed from support level 0.9255
- Likely to rise to resistance level 0.9370
EURCHF currency pair today reversed up from the powerful support level 0.9255, which stopped the weekly downtrend at the end of 2023.
The support level 0.9255 was strengthened by the lower daily and the weekly Bollinger Bands.
Given the oversold daily Stochastic and the strength of the support level 0.9255, EURCHF currency pair can be expected to rise further toward the next resistance level 0.9370.
An Unlikely Buying Opportunity for US Indices
There is a classic risk aversion in the markets, reminiscent of what we saw some 16 years ago in 2008. The sell-off in U.S. markets does not look extreme yet, although Japanese markets are recording their worst day since Black Monday 1987, and trading has been suspended in Korea, Turkey and Taiwan. The spike in long bond prices fits into a pattern of classic risk flight.
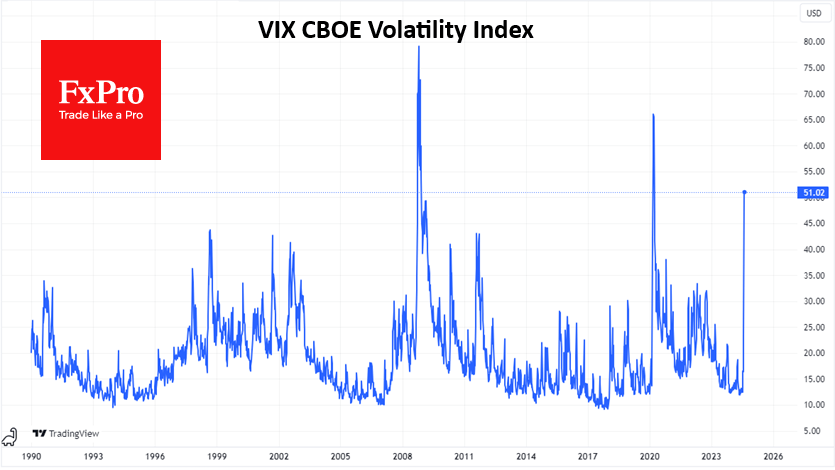
The VIX topped 50 on Monday morning and has only been higher from March to April 2020 in the last 15 years. This is an important indicator that shows markets are genuinely concerned about rising volatility in the near term rather than just regular portfolio rebalancing.
August started with active selling in the US markets.
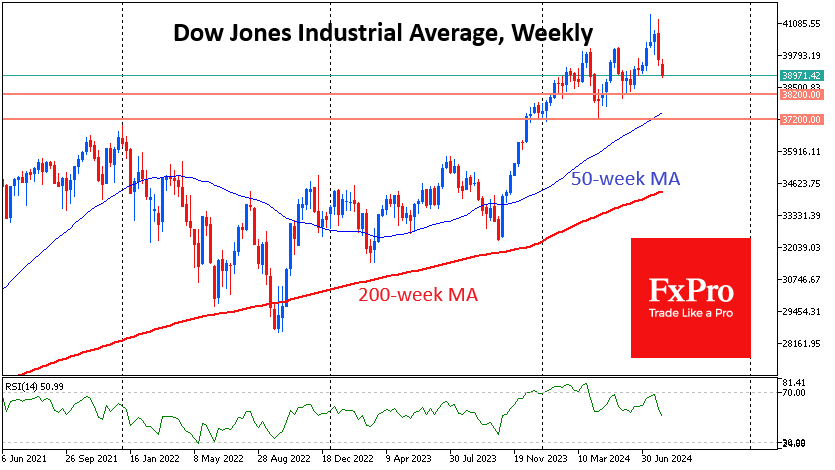
By the middle of the trading session in Europe, the Dow Jones index had pulled back to 39000, losing about 5% from its peak just before the close of trading on 31 July. Since the start of trading this week, the index has been trading below the 50-day moving average, an important medium-term trend line. A consolidation below it would be a prologue to a decline to the 200-day area, which is now near 38150. The behaviour of the index in the 37200-38200 area is extremely important to understand the sentiment as it is a former resistance that became a support in April. There are still doubts about whether it will keep its latest status.
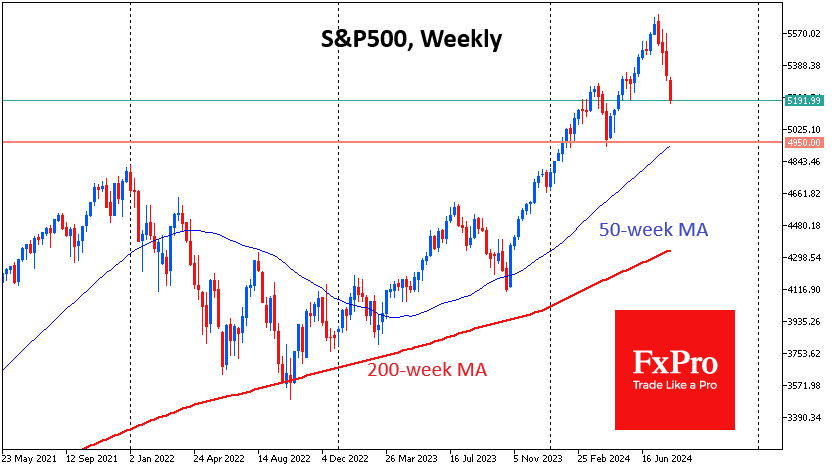
The S&P500 index is one step ahead of the Dow Jones in terms of the market cycle. Since the beginning of August, it has fallen below the support of the upside corridor that has been in place since October 2023. The fight for the 50-day here was lost by the bears as early as 1 August, and the index is already near 5200. This is below the peak area in March, which was supported in May. The next comparable support is not seen before 4950-5050 (April lows and 200-day MA).
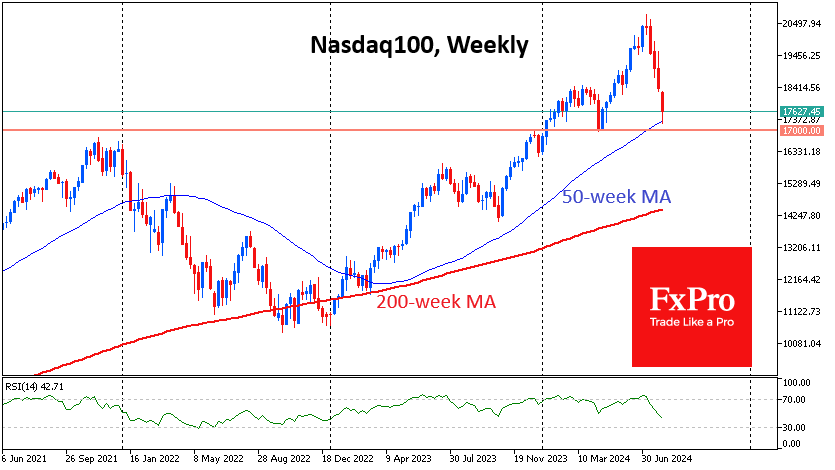
The Nasdaq100 is still one step ahead in this down cycle, having already dipped below 17250 on Monday, below its 200-day MA (now at 17777). The index consolidated above it in January 2023, and since then, it has triggered heavy buying, acting as a turning point in corrections. Monday or Tuesday will decide which pattern will prevail: a bear market like in 2022 or an attractive drawdown for buyers.
Investors should prepare for further dips and not be in a hurry to catch falling knives, given that we are seeing reactions to macroeconomic data, the height of the VIX, and the speed and synchronisation of declines across many markets.
Don’t be confused by the weakening dollar and the relatively robust performance of gold. The sell-off in markets is still at an early stage, not generating waves of deleveraging with forced selling.
A fall of the Nasdaq100 below 17000 will start a bear market with the potential to fall to 14500 (200-week average). In the S&P500, the 200-week is also acting as a historical support line. It is now near 4350 but is targeting the 4500 area by year-end. In the Dow Jones, the 35000 area is a similar benchmark.
Perhaps only a quick dip into this area could force the Fed to make an emergency rate cut. Also, such a pullback would provide the necessary attractiveness to stock valuations. But one must realise that at this point, near the 200-week average, markets become extremely volatile. Marking a point from which to look out for buys does not automatically make them. It makes sense to join purchases only after decisive steps of the Central Bank and the government. Expectations of such a step early on Monday morning look like market inefficiency rather than the real hopes of traders.