Sample Category Title
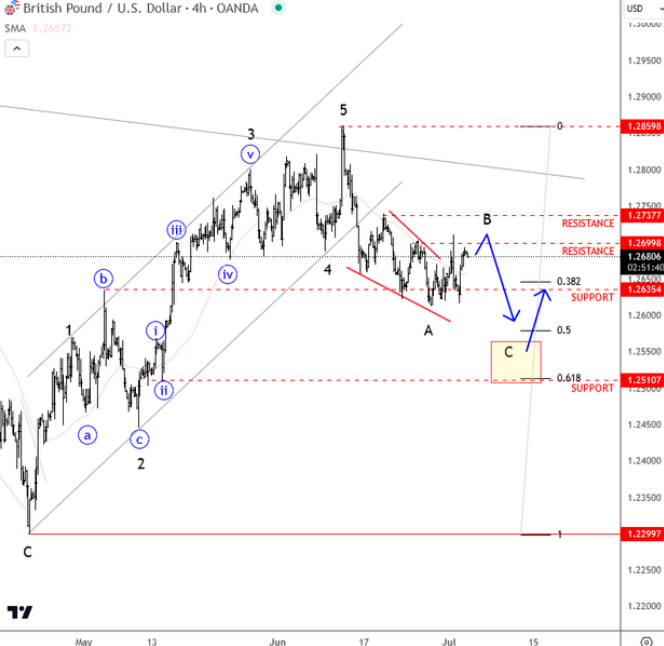
Cable Ready to Correct Deeper Going into UK Elections
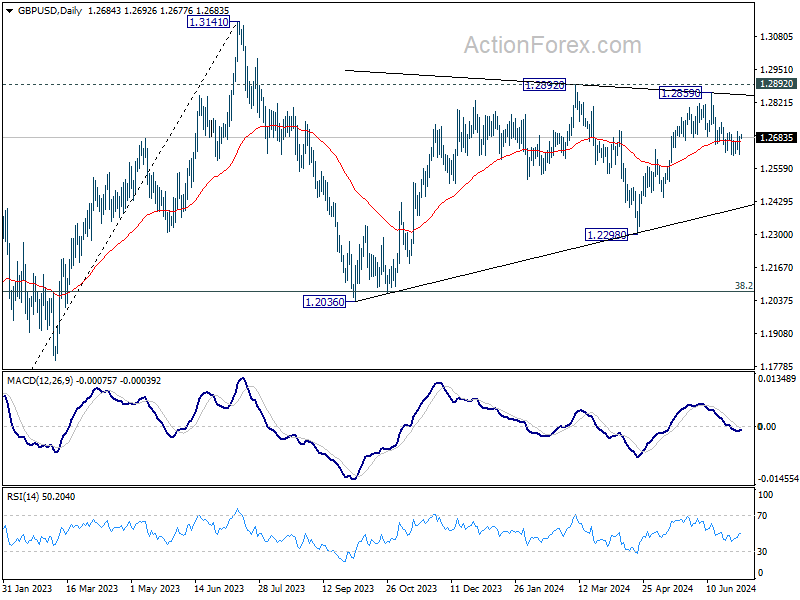
Cable is turning south for the last few weeks, as price stopped at the trendline connected from 2023 high so we certainly should not be surprised by current retracement. Break below the channel support also confirms a corrective phase for the pound, against the previous five wave rise, especially after latest UK CPI figures and BOE decisions that left interest rates unchanged, but there was a couple of dovish hints. So, cable came lower and now even makes a leading diagonal in wave A of a three wave correction, so correction is still unfolding against the previous impulse. If we are correct, then the pair will go lower and deeper after wave B rally, going into UK elections. Big support is at 1.2500/50.
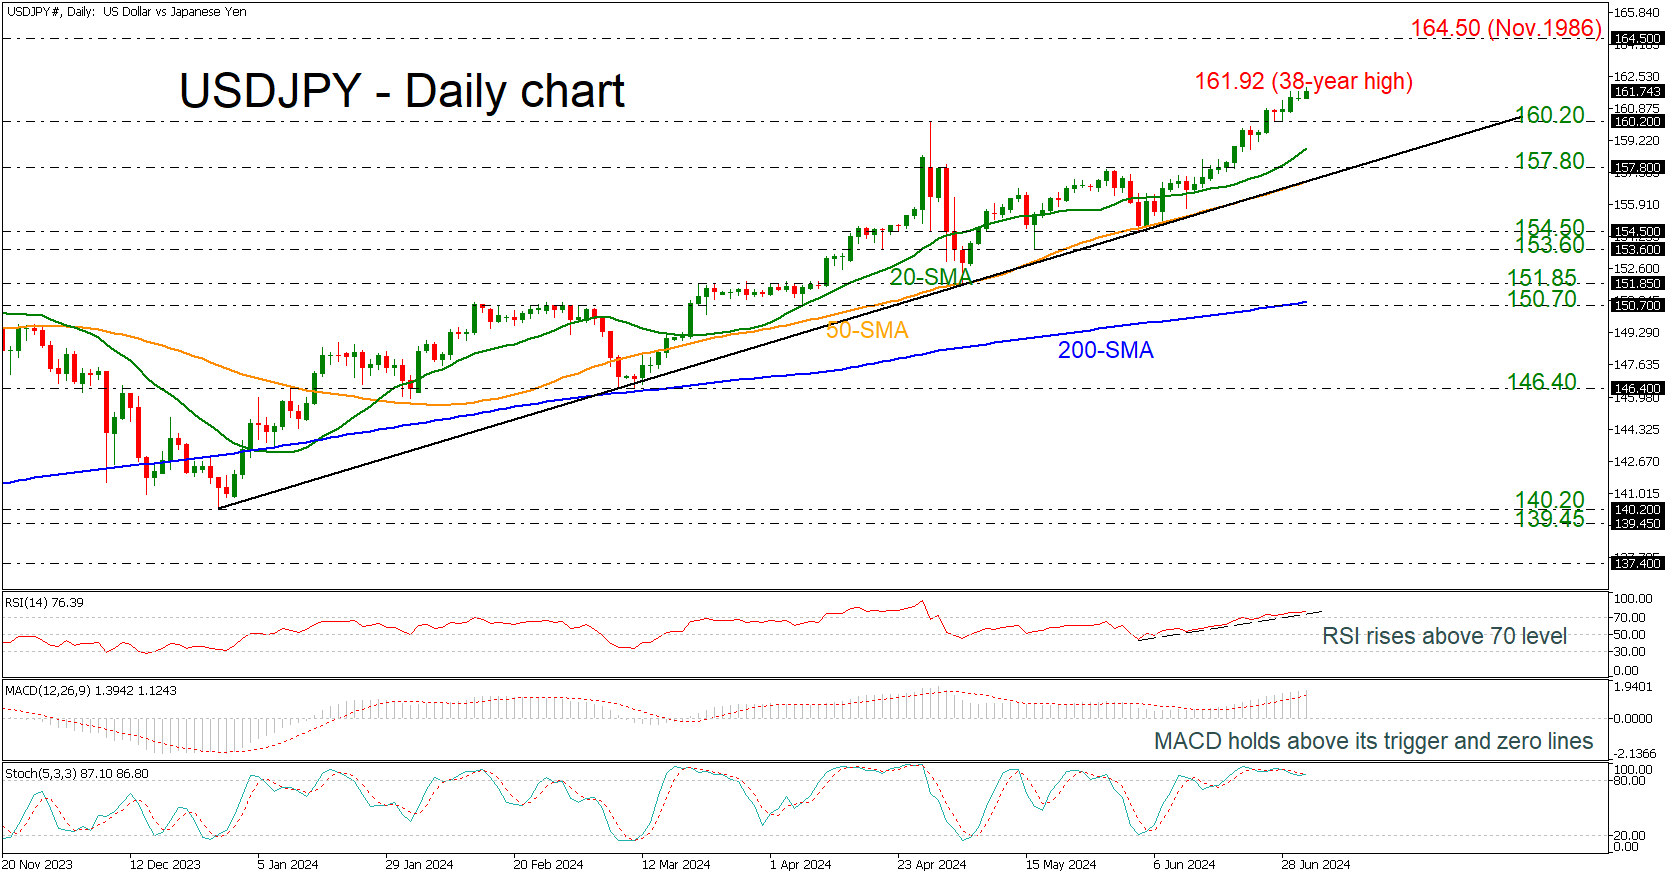
USDJPY Flies to Another Higher High at 161.92
- USDJPY continues its ascending move
- Technical oscillators still ticking up
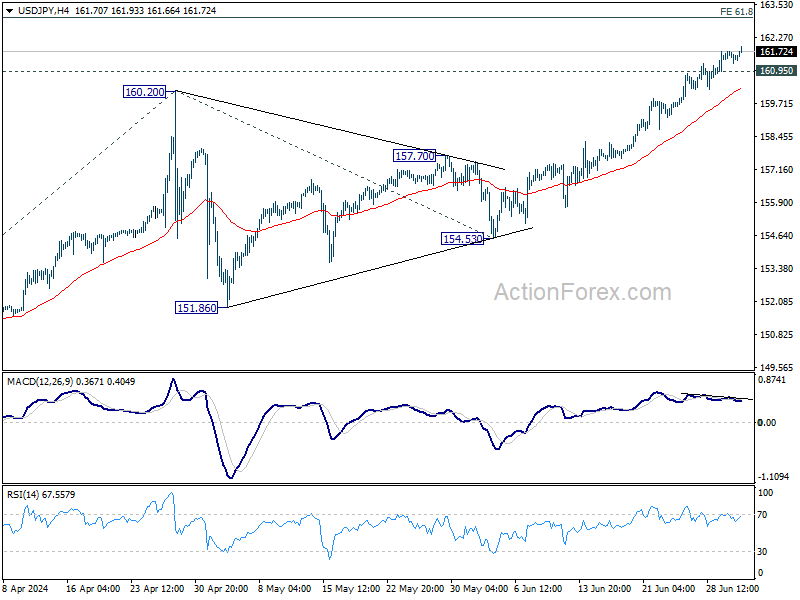
USDJPY is creating higher highs, unlocking a fresh 38-year high of 161.92 earlier in the day. The rebound off 154.50 is still in progress, while the technical oscillators are still heading north.
The RSI is developing above its uptrend line in the overbought territory, the MACD is rising above its trigger and zero lines, and the stochastic posted a bullish crossover within its %K and %D lines above the 80 level.
More upside pressures may take the market towards the immediate 162.00 round number before challenging the next psychological mark of 163.00. Also, the peak of 164.50, taken from the highs in November 1986, may act as a turning point for traders.
In the negative scenario, a downfall could drive the bears to the 160.20 support before hitting the 20-day simple moving average (SMA) at 158.75. Moving lower, the long-term ascending trend line and the 157.80 bar may pause downside movements.
In a nutshell, USDJPY has been on an acceleration since the end of 2023, with no notable bearish actions.
EUR/USD Daily Outlook
Daily Pivots: (S1) 1.0721; (P) 1.0735; (R1) 1.0760; More....
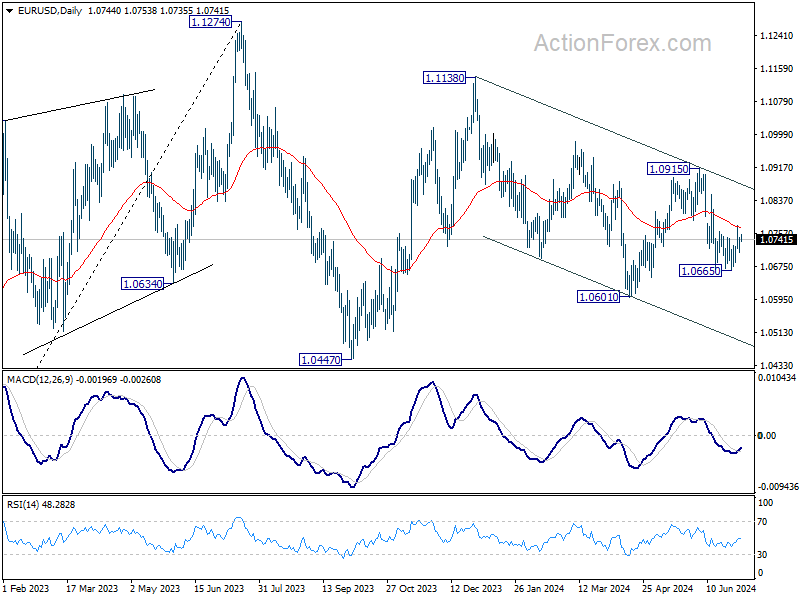
Intraday bias in EUR/USD remains neutral for the moment. On the upside, firm break of 55 D EMA (now at 1.0772) will argue that pull back from 1.0915 has completed. Further rise should be seen back to 1.0915 resistance. However, break of 1.0665 will resume larger down trend through 1.0601 low instead.
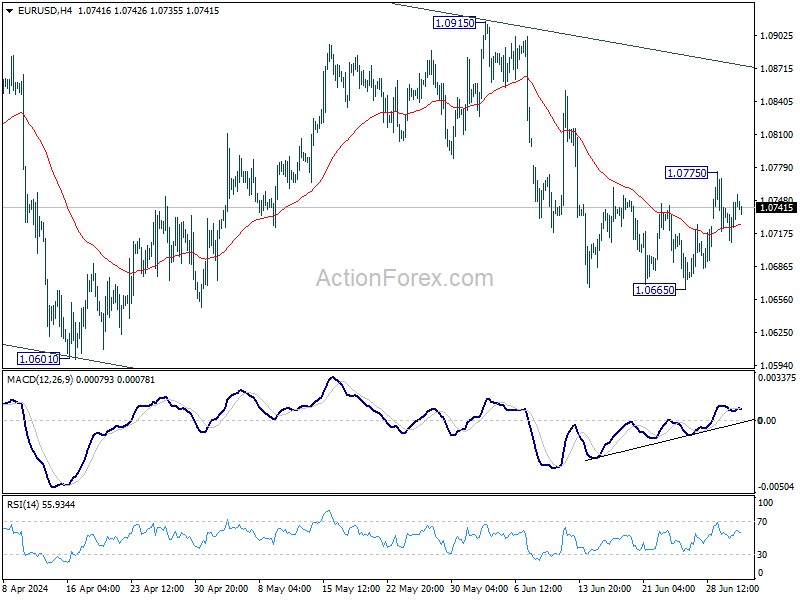
In the bigger picture, price actions from 1.1274 are viewed as a corrective pattern that's still in progress. Break of 1.0601 will target 1.0447 support and possibly below . For now, this will remain the favored case as long as 1.0915 resistance holds, in case of rebound.
USD/JPY Daily Outlook
Daily Pivots: (S1) 161.22; (P) 161.52; (R1) 161.76; More...
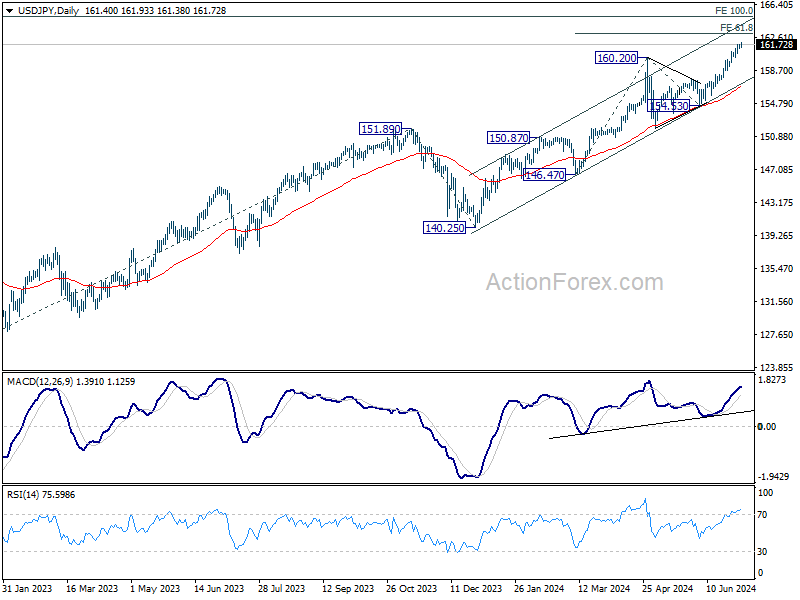
USD/JPY's rally continues today despite some loss of upside momentum. Intraday bias stays on the upside at this point. Current up trend should target 61.8% projection of 146.47 to 160.20 from 154.53 at 163.01. On the downside, below 160.95 minor support will turn intraday bias neutral and bring consolidations again, before staging another rally.
In the bigger picture, long term up trend is still in progress. Further rise is expected as long as 154.53 support holds. Next target is 100% projection of 127.20 (2023 low) to 151.89 (2023 high) from 140.25 at 164.94.
GBP/USD Daily Outlook
Daily Pivots: (S1) 1.2638; (P) 1.2663; (R1) 1.2710; More...
Intraday bias in GBP/USD stays neutral for the moment as range trading continues. On the upside, firm break of 1.2705 resistance will argue that pull back from 1.2859 has completed, and bring retest of this high instead. Nevertheless, sustained trading below 1.2633 resistance turned support will argue that whole rise from 1.2298 has completed, and target 1.2445 and below.
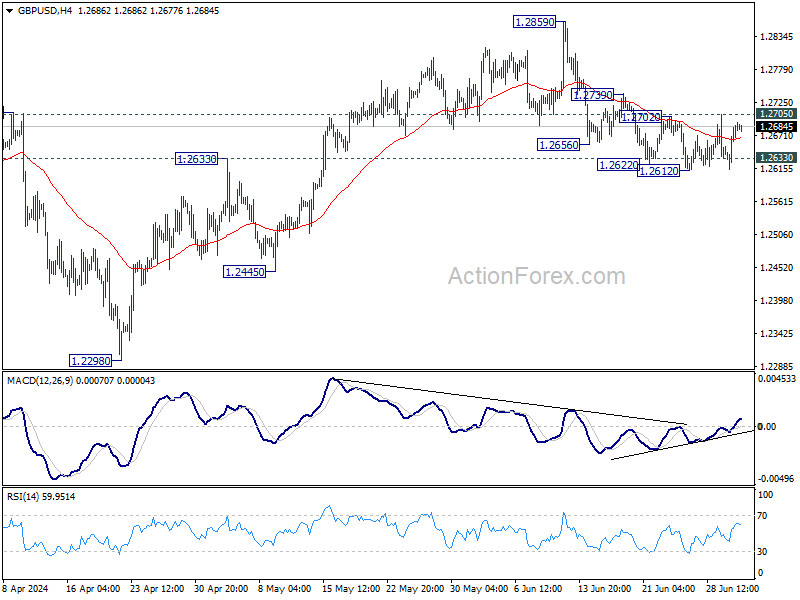
In the bigger picture, price actions from 1.3141 medium term top are seen as a corrective pattern that is still in progress. Break of 1.2445 support will confirm that another falling leg has started and target 1.2036 cluster support again (38.2% retracement of 1.0351 (2022 low) to 1.3141 at 1.2075. Nevertheless, break of 1.2892 resistance will argue that larger up trend from 1.0351is ready to resume through 1.3141.
USD/CHF Daily Outlook
Daily Pivots: (S1) 0.9026; (P) 0.9038; (R1) 0.9052; More…
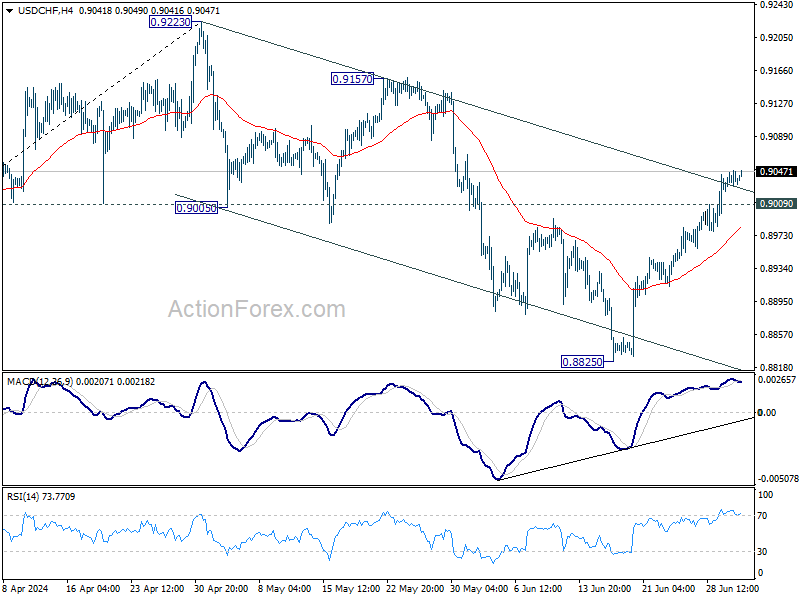
Intraday bias in USD/CHF remains on the upside as rise from 0.8825 is in progress. Fall from 0.9223 might have completed as a three-wave corrective move to 0.8825. Sustained trading above the near term falling channel resistance will bring further rally to 0.9157 resistance next. On the downside, below 0.9009 minor support will turn intraday bias neutral gain first.
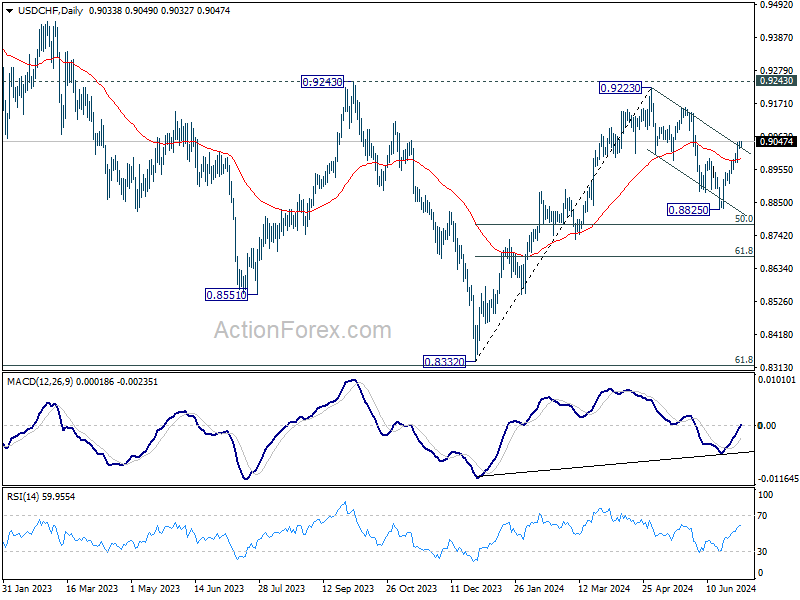
In the bigger picture, focus remains is now on 0.9223/9243 resistance zone. Decisive break there would complete a head and shoulder bottom pattern (ls: 0.8551; h: 0.8332; rs: 0.8825). That would indicate larger bullish trend reversal. Nevertheless, rejection by 0.9223/43 will keep medium term outlook neutral at best, for more range trading between 0.8332/9243 first.
AUD/USD Daily Report
Daily Pivots: (S1) 0.6644; (P) 0.6657; (R1) 0.6681; More...
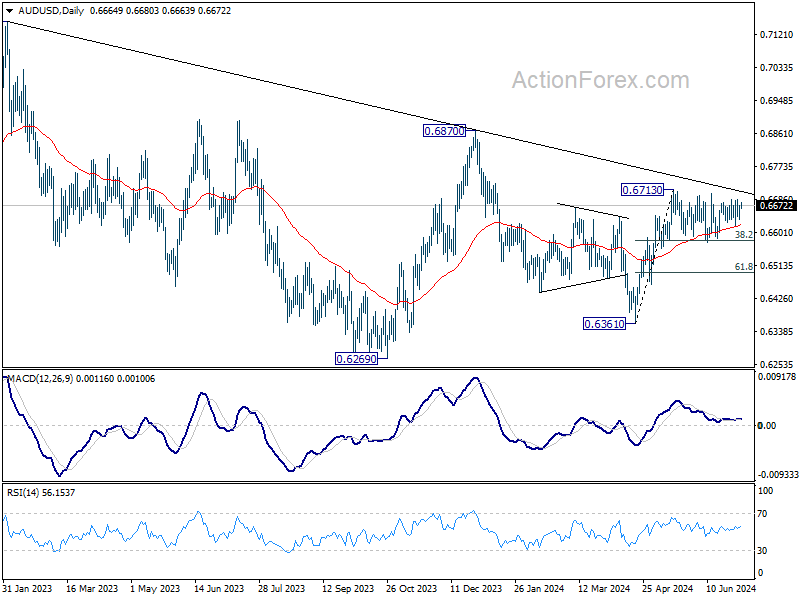
Intraday bias in AUD/USD remains neutral as sideway consolidation from 0.6713 is still extending. Further rally is in favor with 0.6578 cluster support (38.2% retracement of 0.6361 to 0.6713 at 0.6579) intact. On the upside, firm break of 0.6713 will resume whole rise from 0.6361 to 0.6870 resistance next. However, sustained break of 0.6578 will dampen this bullish view, and bring deeper fall to 61.8% retracement at 0.6495.
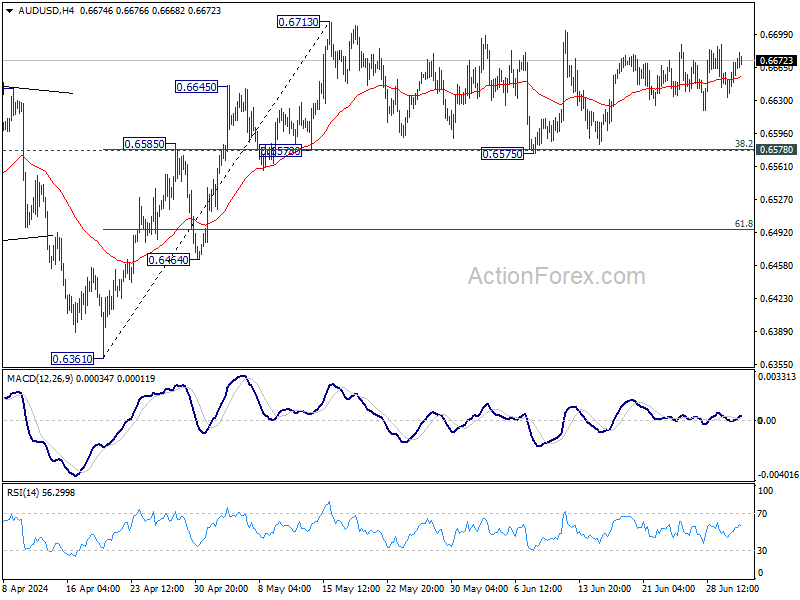
In the bigger picture, price actions from 0.6169 (2022 low) are seen as a medium term corrective pattern to the down trend from 0.8006 (2021 high). Fall from 0.7156 (2023 high) is seen as the second leg, which could have completed at 0.6269 already. Rise from there is seen as the third leg which is now trying to resume through 0.6870 resistance.
USD/CAD Daily Outlook
Daily Pivots: (S1) 1.3646; (P) 1.3701; (R1) 1.3735; More...
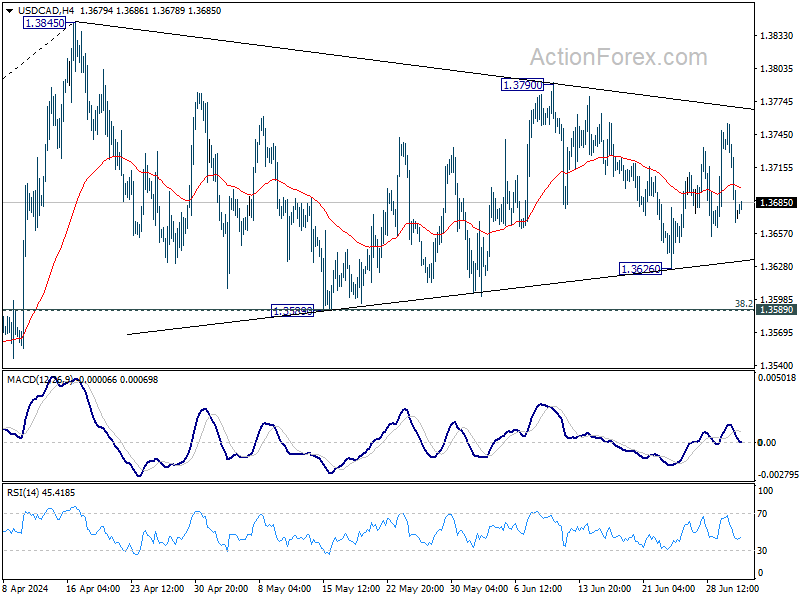
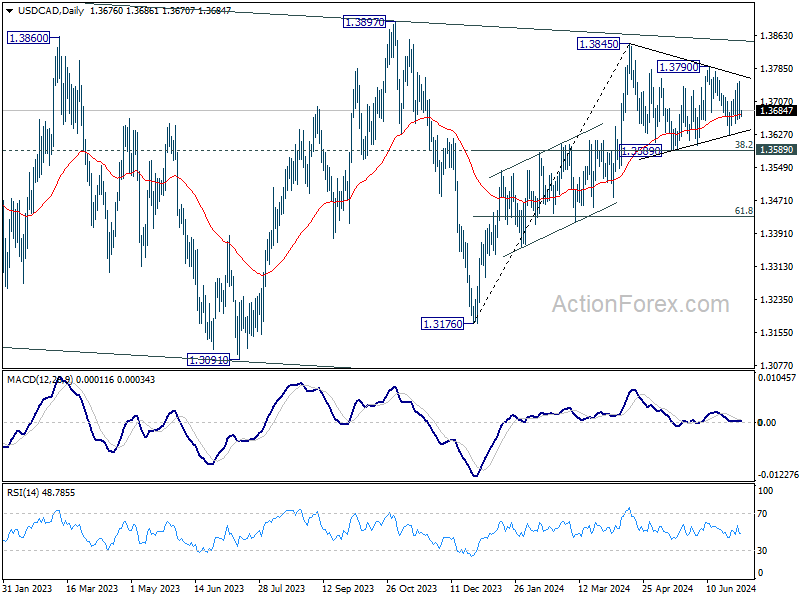
Range trading continues in USD/CAD and intraday bias remains neutral. Consolidation from 1.3845 could extend further. While another fall could be seen, downside should be contained by 1.3589 cluster support (38.2% retracement of 1.3176 to 1.3845 at 1.3589) to bring rebound. Break of 1.3790 resistance will argue that larger rise is ready to resume and target 1.3845 resistance.
In the bigger picture, price actions from 1.3976 (2022 high) are viewed as a corrective pattern. In case of another fall, strong support should emerge above 1.2947 resistance turned support to bring rebound. Firm break of 1.3976 will confirm up resumption of whole up trend from 1.2005 (2021 low). Next target is 61.8% projection of 1.2401 to 1.3976 from 1.3176 at 1.4149.
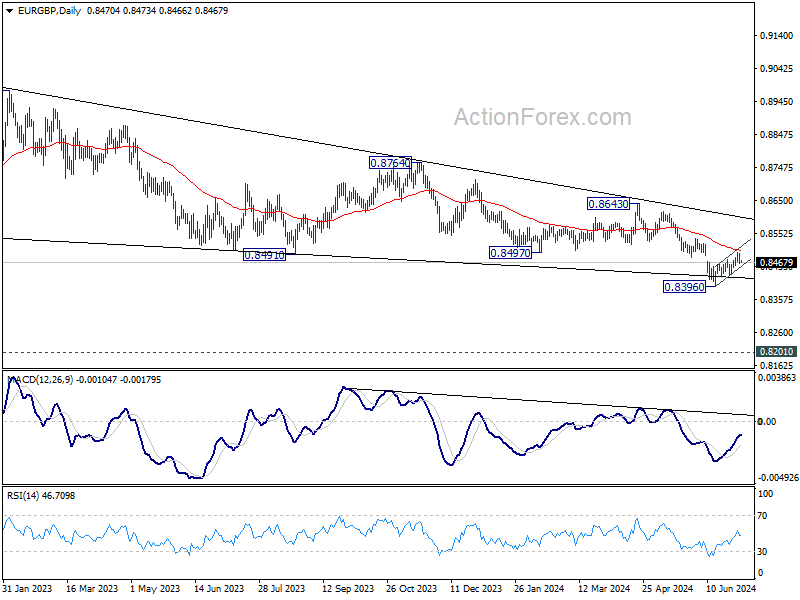
EUR/GBP Daily Outlook
Daily Pivots: (S1) 0.8459; (P) 0.8478; (R1) 0.8489; More...
Intraday bias in EUR/GBP is turned neutral again with current retreat. On the upside, sustained trading above 55 D EMA (now at 0.8501) will extend the rise from 0.8396 short term bottom to 0.8529 support turned resistance. Nevertheless, On the downside, break of 0.8493 support will suggest that the corrective recovery has completed. Intraday bias will be back on the downside for retesting of 0.8396 low. Firm break there will resume larger down trend.
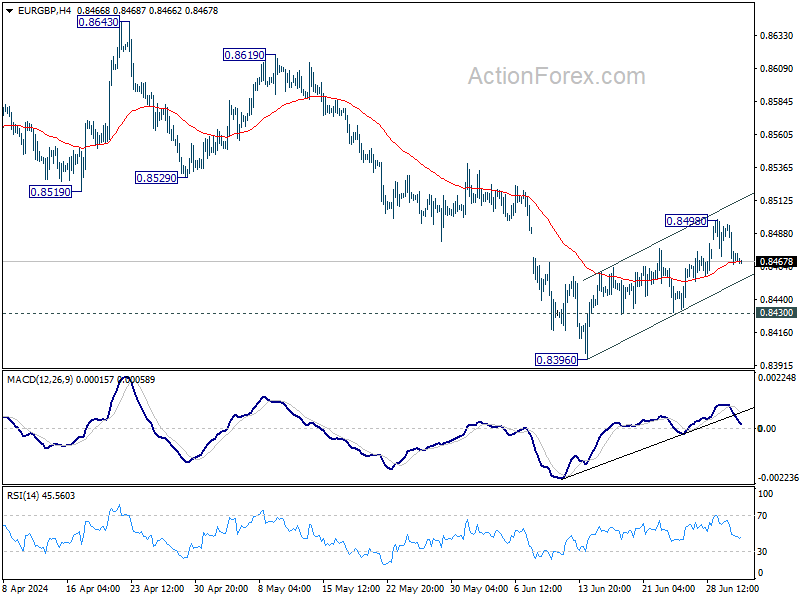
In the bigger picture, down trend from 0.9267 (2022 high) is in progress. Break of 0.8396 will target 0.8201 (2022 low). For now, outlook will remain bearish as long as 0.8643 resistance holds, even in case of stronger rebound.
EUR/AUD Daily Outlook
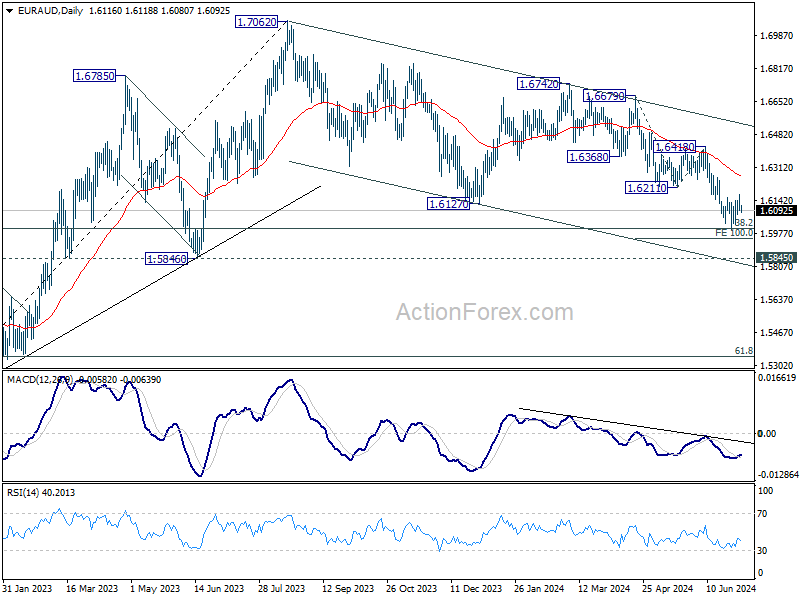
Daily Pivots: (S1) 1.6083; (P) 1.6131; (R1) 1.6166; More...
EUR/AUD is still extending the consolidation from 1.5996 and intraday bias remains neutral. With 1.6211 support turned resistance intact, outlook remains bearish. On the downside, break of 1.5996 will target 100% projection of 1.6679 to 1.6211 from 1.6418 at 1.5950. Firm break there will target 1.5846 key support next.
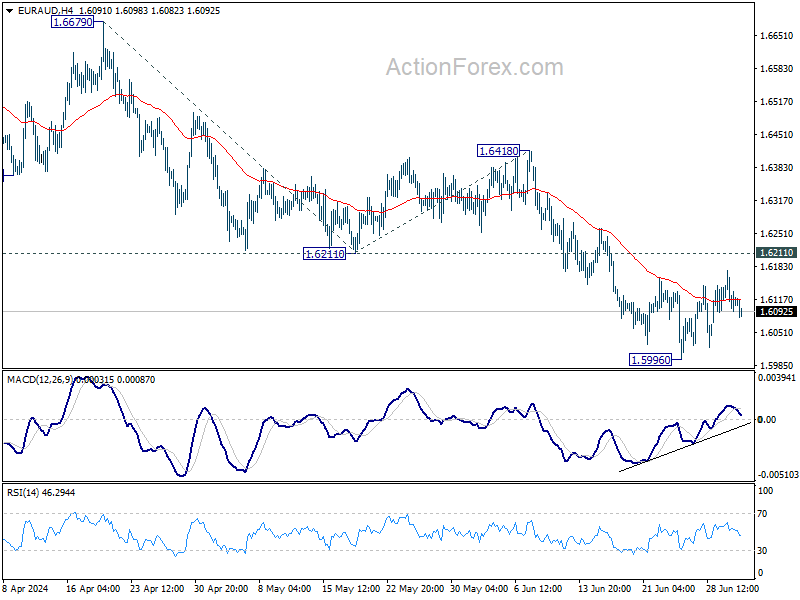
In the bigger picture, fall from 1.7062 medium term top is seen as a correction to the up trend from 1.4281 (2022 low) only. Strong support is still expected between 1.5846 and 38.2% retracement of 1.4281 to 1.7062 at 1.6000 to bring rebound. Break of 1.6148 resistance will argue that the correction has completed.