Sample Category Title
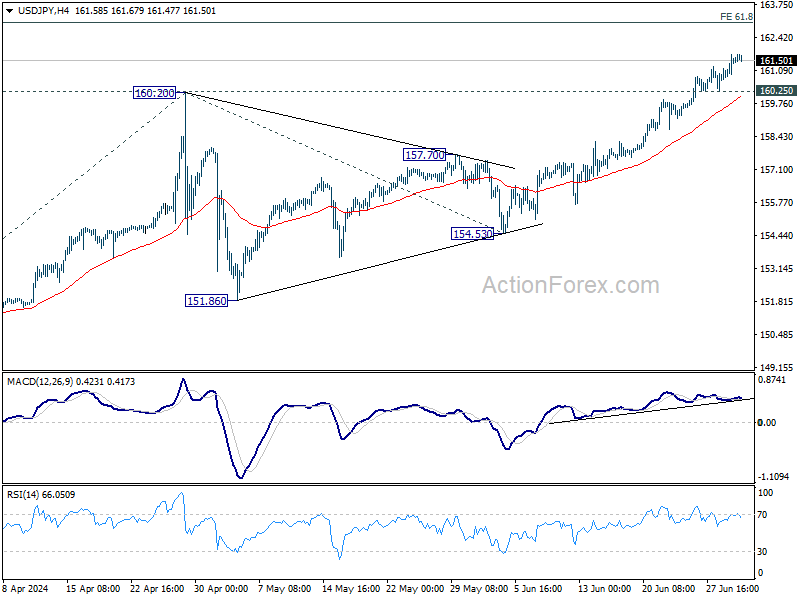
USD/JPY Mid-Day Outlook
Daily Pivots: (S1) 160.90; (P) 161.31; (R1) 161.89; More...
No change in USD/JPY's outlook and intraday bias stays on the upside. Current up trend should target 61.8% projection of 146.47 to 160.20 from 154.53 at 163.01. On the downside, below 160.25 minor support will turn intraday bias neutral and bring consolidations again, before staging another rally.
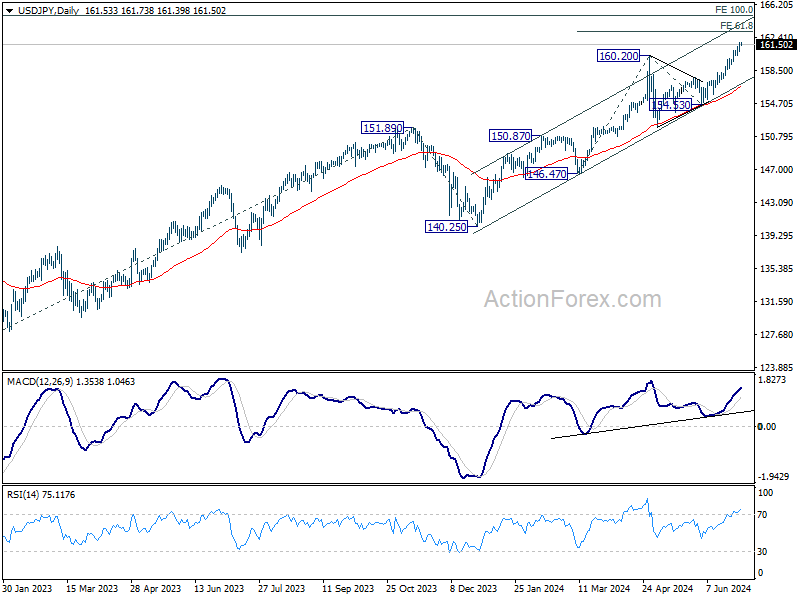
In the bigger picture, long term up trend is still in progress. Further rise is expected as long as 154.53 support holds. Next target is 100% projection of 127.20 (2023 low) to 151.89 (2023 high) from 140.25 at 164.94.
USD/CHF Mid-Day Outlook
Daily Pivots: (S1) 0.8986; (P) 0.9016; (R1) 0.9057; More…
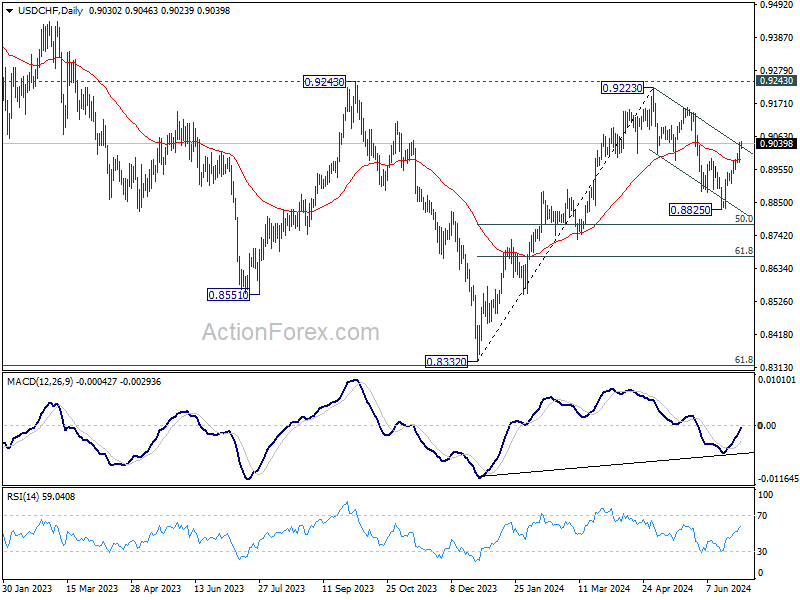
No change in USD/CHF's outlook and intraday bias remains on the upside. Fall from 0.9223 might have completed as a three-wave corrective move to 0.8825. Sustained trading above the near term falling channel resistance will bring further rally to 0.9157 resistance next. On the downside, below 0.8977 minor support will turn intraday bias neutral gain first.
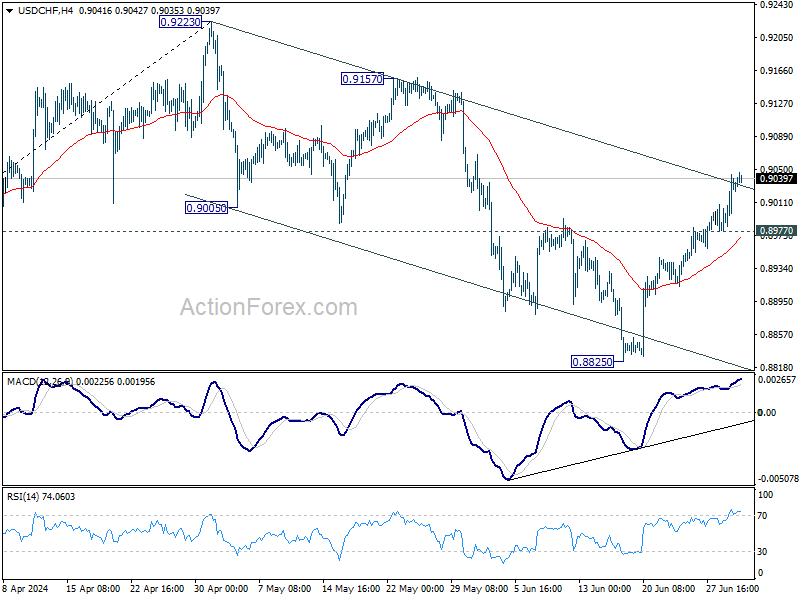
In the bigger picture, focus remains is now on 0.9223/9243 resistance zone. Decisive break there would complete a head and shoulder bottom pattern (ls: 0.8551; h: 0.8332; rs: 0.8825). That would indicate larger bullish trend reversal. Nevertheless, rejection by 0.9223/43 will keep medium term outlook neutral at best, for more range trading between 0.8332/9243 first.
EUR/USD Mid-Day Outlook
Daily Pivots: (S1) 1.0715; (P) 1.0745; (R1) 1.0771; More....
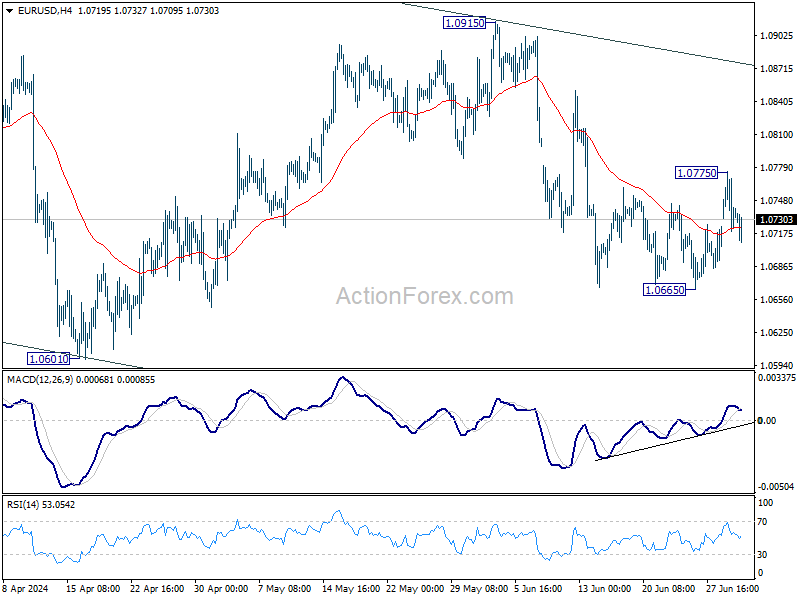
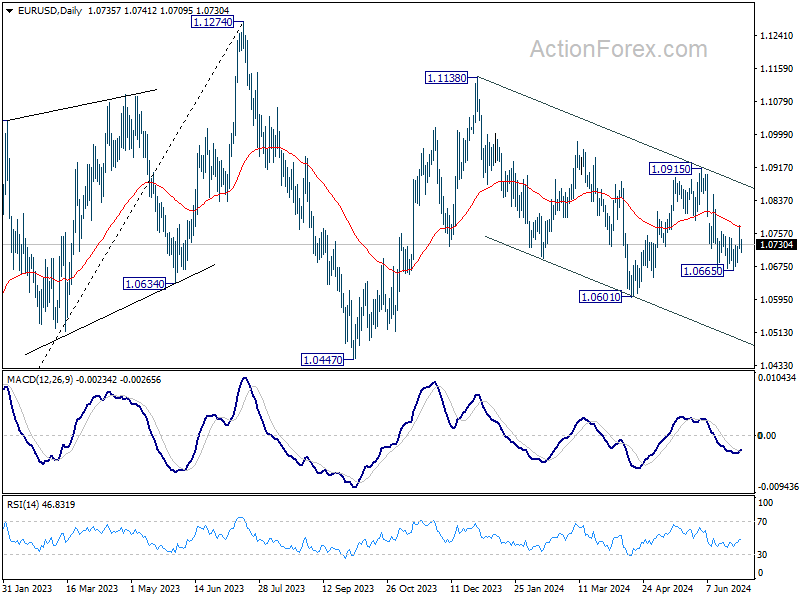
Outlook in EUR/USD is unchanged and intraday bias stays neutral. On the upside, firm break of 55 D EMA will argue that pull back from 1.0915 has completed. Further rise should be seen back to 1.0915 resistance. However, break of 1.0665 will resume larger down trend through 1.0601 low instead.
In the bigger picture, price actions from 1.1274 are viewed as a corrective pattern that's still in progress. Break of 1.0601 will target 1.0447 support and possibly below . For now, this will remain the favored case as long as 1.0915 resistance holds, in case of rebound.
GBP/USD Mid-Day Outlook
Daily Pivots: (S1) 1.2622; (P) 1.2661; (R1) 1.2690; More...
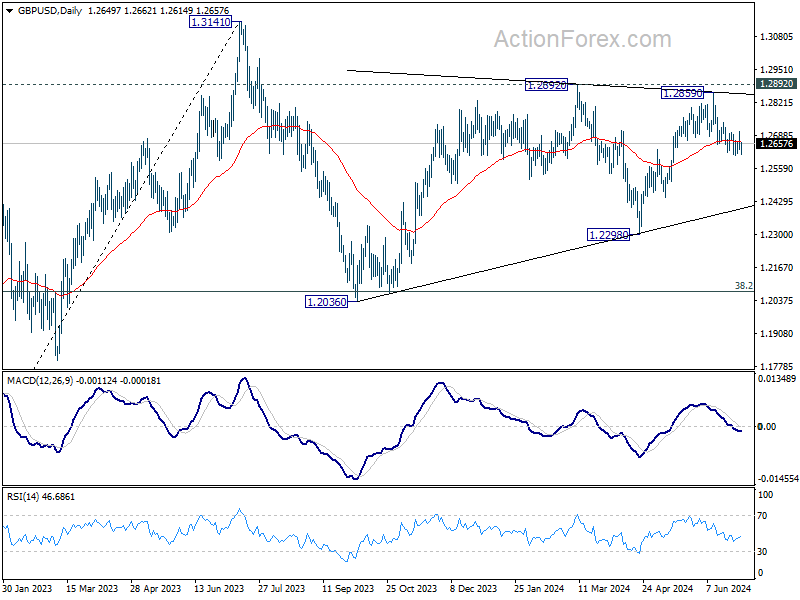
GBP/USD recovered ahead of 1.2612 support as range trading continues. Intraday bias remains neutral at this point. On the upside, firm break of 1.2705 resistance will argue that pull back from 1.2859 has completed, and bring retest of this high instead. Nevertheless, sustained trading below 1.2633 resistance turned support will argue that whole rise from 1.2298 has completed, and target 1.2445 and below.
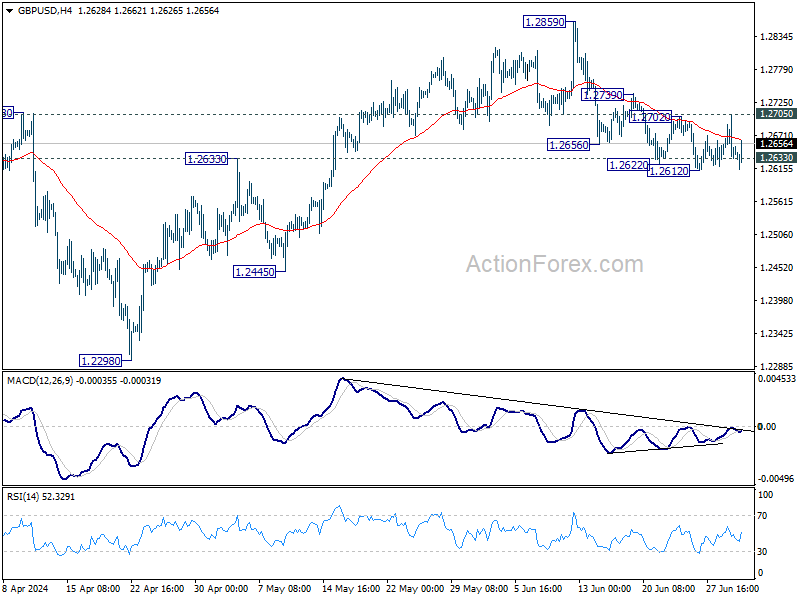
In the bigger picture, price actions from 1.3141 medium term top are seen as a corrective pattern that is still in progress. Break of 1.2445 support will confirm that another falling leg has started and target 1.2036 cluster support again (38.2% retracement of 1.0351 (2022 low) to 1.3141 at 1.2075. Nevertheless, break of 1.2892 resistance will argue that larger up trend from 1.0351is ready to resume through 1.3141.
Dollar Struggles to Keep Momentum in Indecisive Markets
In the forex market, clear weakness of Yen, Swiss Franc, and Kiwi contrasts with a broader sense of indecision elsewhere. Dollar's rally attempt quickly lost momentum as it struggled to break through near-term resistance levels against both the Euro and Sterling. Additionally, the greenback remains stuck within familiar ranges against the Aussie and Loonie, a trend that has persisted since early Q2. Market participants are now eyeing Fed Chair Jerome Powell's speech at the ECB forum today, though it is unlikely to offer any significant new insights. Traders are more focused on tomorrow's ISM Services PMI and Friday's Non-Farm Payroll report before making substantial moves.
At this point in the week, Euro is the best performer, although it lacks follow-through momentum due to political uncertainties in France. Sterling is the second strongest currency, followed by Dollar. On the other hand, Swiss Franc remains the worst performer, followed by Kiwi and Yen. The Aussie and the Loonie are positioned in the middle of the performance spectrum.
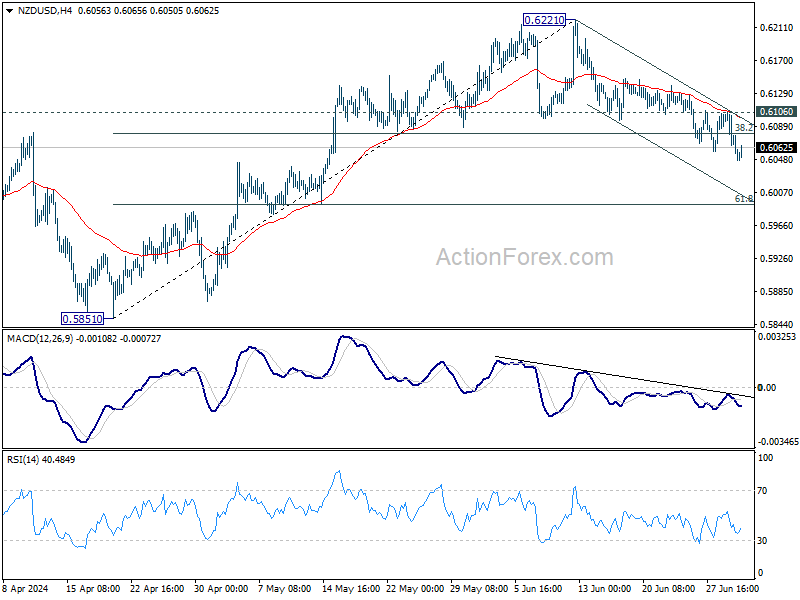
Technically, NZD/USD's fall from 0.6221 resumed today and further decline is expected as long as 0.6106 resistance holds. Even as a corrective move, current decline would now target 61.8% retracement of 0.5851 to 0.6221 at 0.5992. However, firm break of 0.6106 will argue that the pullback has completed and bring retest of 0.6221 high instead.
In Europe, at the time of writing, FTSE is down -0.44%. DAX is down -1.14%. CAC is down -0.84%. UK 10-year yield is down -0.0409 at 4.246. Germany 10-year yield is down -0.007 at 2.601. Earlier in Asia, Nikkei rose 1.12%. Hong Kong HSI rose 0.29%. China Shanghai SSE rose 0.08%. Singapore Strait Times rose 0.88%. Japan 10-year JGB yield rose 0.0276 to 1.092.
Fed's Goolsbee suggests rate cuts if inflation declines further
Chicago Fed President Austan Goolsbee has suggested that Fed should consider cutting interest rates if inflation continues its downward trajectory towards the 2% target. He emphasized the importance of adjusting monetary policy to align with changing inflation dynamics.
Goolsbee explained that holding the current rate as inflation decreases effectively tightens monetary conditions. He noted, "If you sit with the rate somewhere while inflation goes down, you're tightening. The reason that you would want to tighten is if you think that you're not on a path to 2%."
Furthermore, Goolsbee pointed out the importance of balancing inflation control with overall economic stability. He noted, "If employment starts falling apart or if the economy begins to weaken, which you've seen some warning signs, you've got to balance that off with how much progress you're making on the price front." While acknowledging that the unemployment rate remains relatively low, he also highlighted its recent upward trend, indicating potential economic softening.
Eurozone CPI slowed to 2.5% in Jun, but core unchanged at 2.9%
Eurozone CPI slowed from 2.6% yoy to 2.5% yoy in June, matched expectations. CPI core (ex-energy, food, alcohol & tobacco) was unchanged at 2.9% yoy, above expectation of 2.8% yoy.
Looking at the main components, services is expected to have the highest annual rate in June (4.1%, stable compared with May), followed by food, alcohol & tobacco (2.5%, compared with 2.6% in May), non-energy industrial goods (0.7%, stable compared with May) and energy (0.2%, compared with 0.3% in May).
ECB's Lane highlights need for more data on services inflation
ECB Chief Economist Philip Lane emphasized today that June inflation data alone will not suffice to address questions surrounding services inflation, suggesting the ECB may delay further interest rate cuts until additional data is available.
Lane noted, "The key is really services inflation. What we've seen in the last days is that services inflation remains the outlier, and what we need to see is whether higher services inflation is a backward element and is a legacy of the rapid disinflation or is it a persistent element. We need time to work on it."
On the political front, Lane downplayed concerns about France's recent political turmoil impacting markets significantly, stating, "It is clearly natural in an election for the market to reprice. There are elections all the time, there are movements in spreads all the time. Of course, France is an important country, but this looks like an ordinary repricing to me."
Other ECB Governing Council members also shared their perspectives at the ECB forum. Lithuania's Gediminas Simkus aligned with expectations for further rate cuts, stating, "Expectations for two more cuts this year are in line with my own thinking, if data evolve as expected." Similarly, Belgium's Pierre Wunsch remarked, "The first two rate cuts are relatively easy as long as inflation hovers around 2.5% because we will still clearly be restrictive."
RBA minutes: The narrow path is becoming narrower
Minutes of RBA's June meeting emphasize the need to remain "vigilant to upside risks to inflation". The RBA noted that the information received since the previous meeting reinforced this need, underscoring the "extent of uncertainty" in the current economic environment, which makes it "difficult either to rule in or rule out" future changes in interest rates.
Concerns were raised about the "narrow path" to bringing inflation back to target within a reasonable timeframe without significantly deviating from full employment. This path, according to the minutes, is "becoming narrower."
The decision to keep the cash rate target unchanged at 4.35% was deemed the stronger option compared to another rate hike. Data received since May meeting "had not been sufficient" to alter RBA's assessment that inflation would return to target by 2026, despite "some elevated upside risk" surrounding the forecast. Moreover, the minutes revealed that the members felt there was "not enough evidence" to suggest that the outlook for aggregate demand had strengthened.
NZIER survey shows rising pessimism among New Zealand firms
The NZIER Quarterly Survey of Business Opinion for Q2 reveals increasing pessimism among New Zealand firms. A net 44% of firms are now pessimistic about the economy's outlook over the next six months, up from 25% in Q1. Additionally, a net 28% reported a deterioration in their own trading during the three months through March, marking the weakest reading since mid-2020 during the COVID-19 pandemic.
Employment figures are equally concerning. A net 25% of firms laid off workers in Q2, the highest level since the global financial crisis in 2009. Furthermore, a net 10% expect to reduce staff numbers in the three months through September. Profit expectations are also bleak, with a net 34% of firms anticipating weaker profits in the third quarter, accompanied by falling investment intentions.
On a slightly more positive note, only a net 23% of firms expect to increase prices in Q3, the lowest since 2021. Additionally, companies are finding it easier to recruit workers, signaling reduced wage pressure. Fewer companies also reported rising costs, suggesting some relief from inflationary pressures.
GBP/USD Mid-Day Outlook
Daily Pivots: (S1) 1.2622; (P) 1.2661; (R1) 1.2690; More...
GBP/USD recovered ahead of 1.2612 support as range trading continues. Intraday bias remains neutral at this point. On the upside, firm break of 1.2705 resistance will argue that pull back from 1.2859 has completed, and bring retest of this high instead. Nevertheless, sustained trading below 1.2633 resistance turned support will argue that whole rise from 1.2298 has completed, and target 1.2445 and below.
In the bigger picture, price actions from 1.3141 medium term top are seen as a corrective pattern that is still in progress. Break of 1.2445 support will confirm that another falling leg has started and target 1.2036 cluster support again (38.2% retracement of 1.0351 (2022 low) to 1.3141 at 1.2075. Nevertheless, break of 1.2892 resistance will argue that larger up trend from 1.0351is ready to resume through 1.3141.
Economic Indicators Update
| GMT | Ccy | Events | Actual | Forecast | Previous | Revised |
|---|---|---|---|---|---|---|
| 22:45 | NZD | Building Permits M/M May | -1.70% | -1.90% | -2.10% | |
| 01:30 | AUD | RBA Meeting Minutes | ||||
| 09:00 | EUR | Eurozone Unemployment Rate May | 6.40% | 6.40% | 6.40% | |
| 09:00 | EUR | Eurozone CPI Y/Y Jun P | 2.50% | 2.50% | 2.60% | |
| 09:00 | EUR | Eurozone CPI Core Y/Y Jun P | 2.90% | 2.80% | 2.90% | |
| 13:30 | CAD | Manufacturing PMI Jun | 50.2 | 49.3 |
Stocks Held Back Crypto Gains
Market picture
The crypto market retreated by 0.6% in 24 hours to a total cap of $2.31 trillion. The cautious mood can be attributed to a downward move in US and European stock markets and the momentum of a stronger dollar. However, the dynamics of coins are not homogeneous. The decline of more than 1% in Bitcoin, Ethereum, and BNB contrasts with the growth of more than 2.5% in Toncoin, Cardano, and Tron. Temporary institutional favourites are suffering losses due to the pull from risk in traditional financial markets.
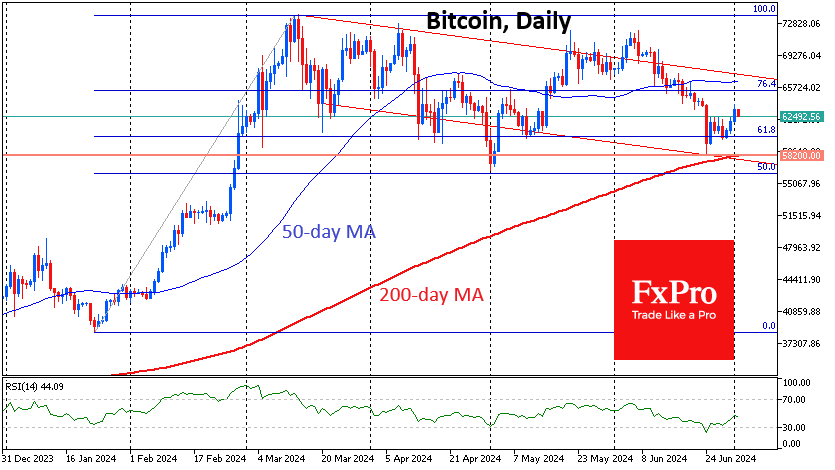
Bitcoin has pulled back to $62.6K after two failed attempts to consolidate above $63.0K on Monday. Continued market wariness could bring the price back to the $60K area in the near term, forcing a retest of the 61.8% retracement level from the January lows to the March highs.
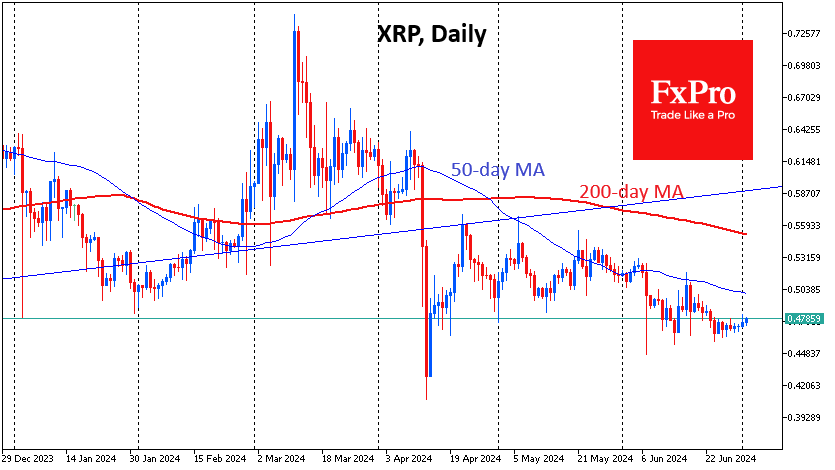
At the end of last month, volatility in XRP was falling after the price returned to the most important support of the last 12 months. Since Saturday, there has been a dominance of buyers, keeping the balance of power on the bullish side until Tuesday morning. In our view, confirmation of the bullish trend recovery is required, which could be a retracement of the $0.50 price where the important round level and the 50-day moving average are combined.
News background
According to CoinShares, crypto fund investments fell by a paltry $30 million last week after outflows of $584 million a week earlier. Bitcoin investments were up $10 million, while Solana was up $1.6 million; Ethereum was down $61 million. Grayscale’s bitcoin ETF saw outflows of $153 million for the week.
Weekly trading volumes rose 43% to $6.2B but remain well below the $14.2bn average for the year.
Bitcoin is looking for the next big catalyst for an upward move. It’s not on the horizon yet, but DigitalX expects things could change as the US election approaches.
The US Treasury Department has approved a new reporting order requiring cryptocurrency brokers, including exchanges and payment processors, to report all sales and exchanges of digital assets to the IRS, regardless of the amount of the transaction.
Vitalik Buterin suggested a way to speed up transactions in Ethereum. One option to increase throughput could be to change the architecture of slots and epochs. According to Arkham, Buterin owns over $857 million in crypto assets.
Circle was the first to receive a licence to issue stablecoins under the new Cryptocurrency Regulation Act in the European Union (MiCA). Circle Mint France was granted the right to issue EURC and USDC euro-denominated stablecoins.
Apollo Crypto noted that NFT sales collapsed by 44% in the second quarter due to the crypto market’s downturn and the meme token boom. This is largely due to interest in ‘political’ and celebrity-created meme coins.
Air purifier manufacturer Kronos Advanced Technologies became the first US public company to accept payment for its products using SHIB tokens.
Fed’s Goolsbee suggests rate cuts if inflation declines further
Chicago Fed President Austan Goolsbee has suggested that Fed should consider cutting interest rates if inflation continues its downward trajectory towards the 2% target. He emphasized the importance of adjusting monetary policy to align with changing inflation dynamics.
Goolsbee explained that holding the current rate as inflation decreases effectively tightens monetary conditions. He noted, "If you sit with the rate somewhere while inflation goes down, you're tightening. The reason that you would want to tighten is if you think that you're not on a path to 2%."
Furthermore, Goolsbee pointed out the importance of balancing inflation control with overall economic stability. He noted, "If employment starts falling apart or if the economy begins to weaken, which you've seen some warning signs, you've got to balance that off with how much progress you're making on the price front." While acknowledging that the unemployment rate remains relatively low, he also highlighted its recent upward trend, indicating potential economic softening.
EUR/USD: Euro Bulls Should Not be Complacent after French Election
- Sovereign credit risk remains elevated in France despite yesterday’s rallies seen in the EUR/USD, CAC 40 & DAX ex-post first round of the French legislative election.
- Speculative net capital outflows & bearish sentiment in CAC 40 & DAX may trigger a negative feedback loop into the EUR/USD.
- EUR/USD at risk of breaking down below 1.0656
The EUR/USD gapped up by 26 pips at the start of yesterday, 1 July Asian session from last Friday, 28 June US session close of 1.0713 on a positive backdrop that preliminary results of the first round of the French legislation election that saw Le Pen’s far-right National Rally party took the lead but without a majority foothold ahead of the far-left coalition party, New Popular Front while French President Macron’s centrist alliance dwindled to third place. The National Rally party fell short of obtaining the absolute majority of 289 seats to control the French Parliament.
Together with news flow that reported horse-trading activities have taken place between the far-left and Macron’s centrist party to prevent Le Pen’s National Rally from securing a majority foothold in the upcoming second round of voting that occurs this Sunday, 7 July, the EUR/USD rallied further during the start of yesterday’s European session to print an intraday high of 1.0777, that’s summed up to an intraday gain high watermark of +64 pips/+0.60% from last Friday, US session close.
Similar intraday positive performances can also be observed on the benchmark stock indices for France and Germany where the CAC 40 and DAX recorded an intraday gain high watermark of +1.91% and +1.24% from their respective closing levels of last Friday.
Reversal of yesterday’s intraday gains in the EUR/USD, CAC 40 & DAX
However, these intraday rallies cannot be maintained, and the EUR/USD ended yesterday’s session,1 July with a meagre daily gain of just +0.25%, and a similar reversal can also be seen on the French and German stock markets where the CAC 40 and DAX pared back almost 50 percent or more of their early intraday gains yesterday to record closing daily gains of +1.09% and +0.30% respectively.
Sovereign credit risk remains elevated in France
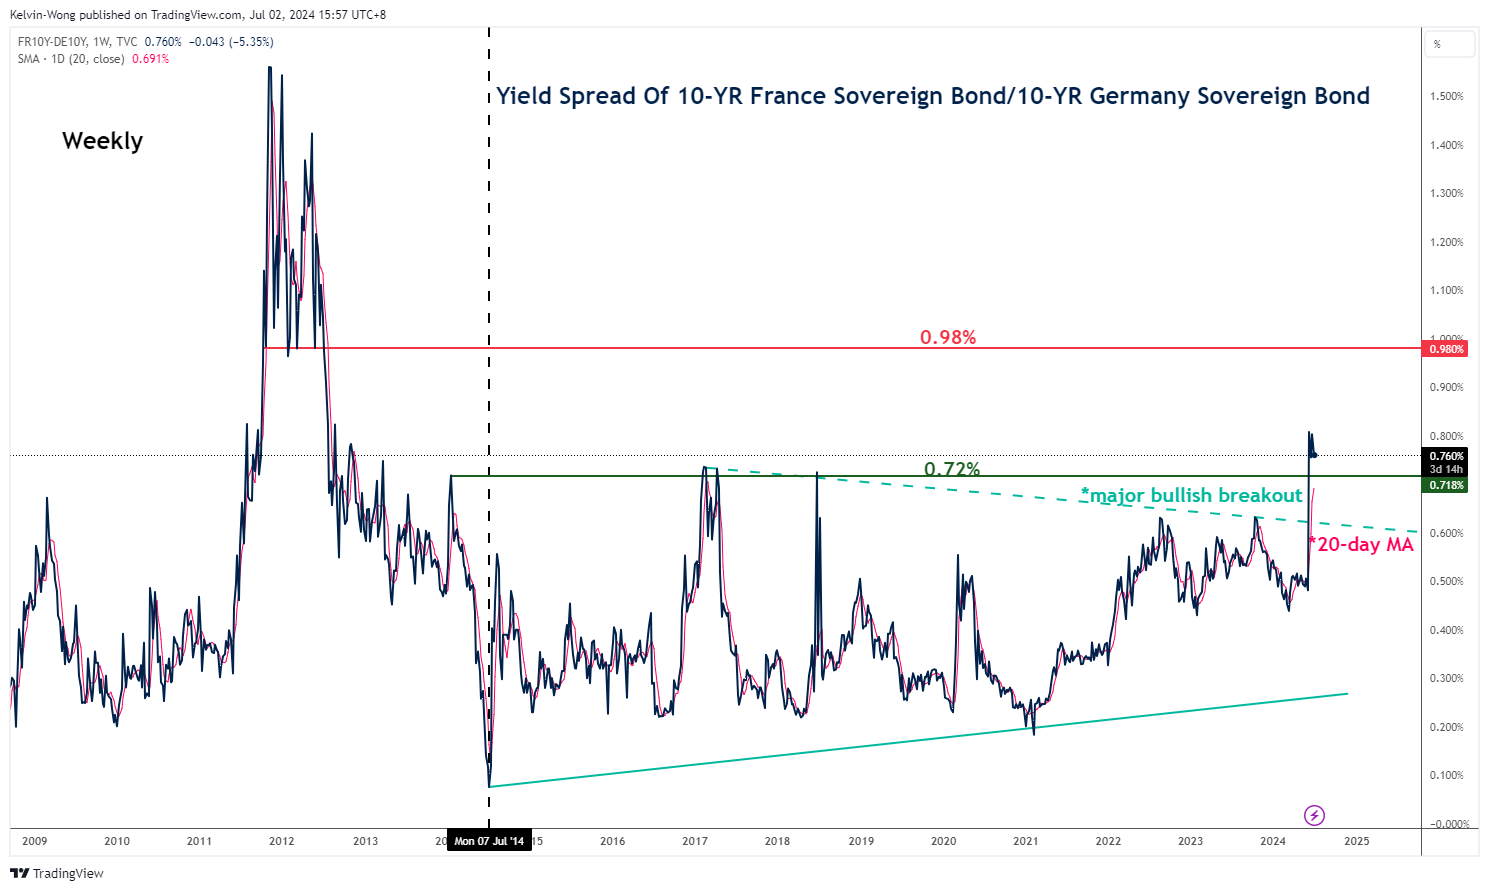
Fig 1: Yield spread of 10-year French & German government bonds as of 2 Jul 2024 (Source: TradingView, click to enlarge chart)
Even though, the yield spread between the 10-year France and German sovereign bond has inched lower slightly to 0.765% at this time of the writing from a 12-year high of 0.82% printed last Thursday, 27 June; it remains at an elevated level according to its trend analysis.
The yield spread is still evolving within a short-term uptrend phase after a major bullish breakout that occurred on the week of 10 June 2024 as it remains supported at 0.72% which corresponds to a rising 20-day moving average with the next medium-term resistance coming in at 0.98% (see Fig 1).
Also, if Macron’s centrist alliance decides to support the far-left coalition, the New Popular Front party now in second place after the first round of voting with a projected vote share of 28% to 29%, it may allow the far-left party an easier maneuver ticket in the France parliament to advocate their more aggressive fiscal spending policies and tax cuts as compared to the far-right which in turn is likely to widen France’s last year excessive budget deficit of 5.5% that breached EU’s benchmark budget deficit ceiling of 3%.
Therefore, the bond vigilantes are still on the lookout for a possible uptick in credit risk in France which in turn may spread to the wider Eurozone due to the contagion effect as European banks do have significant holdings of French sovereign bonds since France is one of the economic anchors in the EU other than Germany.
Current short-term bearish trends in CAC 40 & DAX trend may trigger negative sentiment towards the Euro
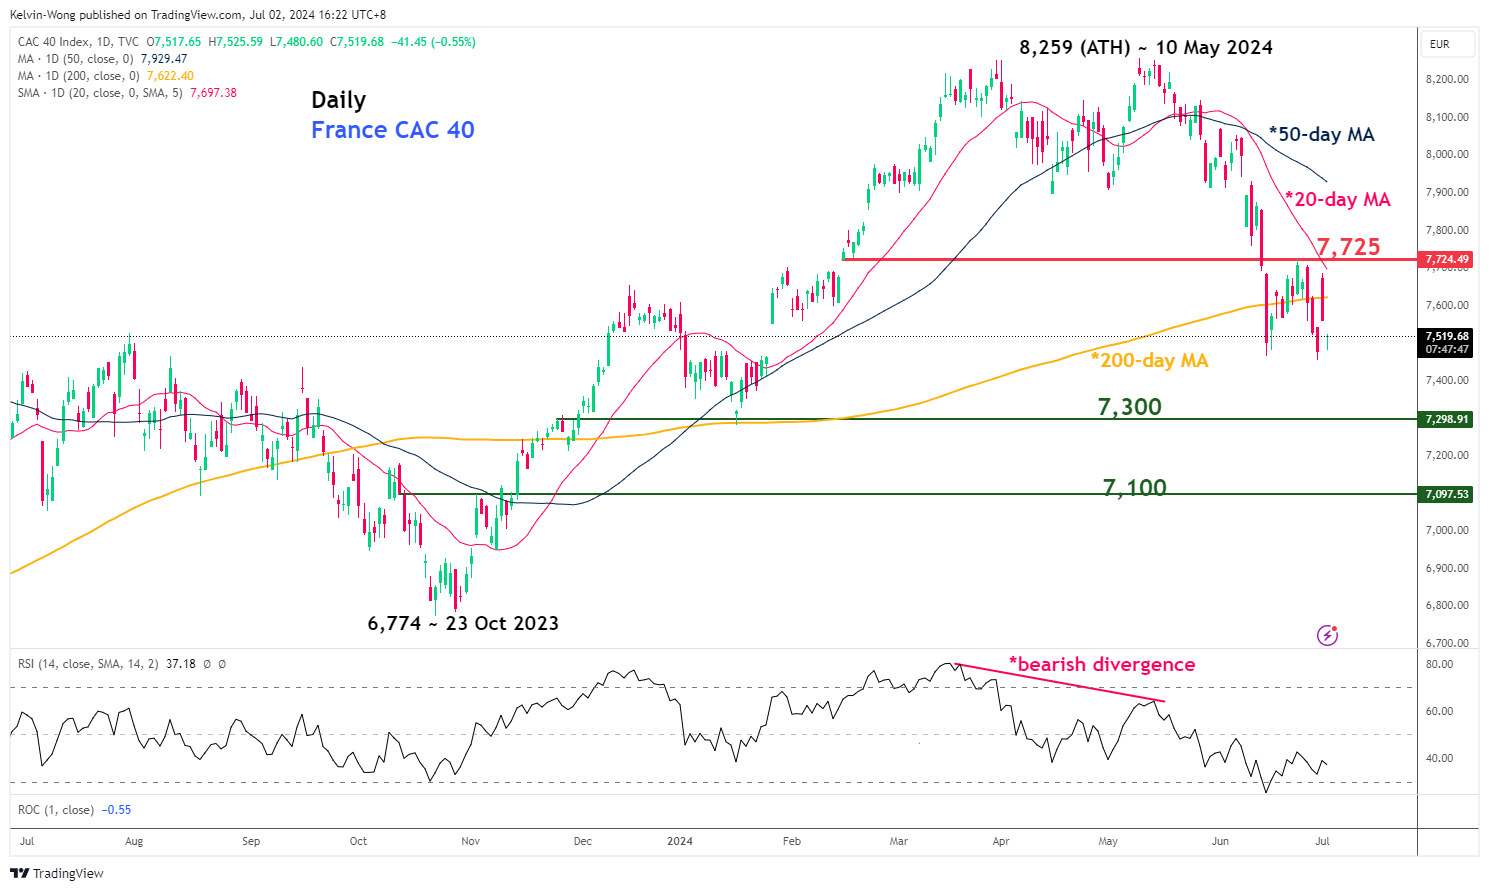
Fig 2: France CAC 40 medium-term trend as of 2 Jul 2024 (Source: TradingView, click to enlarge chart)
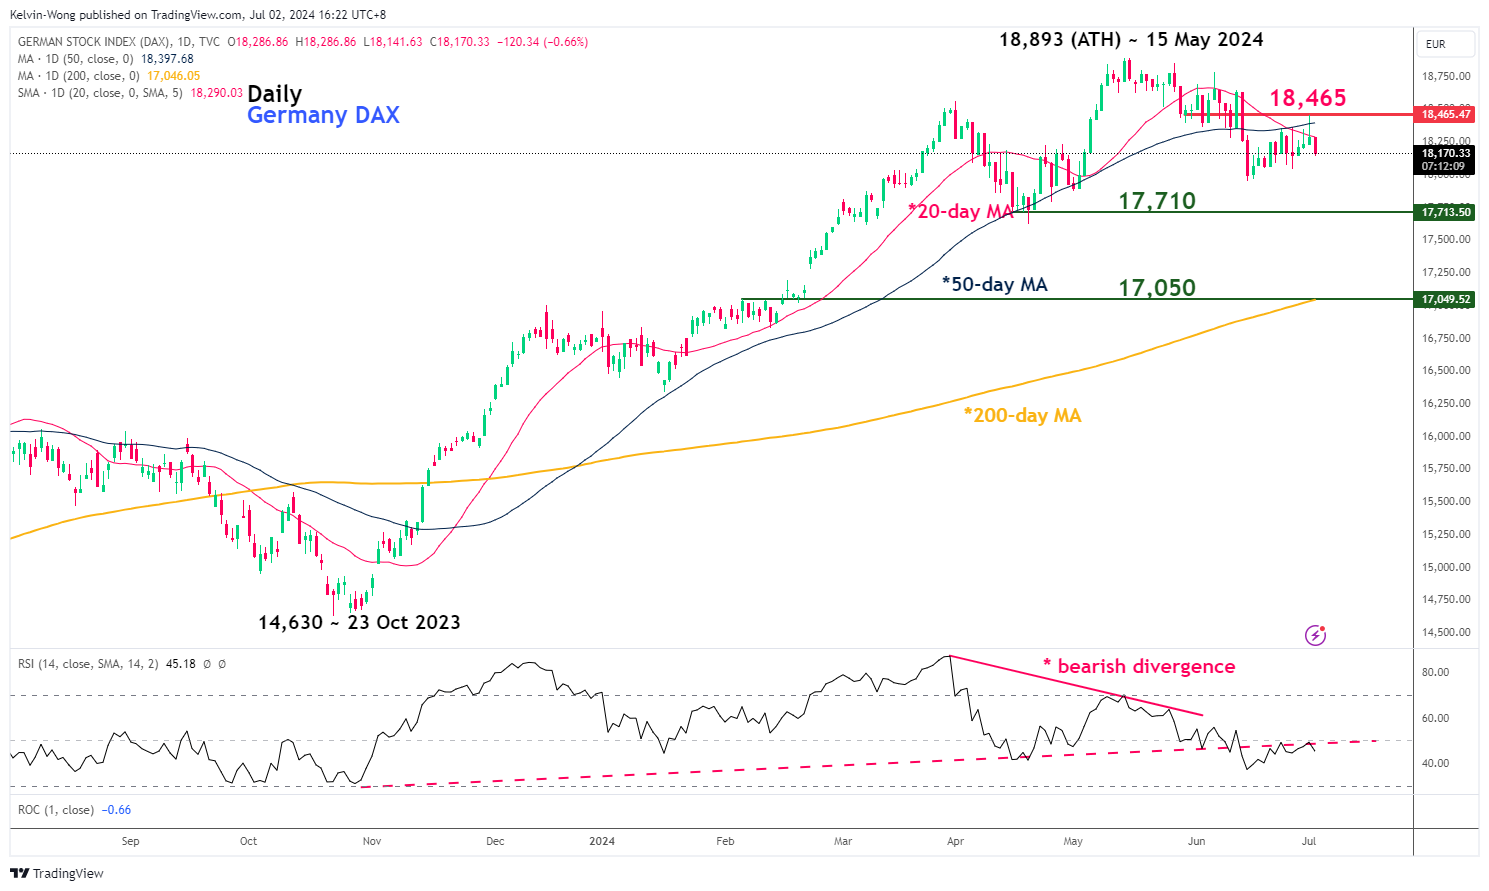
Fig 3: Germany DAX medium-term trend as of 2 Jul 2024 (Source: TradingView, click to enlarge chart)
As seen in the daily technical charts of the French CAC 40 and German DAX, both of them are still evolving in short-term bearish trends as their respective price actions remain below their respective downward-sloping 20-day moving averages with bearish momentum conditions seen in their daily RSI momentum indicators.
Interestingly, yesterday’s price actions of the CAC 40 and German DAX have shaped daily key bearish reversals right below their respective key short-term pivotal resistances of 7,725 and 18,465 respectively (see Fig 2 & 3).
The short-term movements in the FX market are also impacted by short-term speculative equities-related capital flows. Given the prevailing short-term bearish trends that are still intact on the CAC 40 and DAX, in turn, may see net short-term capital outflows that can likely trigger a double-whammy negative impact on the EUR/USD at least on a short-term horizon from both flows and sentiment perspectives.
Watch the 1.0770/0790 key short-term resistance on EUR/USD
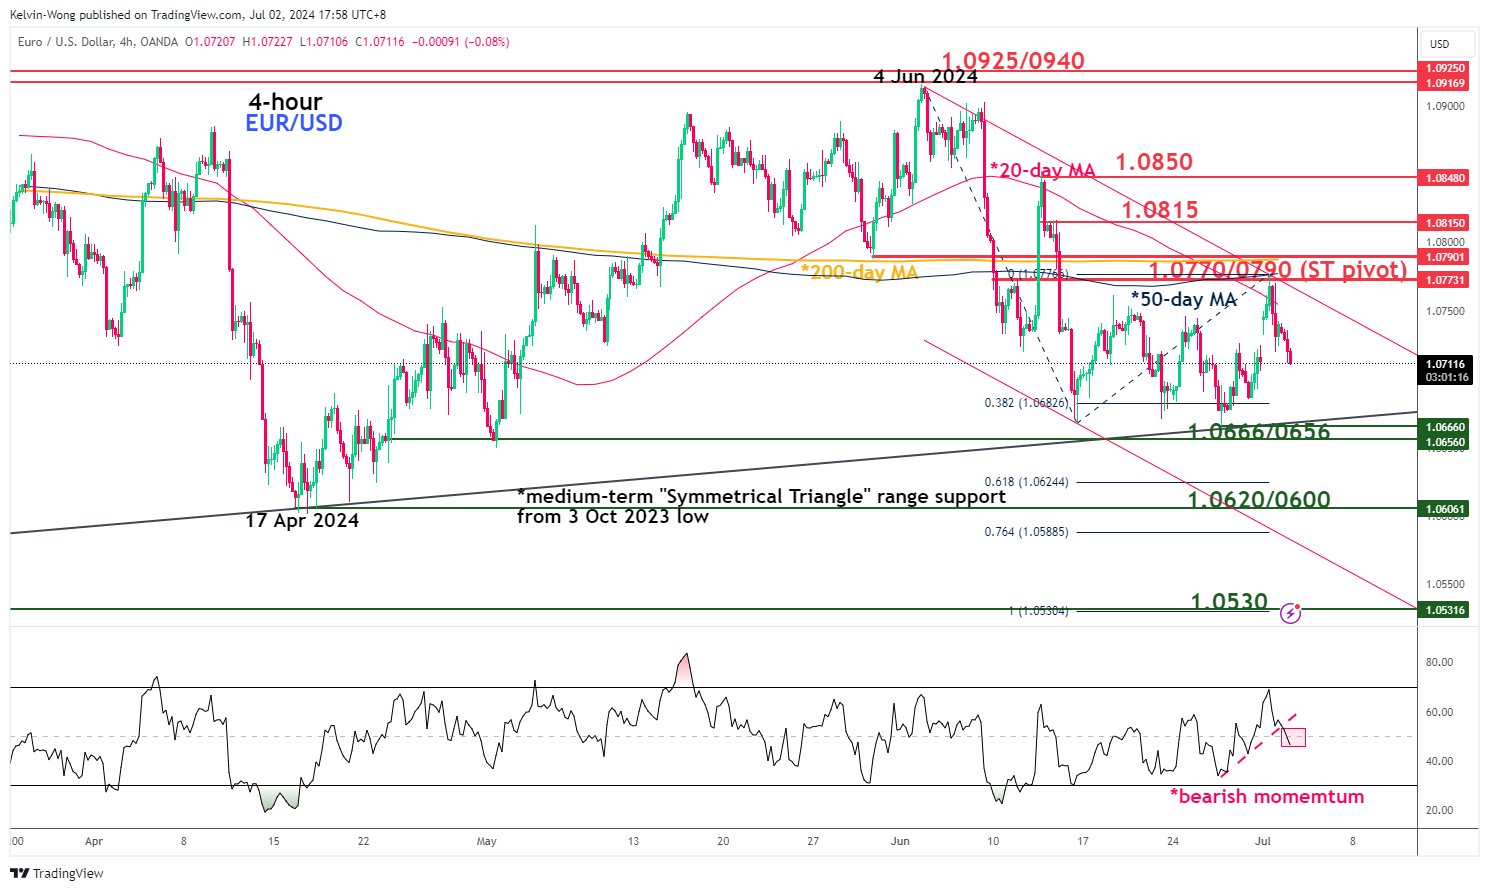
Fig 4: EUR/USD short-term trend as of 2 Jul 2024 (Source: TradingView, click to enlarge chart)
Current price actions of the EUR/USD have wiped out yesterday’s post-French election results-induced rally after a bearish reversal right at the intersection of all three key moving averages (20-day, 50-day, and 200-day), and the 4-hour RSI momentum indicator has flashed out a bearish condition (see Fig 4).
These observations from a technical analysis perspective suggest low odds of a potential recovery or bottoming configuration at play for the EUR/USD.
If the 1.0770/0790 key short-term pivotal resistance holds, a break below 1.0656 support (lower limit of the “Symmetrical Triangle” range from 3 October 2023 low) may trigger further downside pressure to expose the next intermediate supports at 1.0620/0600 and 1.0530.
However, a clearance above 1.0770/0790 negates the bearish tone for a squeeze up towards the upper limit of the “Symmetrical Triangle “range to see the next intermediate resistances coming in at 1.0815, 1.0850, and 1.0925/0940.
Australian Dollar Eyes Retail Sales
The Australian dollar has posted slight losses on Tuesday. AUD/USD is trading at 0.6649 in the European session, down 0.15% on the day.
Australian retail sales expected to improve
Australian consumers have been in frugal mood and have reduced their discretionary spending. Consumers have been squeezed by high borrowing costs and the high cost of living. Retail sales ticked upwards by only 0.1% m/m in April. The gain was negligible, considering that Australia’s population has been swelling due to an increase in immigration. The May retail sales report on Wednesday is expected to show some improvement, with a market estimate of 0.3% m/m.
RBA minutes: higher rates could be needed
The RBA minutes from the meeting earlier this month noted that the Board decided that the case to hold rates was stronger than for hiking. The RBA held rates at 4.35% for a fifth straight time but the Board raised concerns about the rise in inflation expectations and warned that it might have to raise rates if the current policy was not “sufficiently restrictive”.
The takeaway is that the RBA won’t be abandoning its “higher for longer” stance anytime soon. The second-quarter inflation report will be released on July 31 and will be a key factor in the RBA’s rate decision a week later.
The weak Australian economy could use a rate cut but the Reserve Bank of Australia is handcuffed due to rising inflation, particularly service inflation. CPI jumped to 4.0% in May, up from 3.6% in April and higher than the market estimate of 3.8%. The RBA may have to delay an initial rate cut until 2025 if there is no significant progress in the battle against inflation.
The RBA’s target range is 2% to 3% and the final phase of bringing inflation back down to the target range has proven elusive despite high interest rates. There is a real possibility that the RBA could raise rates in order to dampen inflation, a specter that consumers and businesses hope does not materialize.
AUD/USD Technical
AUD/USD tested resistance at 0.6660 earlier. Above, there is resistance at 0.6699
0.6630 and 0.6591 are the next support levels
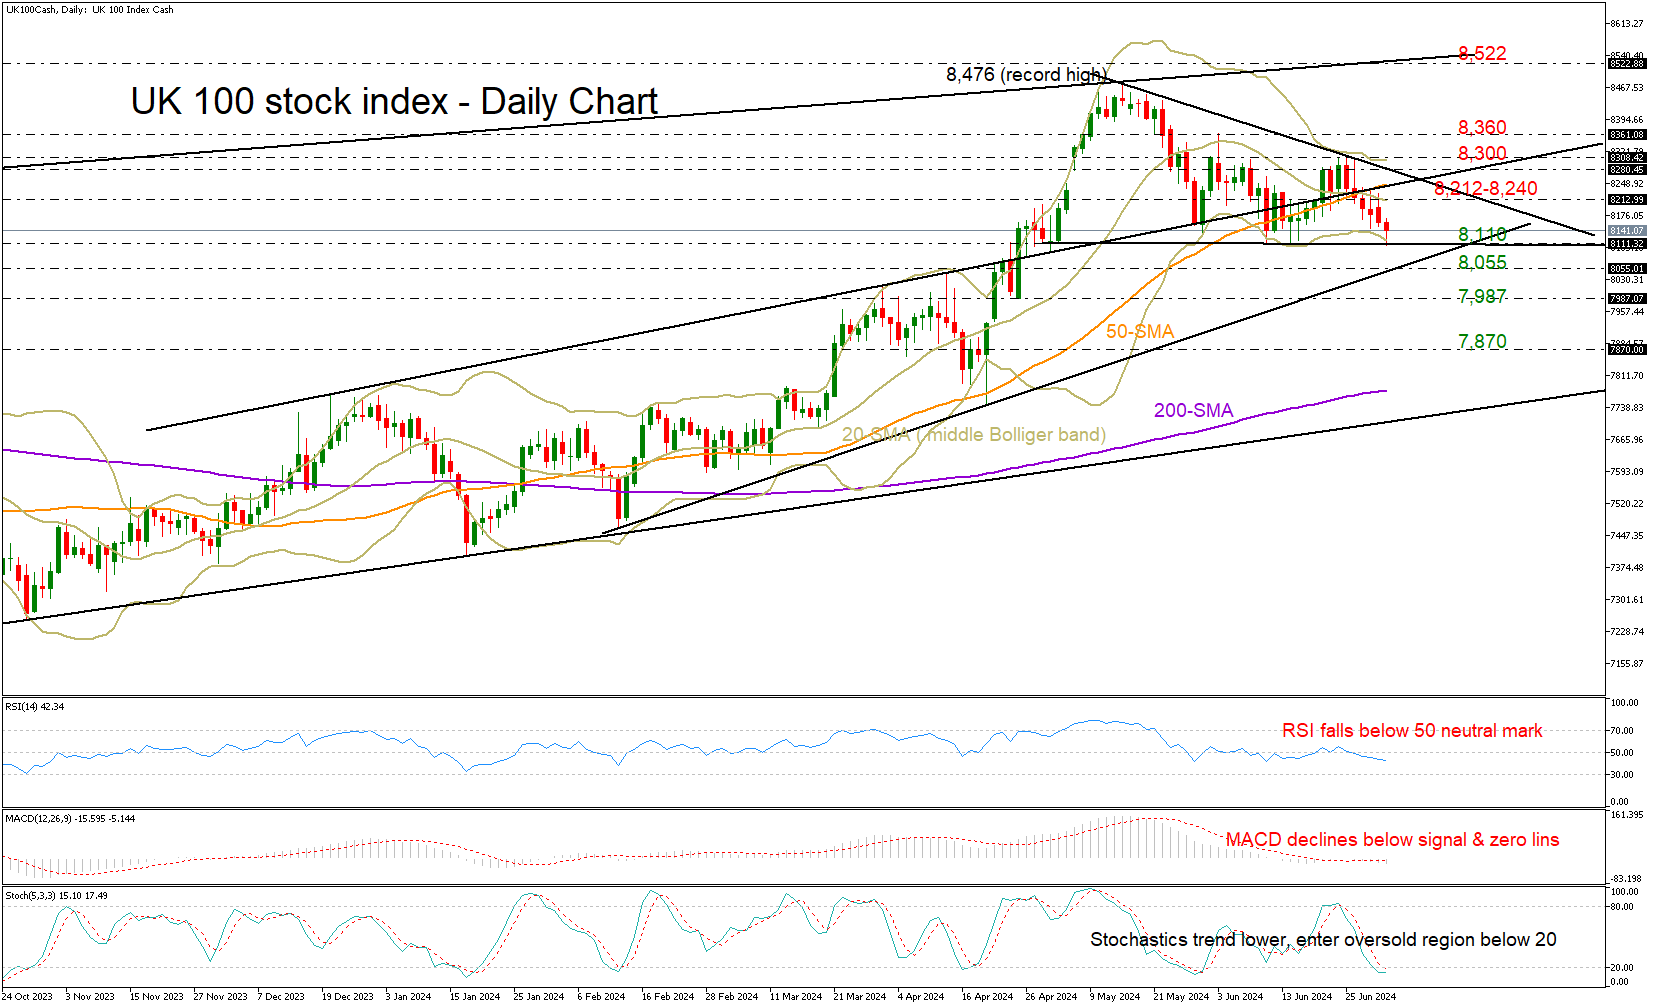
UK 100 Index Experiences Pre-election Decline
- UK 100 index erases June’s recovery attempt as the UK election looms
- A break below 8,055 could worsen short-term outlook
The UK 100 stock index (cash) continues to suffer for the sixth consecutive trading day, extending its downleg aggressively to the critical support zone of 8,110 on Tuesday ahead of the election day on July 4.
The index could not mark a new higher high above the key resistance area of 8,300 and the important resistance line from February 2022, increasing fears that the negative reversal from the 8,476 record high could gain more legs.
Discouragingly, the 20- and 50-day simple moving averages (SMAs) have already posted a bearish cross, promoting the case of a bearish continuation. In addition to this, the RSI is currently losing ground below its 50 neutral mark and the MACD is diminishing below its zero and signal lines, both reflecting a clear bearish bias.
A step below the base of 8,110 could dampen market sentiment, but traders may not rush to sell the index until the price drops decisively below the ascending trendline at 8,055. Note that the stochastic oscillator is already within the oversold region, while the price itself is hovering near the lower Bollinger band. Hence, a pause in the ongoing bearish phase is likely. Yet, if the bears claim the 8,055 area, the next stop could be around April’s constraining region of 7,987, a break of which could cause a sharper downfall towards the 7,870 zone.
On the upside, the bulls must exit the triangle and knock down the wall at 8,300 in order to boost buying appetite towards the 8,360-8,400 barrier, but before that, they should first claim the 20- and 50-day SMAs at 8,212 and 8,245 respectively. Long-term traders might wait for a bullish trend extension above the crucial resistance line at 8,522 before driving towards the 8,600 psychological mark.
In summary, the UK 100 stock index is holding a bearish bias in the short-term picture, but selling interest could stay balanced until the price slides below 8,055.