Sample Category Title
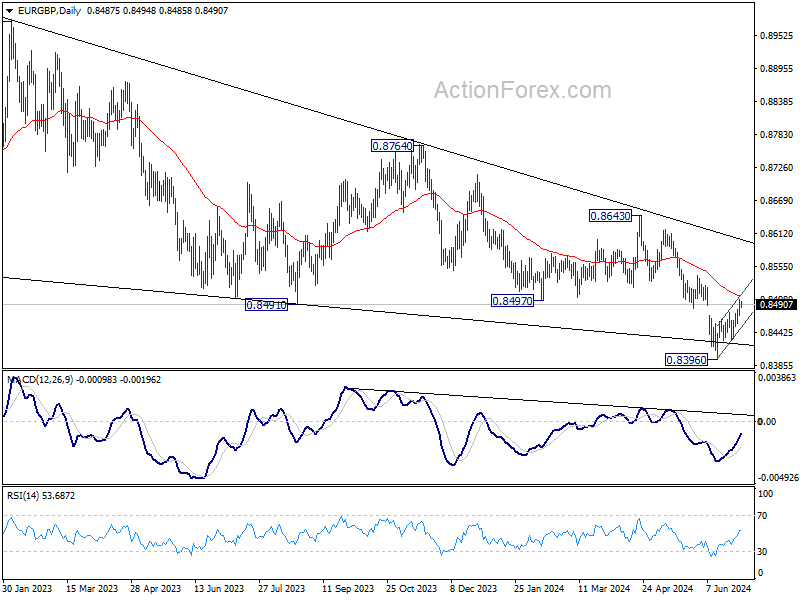
EUR/GBP Daily Outlook
Daily Pivots: (S1) 0.8475; (P) 0.8487; (R1) 0.8502; More...
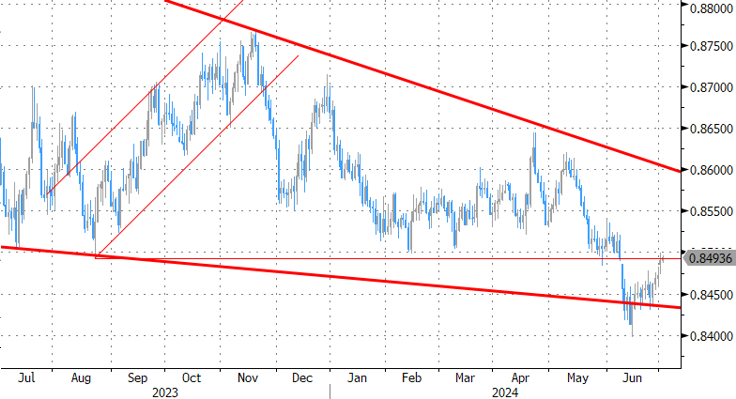
Intraday bias in EUR/GBP remains on the upside at this point. Sustained trading above 55 D EMA (now at 0.8501) will extend the rise from 0.8396 short term bottom to 0.8529 support turned resistance. On the downside, break of 0.8493 support will bring retest of 0.8396 low instead.
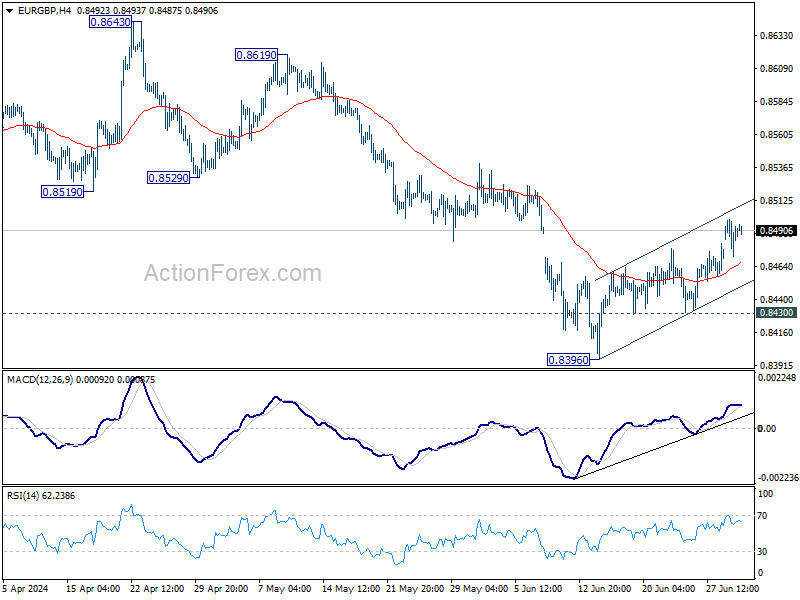
In the bigger picture, down trend from 0.9267 (2022 high) is in progress. Break of 0.8396 will target 0.8201 (2022 low). For now, outlook will remain bearish as long as 0.8643 resistance holds, even in case of stronger rebound.
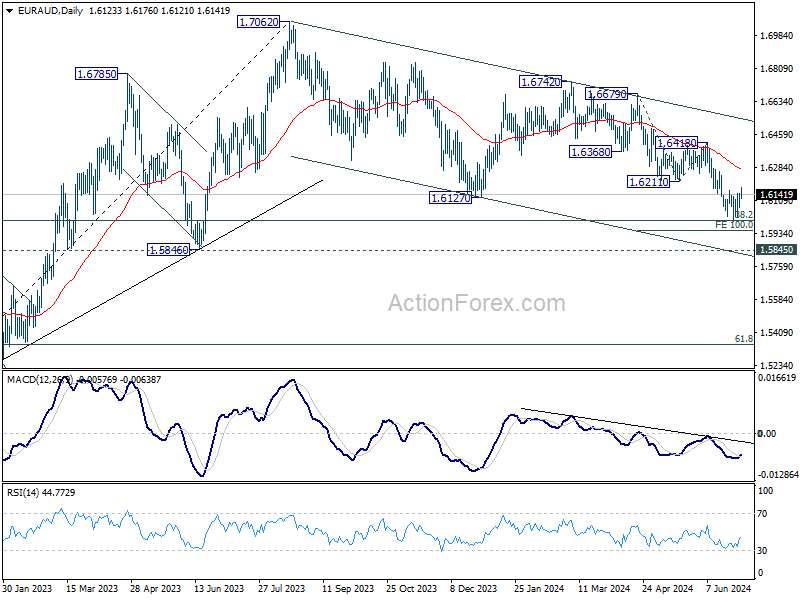
EUR/AUD Daily Outlook
Daily Pivots: (S1) 1.6085; (P) 1.6117; (R1) 1.6159; More...
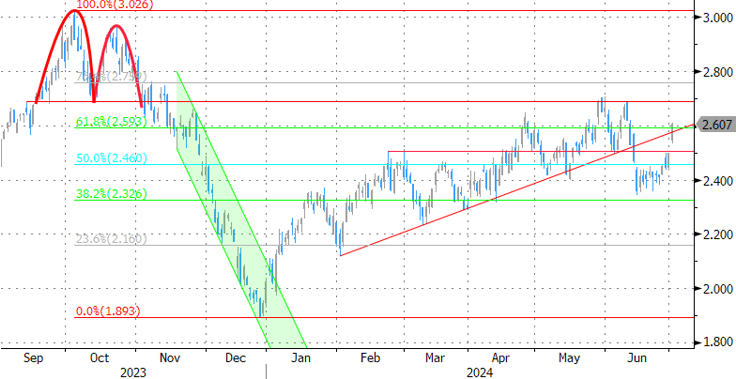
Intraday bias in EUR/AUD stays neutral as consolidations continue above 1.5996. Outlook stays bearish as long as 1.6211 support turned resistance holds. On the downside, break of 1.5996 will target 100% projection of 1.6679 to 1.6211 from 1.6418 at 1.5950. Firm break there will target 1.5846 key support next.
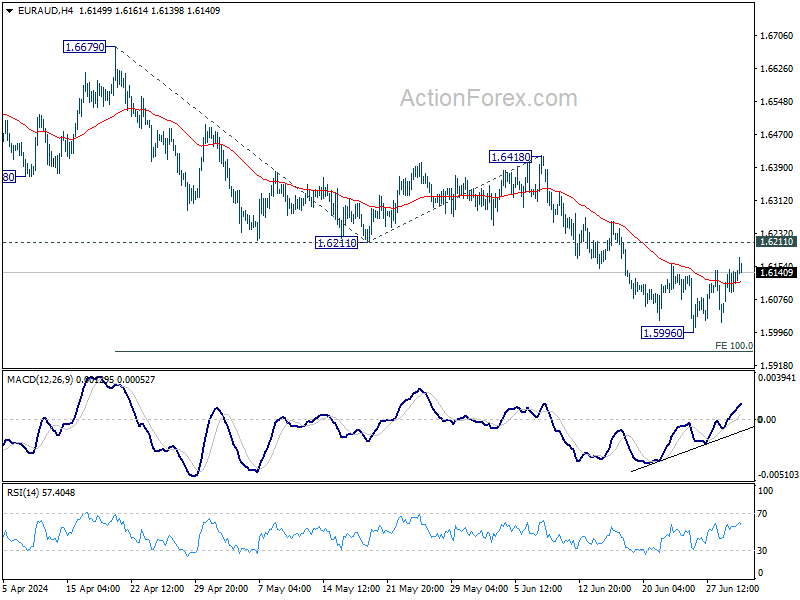
In the bigger picture, fall from 1.7062 medium term top is seen as a correction to the up trend from 1.4281 (2022 low) only. Strong support is still expected between 1.5846 and 38.2% retracement of 1.4281 to 1.7062 at 1.6000 to bring rebound. Break of 1.6148 resistance will argue that the correction has completed.
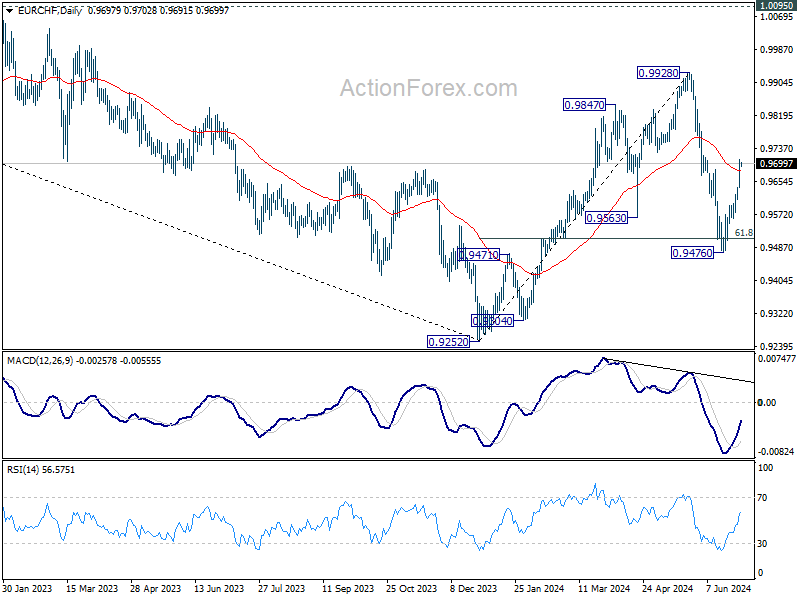
EUR/CHF Daily Outlook
Daily Pivots: (S1) 0.9656; (P) 0.9683; (R1) 0.9723; More....
EUR/CHF's break of 0.9683 resistance argues that fall from 0.9928 has completed at 0.9476, probably as a corrective move. Intraday bias is back on the upside for retesting 0.9928 high. On the downside, however, break of 0.9608 will bring retest of 0.9476 support instead.
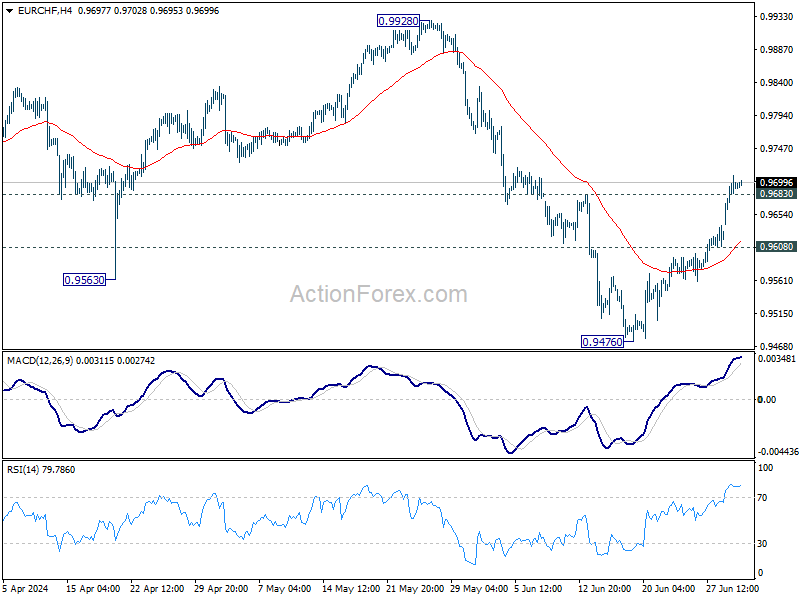
In the bigger picture, rebound from 0.9252 medium term bottom might not be completed yet. But even in case of resumption, strong resistance could emerge from 1.0095 to limit upside. Medium term outlook will be neutral at best as long as 1.0094 structural resistance holds. Meanwhile, break of 0.9476 will bring retest of 0.9252 low.
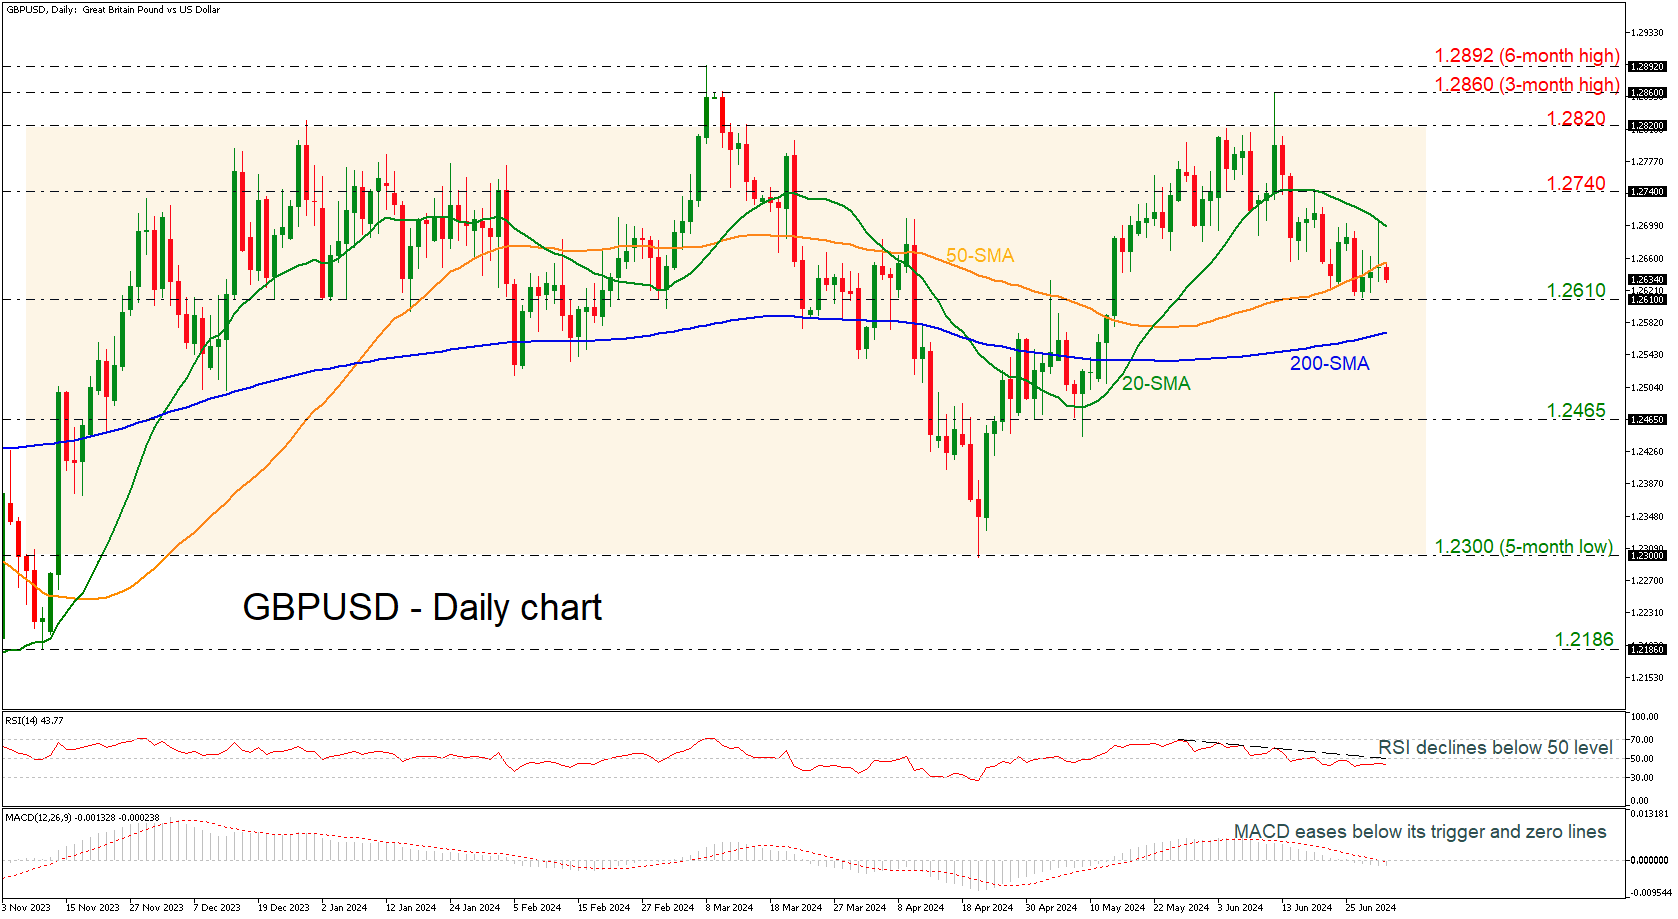
GBPUSD Remains Bearish in Very Short-Term
- GBPUSD’s recent bounce off 1.2300 runs out of steam
- RSI and MACD hold beneath mid-levels
GBPUSD started a bearish wave again after the spike towards the three-month high of 1.2860, sending prices beneath the 20- and 50-day simple moving averages (SMAs). The market is ready to retest the midpoint of the long-term trading range at 1.2610.
Short-term momentum indicators are also pointing to a continuation of the bearish bias. The RSI is still developing beneath its downtrend line and the neutral threshold of 50, while the MACD is standing beneath its trigger and zero lines with weak momentum.
Further losses should see the immediate 1.2610 support ahead of the 200-day simple moving average (SMA) at 1.2570. A drop lower could take the bears until the 1.2465 region, ahead of the lower boundary of the range at 1.2300.
In the event of an upside reversal, the 20-day SMA is the first resistance to focus on before hitting the 1.2740 resistance. A break above this level, the pair could retest the upper boundary of the sideways channel at 1.2820.
To sum up, GBPUSD has been in a trading range since mid-November and in the very short term is looking bearish.
Economic Calendar Today Features June European Inflation Reading
Markets
The relief rally in the wake of the first round in the French elections shifted in lower gear as the session went. It dawned that an RN absolute majority remains a possibility after next Sunday. This evening we’ll know more about how Macron’s centrists and the far-left seek to prevent that from happening by tactically withdrawing candidates. The final list is due by 6 PM and will give a clearer view, including for the pollsters. European stocks pared a 1.8% gain (EuroStoxx50) to just 0.74%. The common currency traded as high as 1.0776 before closing at 1.074 against an overall solid dollar. USD/JPY strengthened towards a new 34-yr high at 161.46. The only European financial variables that closed near or at intraday highs were core bond yields. German yields sprinted between 9.1 and 10.7 bps higher, unwinding some safe haven gains. Semi-core and peripheral spreads dropped with France’s tightening 6 bps on the day. Bunds underperformed Treasuries where an unexpectedly declining US manufacturing ISM (48.5) kept front-end yields at bay (+0.3 bps for the 2-yr). Longer tenors took the lead ever since the debate between Biden and Trump brought victory for the latter. A Trump presidency raises the specter of increased spending, which is pressuring the long-end in particular through risk premia.
The economic calendar today features the June European inflation reading. After several national numbers printing bang in line with expectations (including Germany’s yesterday), any deviation from a 0.2% m/m and 2.5% (headline, from 2.6% in May) consensus should be small. Core inflation is expected to marginally ease to 2.8%. We keep a close eye at services inflation (4.1% in May) for possibly having the biggest market moving potential. Inflation takes center stage at the ECB Sintra conference as well today with a deep dive into its drivers and the impact of geopolitical shocks. In her opening speech yesterday, ECB president Lagarde warned not to be complacent on the matter. She said that uncertainties remain and that “It will take time for [the ECB] to gather sufficient data to be certain that the risks of above-target inflation have passed.” Quotes coming from the symposium may trigger some intraday volatility in a trading session that’s going to be predominantly technically inspired. As the French dust settles (for now, that is), focus is now shifting towards the elections in the UK on July 4th. Sterling in recent weeks has been steadily losing ground vs the euro. EUR/GBP is currently closing in on the 0.85 barrier. This compares to the failed test of the 0.84 support mid-June.
News & Views
UK shop prices declined by 0.2% M/M in June, with both food (-0.1%) and non-food prices (-0.2%) contributing. The Y/Y-pace (0.2% from 0.6%) is the slowest since October 2021. On the non-food part, retailers tried to drive sales by discounting. This was particularly true for TVs with great deals to capitalize on the Euros fever. Food prices are still 2.5% higher than a year ago, but the disinflationary process continues. Non-food prices are down 1% Y/Y. Chief executive at the British Retail Consortium, Helen Dickinson said the slowdown is shop price inflation is at least partly due to improvements in operations and supply chains at the height of the cost of living crisis to compensate for the impact of global shocks on input costs. These investments are now paying off. In a clear message to the next UK government, the BRC advices to address some of the remaining major cost burdens weighing down the retail industry (eg broken business rates system) to help reduce the cost of living pressures.
Hungary took over as president of the EU council yesterday in the 6-month rotating role. In a column in the Financial Times, Hungarian PM Orban launched the view to “make Europe competitive again” building on work/popular themes since the start of the year. A new green deal, involving industrial stakeholders, and fixing heavy tax burdens for corporates is key to making Europe a more attractive investment destination again which could be the step-up to new economic success. Apart from the competitiveness, Orban suggest to curb illegal migration, shape the future of cohesion policy to achieve greater convergence among regions and establish the foundations of a farmer-oriented EU agricultural policy.
Graphs
GE 10y yield
The ECB cut its key policy rates by 25 bps at the June policy meeting. A more bumpy inflation path in H2 2024, the EMU economy gradually regaining traction and the Fed’s higher for longer US strategy make follow-up moves difficult. Markets are coming to terms with that. Meanwhile, some of the save haven bids were reversed after the first round in the French elections. The 2.34%-2.4% support zone looks a solid one.
US 10y yield
The Fed needs more evidence than just one slower-than-expected (May) CPI is providing. Upgraded inflation forecasts and a higher neutral rate complicate the timing of a first cut further. June dots suggest one move in 2024 and four next year. The long end of the curve is supported by increased odds of a Trump presidency after the debate with Biden. The spectre of increased spending (risk premia) pulled the 10-yr away from the 4.2% support area.
EUR/USD
EUR/USD is stuck in the 1.06-1.09 range. The desynchronized rate cut cycle with the ECB exceptionally taking the lead, strong US May payrolls and a swing to the right in European elections pulled the pair away from 1.09. The Fed meeting balanced the weaker than expected US CPI outcome. The increased probability of a hung French parliament after the first round offered the euro some relief.
EUR/GBP
Debate at the BOE is focused at the timing of rate cuts. May headline inflation returned to 2%, but core measures weren’t in line with inflation sustainably returning to target any time soon. Still some BoE members at the June meeting appeared moving closer to a rate cut. This might cap further sterling gains. The euro’s vulnerability to political event risk going into the French elections eased for now. EUR/GBP 0.84 is becoming solid support.
USD/CAD Daily Outlook
Daily Pivots: (S1) 1.3683; (P) 1.3716; (R1) 1.3769; More...
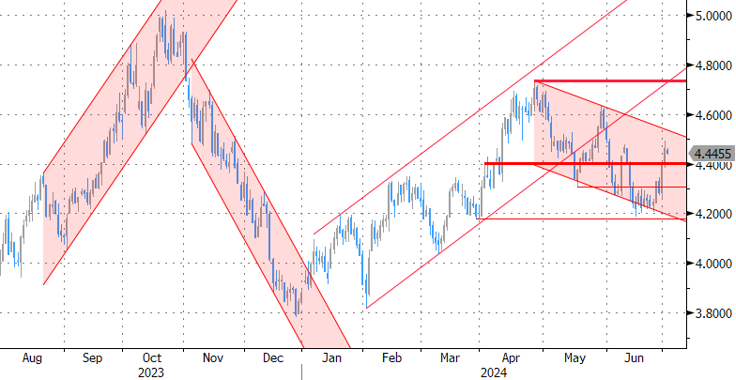
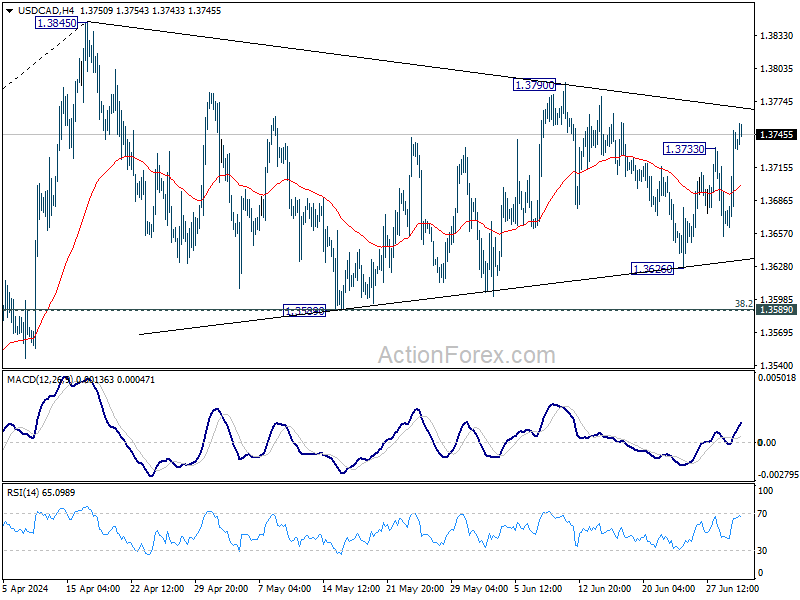
USD/CAD's rebound from 1.3626 resumed by breaking through 1.3733, but stays below 1.3790 resistance. Intraday bias remains neutral first. Consolidation from 1.3845 could extend further. While another fall could be seen, downside should be contained by 1.3589 cluster support (38.2% retracement of 1.3176 to 1.3845 at 1.3589) to bring rebound. Break of 1.3790 resistance will argue that larger rise is ready to resume and target 1.3845 resistance.
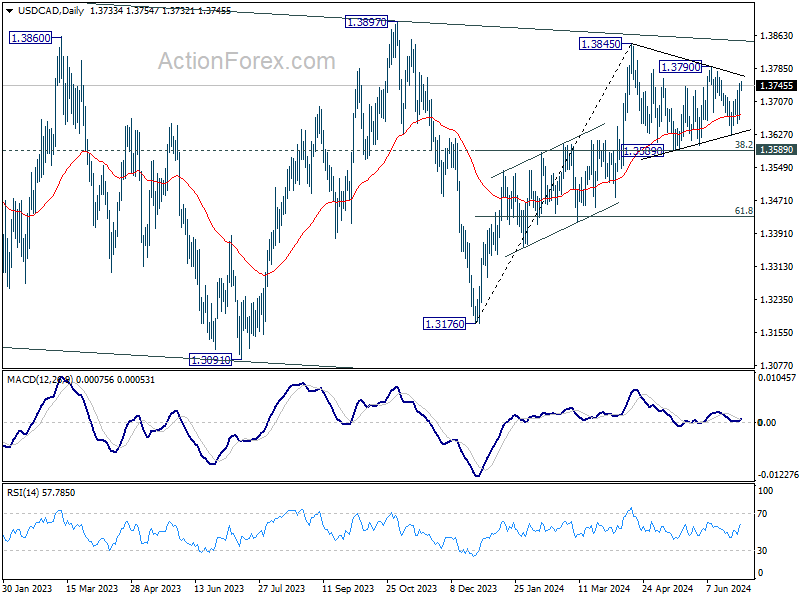
In the bigger picture, price actions from 1.3976 (2022 high) are viewed as a corrective pattern. In case of another fall, strong support should emerge above 1.2947 resistance turned support to bring rebound. Firm break of 1.3976 will confirm up resumption of whole up trend from 1.2005 (2021 low). Next target is 61.8% projection of 1.2401 to 1.3976 from 1.3176 at 1.4149.
AUD/USD Daily Report
Daily Pivots: (S1) 0.6639; (P) 0.6664; (R1) 0.6684; More...
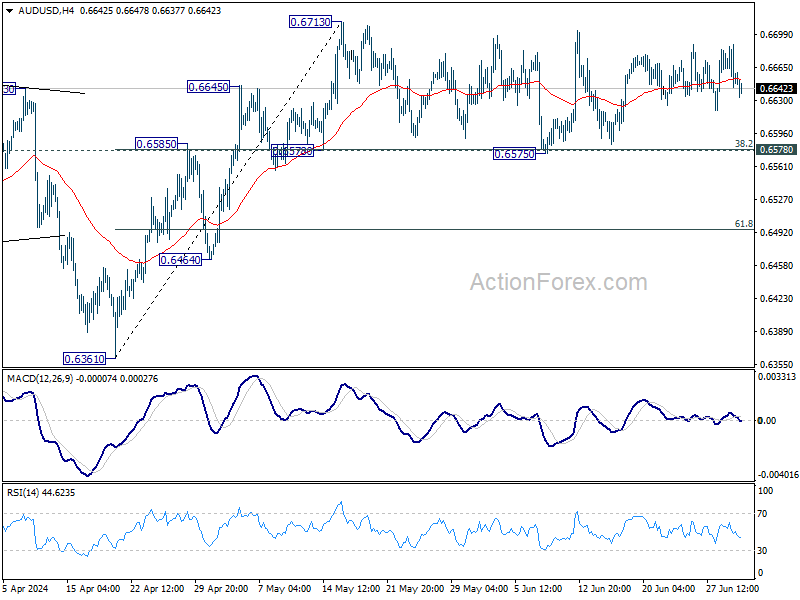
No change in AUD/USD's outlook as sideway consolidation continues below 0.6713. Intraday bias remains neutral for the moment. Further rally is in favor with 0.6578 cluster support (38.2% retracement of 0.6361 to 0.6713 at 0.6579) intact. On the upside, firm break of 0.6713 will resume whole rise from 0.6361 to 0.6870 resistance next. However, sustained break of 0.6578 will dampen this bullish view, and bring deeper fall to 61.8% retracement at 0.6495.
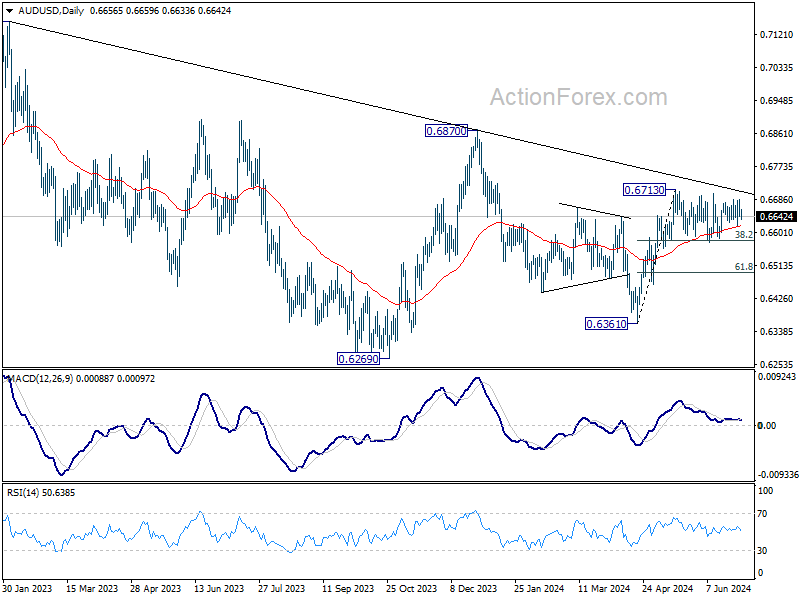
In the bigger picture, price actions from 0.6169 (2022 low) are seen as a medium term corrective pattern to the down trend from 0.8006 (2021 high). Fall from 0.7156 (2023 high) is seen as the second leg, which could have completed at 0.6269 already. Rise from there is seen as the third leg which is now trying to resume through 0.6870 resistance.
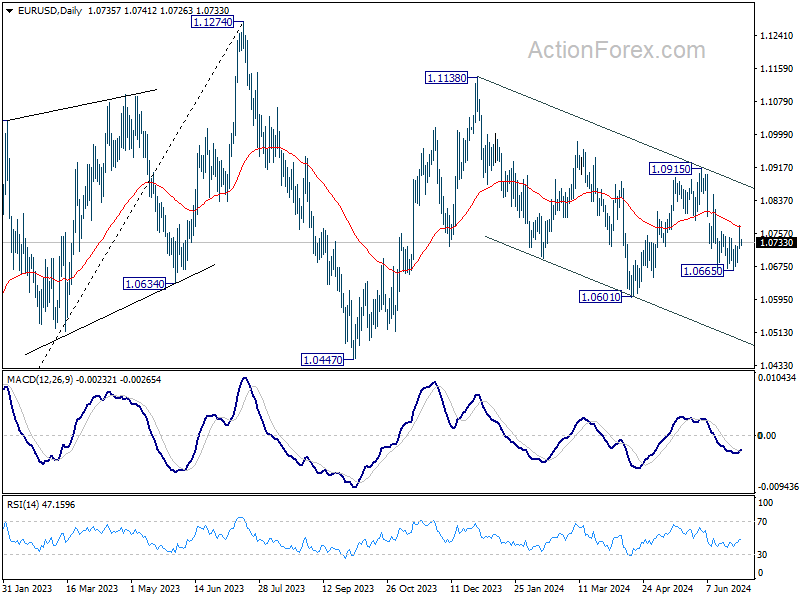
EUR/USD Daily Outlook
Daily Pivots: (S1) 1.0715; (P) 1.0745; (R1) 1.0771; More....
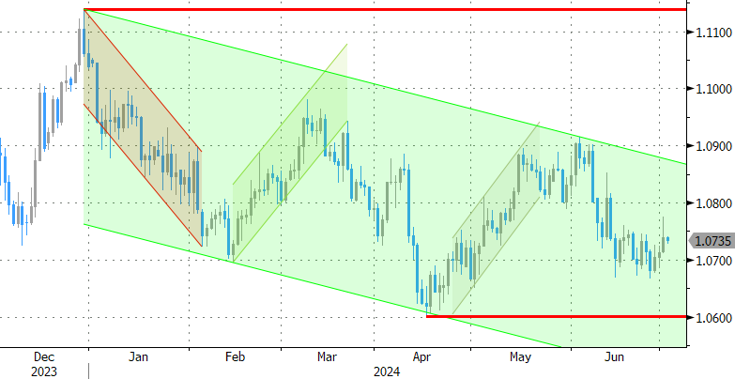
Intraday bias in EUR/USD remains neutral for the moment. On the upside, firm break of 55 D EMA will argue that pull back from 1.0915 has completed. Further rise should be seen back to 1.0915 resistance. However, break of 1.0665 will resume larger down trend through 1.0601 low instead.
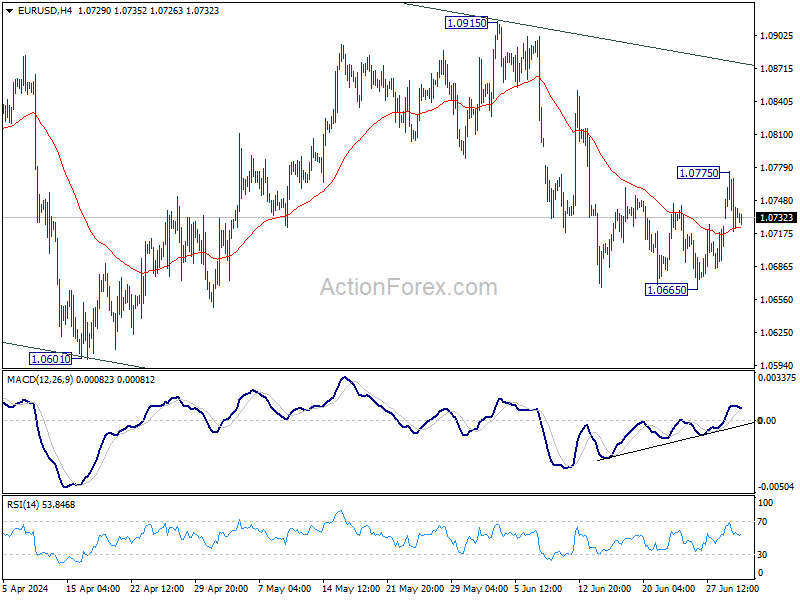
In the bigger picture, price actions from 1.1274 are viewed as a corrective pattern that's still in progress. Break of 1.0601 will target 1.0447 support and possibly below. For now, this will remain the favored case as long as 1.0915 resistance holds, in case of rebound.
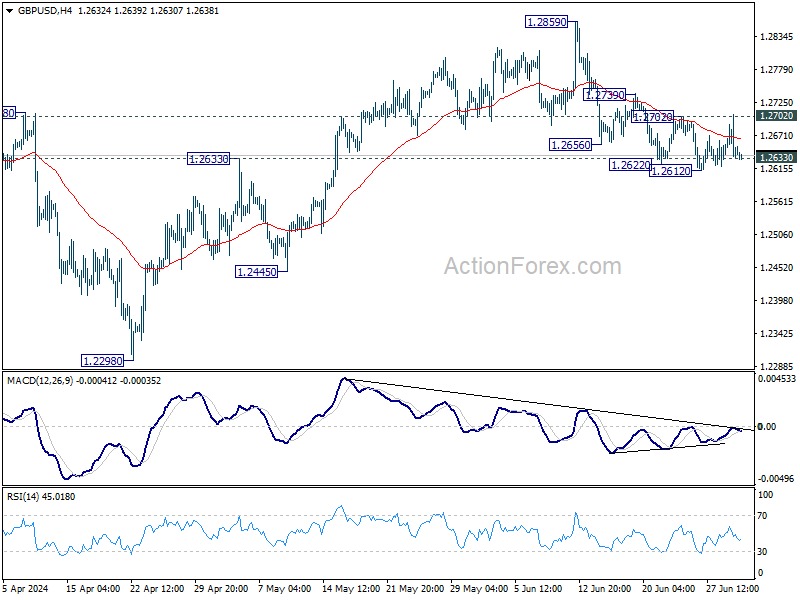
GBP/USD Daily Outlook
Daily Pivots: (S1) 1.2622; (P) 1.2661; (R1) 1.2690; More...
Intraday bias in GBP/USD stays neutral and outlook is unchanged. On the upside, firm break of 1.2702 resistance will argue that pull back from 1.2859 has completed, and bring retest of this high instead. Nevertheless, rejection by 1.2702 will keep risk on the downside. Sustained trading below 1.2633 resistance turned support will argue that whole rise from 1.2298 has completed, and target 1.2445 and below.
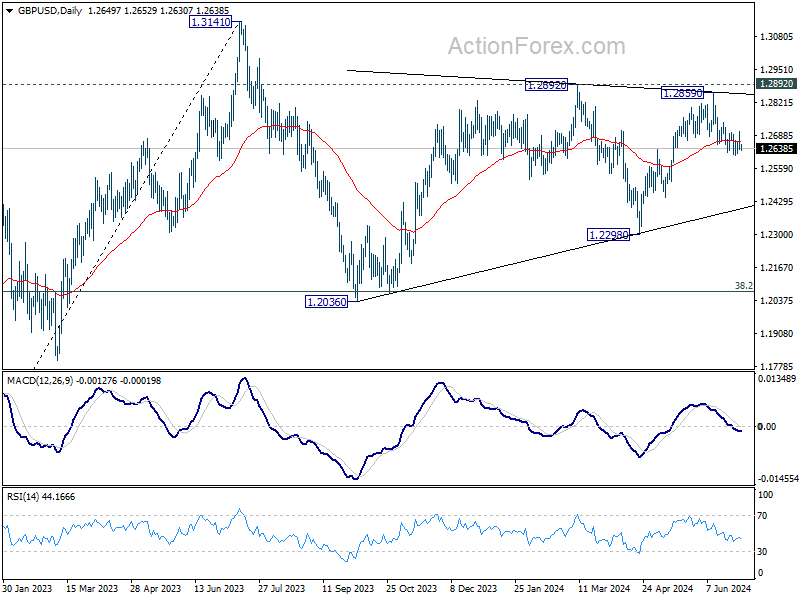
In the bigger picture, price actions from 1.3141 medium term top are seen as a corrective pattern that is still in progress. Break of 1.2445 support will confirm that another falling leg has started and target 1.2036 cluster support again (38.2% retracement of 1.0351 (2022 low) to 1.3141 at 1.2075. Nevertheless, break of 1.2892 resistance will argue that larger up trend from 1.0351is ready to resume through 1.3141.
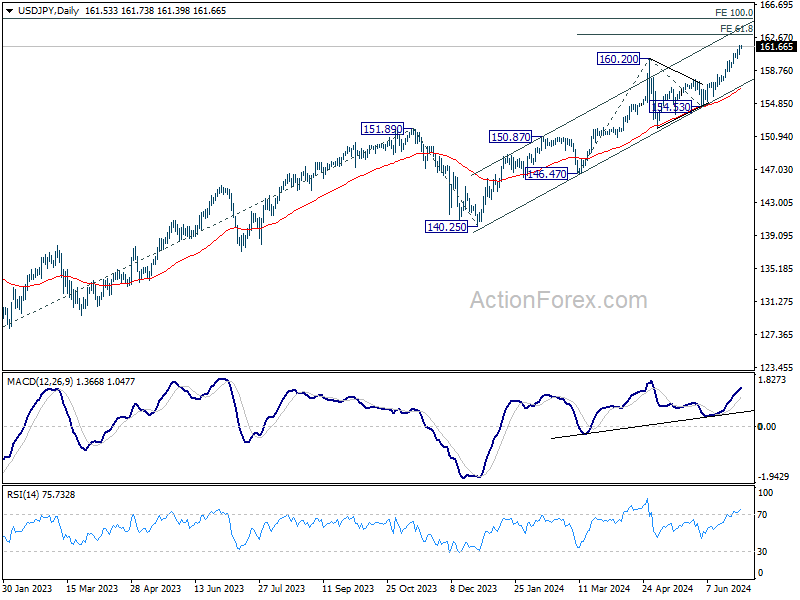
USD/JPY Daily Outlook
Daily Pivots: (S1) 160.90; (P) 161.31; (R1) 161.89; More...
Intraday bias in USD/JPY remains on the upside at this point. Current up trend should target 61.8% projection of 146.47 to 160.20 from 154.53 at 163.01. On the downside, below 160.25 minor support will turn intraday bias neutral and bring consolidations again, before staging another rally.
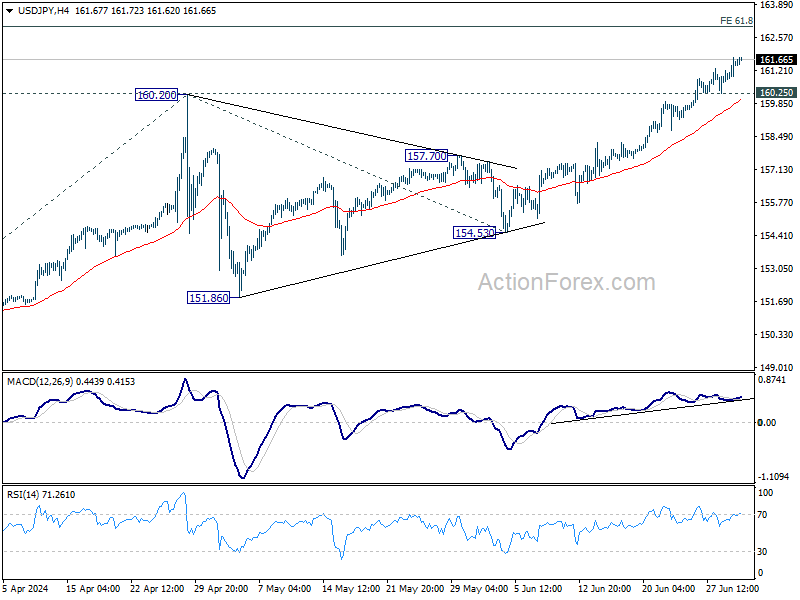
In the bigger picture, long term up trend is still in progress. Further rise is expected as long as 154.53 support holds. Next target is 100% projection of 127.20 (2023 low) to 151.89 (2023 high) from 140.25 at 164.94.