Sample Category Title
Sunset Market Commentary
Markets
With the EMU May Flash CPI and the US (core) April PCE deflators on the agenda, global trading today again was fully focused on inflation and what it could mean for the start and/or the pace of monetary easing. EMU inflation surprised slightly to the upside. Headline CPI slowed to 0.2% M/M from 0.6% but base effects caused the Y/Y measure to reaccelerate from 2.4% to 2.6% (2.5% expected). Core inflation also unexpectedly rebounded from 2.7% to 2.9%. A steep rise in services inflation (4.1% from 3.7%) likely will cause some discomfort at the ECB, especially in the wake of stronger than expected Q1 wage growth published last week. The ECB assumes that high Q1 wage data was for an important part due to one-offs and that it won’t revive a wage price spiral. The May services inflation indicates that, at least for now, this is mainly hope and hypothetical thinking. Today’s release won’t prevent the ECB to start its easing cycle with a 25 bps cut next week. However, markets further reduced the probability of a third ECB rate cut by year end to 25% from 50% at the start of the week. US April income rose 0.3% as expected. Spending was marginally softer at 0.2% M/M. The hyped April deflators (headline 0.3% M/M, 2.7% Y/Y, core 0.2% M/M; 2.8% Y/Y) printed bang in line with expectations and a such didn’t change the narrative since the CPI data published earlier this month. Still, at the final day of the month and going into the weekend, the absence of an upside inflation surprise apparently was enough for US bond markets to build on yesterday’s correction after the rise in yields earlier this week. US yields currently ease 3-4 bps across the curve (2-y 4.91%, 10-y 4.51%). German yields add up to 2 bps, scaling back a bigger intraday rise before the US data. After three days of correction, middle-of-the-road US data support a most rebound of US equities (S&P500 + 0.3%), but momentum isn’t really convincing. Oil (Brent $82 p/b) struggles to avoid further losses going into this weekends OPEC+ meeting.
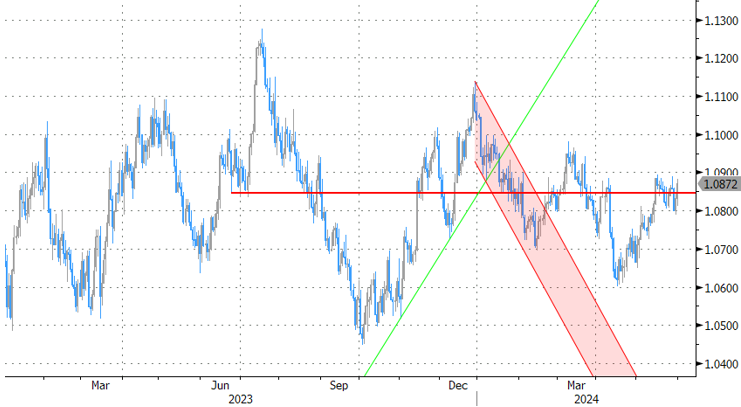
(Relative) divergence in the inflation dynamics (and yields) between the US and EMU supports the euro and at the same time prevents the dollar to really move away from the support levels tested earlier this week. A two-step intraday rally brings the EUR/USD pair (1.088) again within reach of the 1.0895 correction top. DYX currently trades near 104.4 with the mid-May low at 104.08. Yen gains, even against a weakish dollar remain limited (USD/JPY 156.8). Data published today showed Japanese authorities used JPY 9.8 trillion ($62 Bln) for interventions to prevent further yen weakening. Euro strength also lifted the EUR/GBP cross rate (0.853) off from the key 0.849/0.8500 support area.
News & Views
Turkish growth quickened sharply in the first quarter of this year. A 1.6% q/q analyst estimates for a 2.4% expansion proved too conservative. Quarterly growth was by far the result of strong private consumption, flanked by contributions from capital and government expenditures as well as net-exports. While resilient domestic consumption poses risks for the central bank (CBRT) trying to beat down inflation (currently between 70% and 75% depending on the gauge), it is believed that Turkey is now headed for an economic cooldown. The CBRT has jacked up interest rates since June of last year from 8.5% to 50% in March. Its lagged effect is expected to increasingly filter through the economy. Indeed, the central bank at the May policy meeting last week noted that “Recent indicators point to a slowdown in domestic demand compared to the first quarter.” The Turkish lira was left untouched today. Both against the dollar (32.20) and the euro (35.02) TRY is hovering close near its record lows.
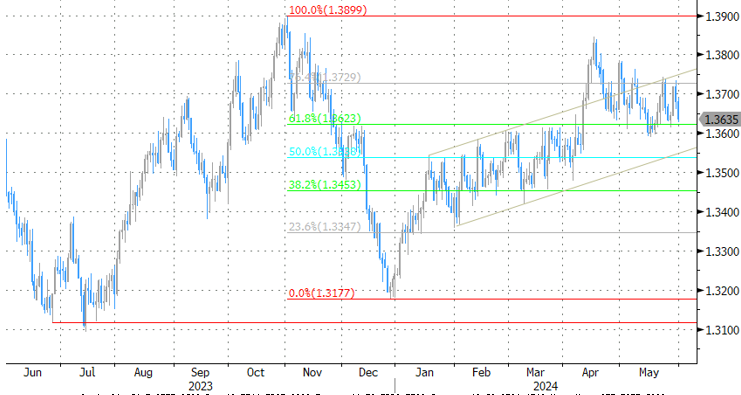
Canadian GDP expanded an annualized 1.7% in Q1. That’s less than the 2.2% expected and followed on a downwardly revised 0.1% in the previous quarter. Monthly GDP data showed growth concentrated in the first two months with March printing flat. Statistics Canada said higher household spending on services (1.1%, bringing total consumer spending to 0.7%) was the main contributor, followed by business capital investment (0.8%). Slower inventory accumulations moderated overall growth. The numbers are the final input to the Bank of Canada’s policy meeting last week. Along with sustained downward momentum in (core) CPI, which came in at a pace between 2.6 and 2.9% in April, the BoC is also focused on the balance between demand and supply in the economy. Consensus expects the central bank to cut rates a first time this cycle to 4.75%. Money markets have increased bets to 80%. USD/CAD declines today but mainly because of dollar weakness. The pair trades around 1.363.
Graphs
EUR/USD: relative inflation and yields divergence propels the euro near the 1.09 resistance area.
USD/CAD: loonie doesn’t decline on softer than expected Q1 growth data. Start of BoC easing cycle discounted?
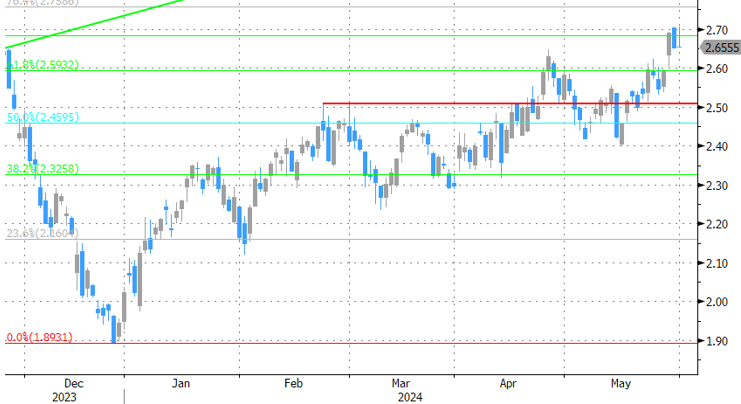
German 10-y yield trying to close the week north of the 2.65% previous YtD top.
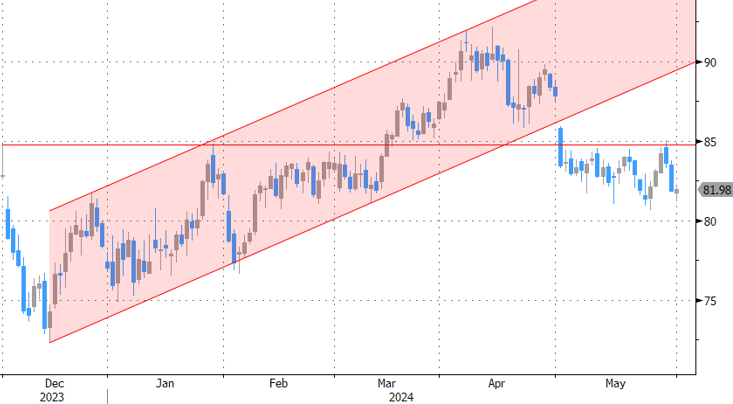
Brent oil struggles to avoid a drop below $ 80/82 p/b area going into this week’s OPEC+ meeting.
New Zealand Dollar Gains for Second Day Against US Dollar
The New Zealand dollar continues its ascent for the second consecutive session against the US dollar, resulting in the NZD/USD pair climbing to 0.6125. This increase is attributed to recent US economic data indicating slower-than-expected growth in Q1, suggesting the possibility of an interest rate cut by the end of the year.
The market is now focused on the upcoming release of the US Core Personal Consumption Expenditures (Core PCE) report, a pivotal inflation measure for the Federal Reserve. The report's outcome could offer further insights into the Fed's future actions.
Meanwhile, the New Zealand government has unveiled its annual budget report, which includes modest tax relief and spending cuts due to subdued economic growth. Other concerns for the economy include rising unemployment and a weak trade balance.
Today's speech by the Reserve Bank of New Zealand (RBNZ) Governor is highly anticipated, particularly following the central bank's recent policy meeting.
Technical analysis of NZD/USD
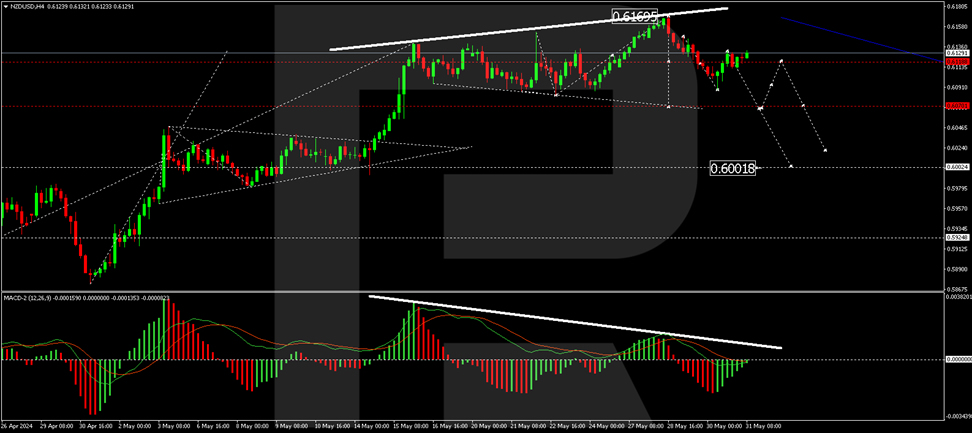
The NZD/USD pair is developing within a wide consolidation range around 0.6136. A downward impulse to 0.6088 has been observed. Today, the market might see a corrective move to 0.6137 (testing from below). Following this correction, a new decline to 0.6070 is anticipated, with a potential breakdown of this level leading to a further decrease to 0.6002. The bearish scenario is technically supported by the MACD indicator, whose signal line is below zero and directed downwards. Notably, there is a significant divergence between the peaks on the chart and the indicator, which traders should monitor closely.
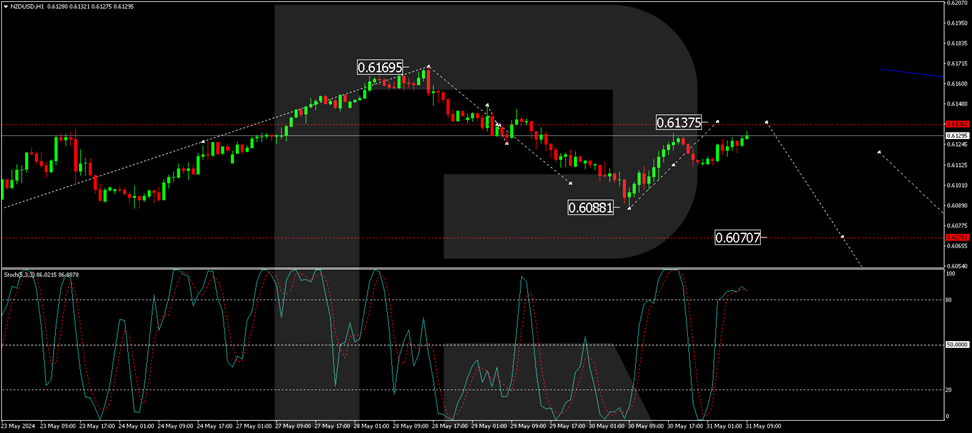
On the H1 chart, after forming a downward impulse to 0.6088, a correction to 0.6137 may occur today. Upon its completion, a new downward wave to 0.6075 is expected, with a potential continuation to 0.6000. This target is the first one in the expected downward trend. The technical setup is confirmed by the Stochastic oscillator, whose signal line is currently above 80 but is pointing sharply downwards, indicating the potential for a decline.
Summary
The NZD/USD pair's upward movement directly reflects recent US economic data and the market's expectations of potential Fed policy adjustments. Technical indicators suggest possible short-term corrections followed by further declines, providing critical levels for traders to watch as market conditions evolve. Today's speech by the RBNZ Governor could introduce volatility to the trading session, further impacting the currency's movement.
Canada’s Economic Growth Rebound Misses Expectations in the First Quarter
The Canadian economy grew by 1.7% quarter/quarter annualized (q/q) in 2024 Q1, while 2023 Q4 was revised lower (+0.1% q/q from +1.0%). Furthermore, the flash estimate for April showed a +0.3% monthly increase. Stripping out external factors, final domestic demand came in at a very strong 2.9% q/q.
Consumer spending supported growth, rising by +3.0% q/q. The growth was largely seen in services (+4.3% q/q), driven by primarily telecommunications services, rent and air transport. Consumer goods spending (+1.3% q/q) also supported growth, as demand for new trucks, vans and sport utility vehicles remained robust.
Business investment rebounded in the quarter (+3.1% q/q) on the back of greater housing activity (resale up 7.1% q/q) and further investment in structures/machinery/equipment in the oil & gas sector. This was only the second quarterly increase since 2022 Q1.
Net trade provided only a minor lift to GDP (adding 0.1 percentage point), after providing a huge offset in late 2023. The main driver of trade was "exports of unwrought gold, silver, and platinum group metals". This has unwound in the monthly data and shouldn't keep adding to growth going forward.
Of note, a big drawdown of inventories subtracted 1.5% from the quarterly GDP print.
Key Implications
The Canadian economy rebounded in the first quarter of 2024. Consumer spending has held up well on the back of strong population growth, which has been tracking +3% so far in 2024. And with major projects underway to support the green transition and improve Canada's export potential, the recovery in business investment was encouraging. Consequently, when we exclude external factors, the Canadian economy grew at its fastest quarterly pace in two years! Will this last? We don't expect it to. Sure, the flash estimate showed a decent improvement in April, but our tracking of consumer spending points to growth right around trend. This means that the acceleration in consumer spending since late last year appears to be petering out.
The Bank of Canada is set to meet next week, and markets are leaning towards a cut. As of writing, odds point to more than a 70% chance of a June cut, while a cut in July is fully priced. We have been arguing for months now that inflation dynamics have been justifying rate cuts, yet the BoC hasn't signaled any intention to make a move. This central bank has prided itself on communicating its intentions to make changes to monetary policy ahead of an actual move. If it wants to keep up this effort of transparency and forward guidance, we expect the BoC will hold rates steady next week and use the meeting to tee-up a rate cut in July. That said, expect fireworks as the BoC could go either way with this one.
U.S. Consumer Spending and Income Slow in April
Personal income slowed to 0.3% month-on-month (m/m) in April, down from March's 0.5% gain, but in line with market expectations .
Accounting for inflation and taxes, real personal disposable income declined -0.1% m/m in April, reversing all of last month's gain.
Personal consumption expenditures rose by 0.2% m/m. This is lower than the revised 0.7% recorded in March (0.8% previously), and also below market expectations (0.3%). Spending in real terms slid by -0.1% m/m – a pullback from 0.4% growth in March. The decline in real spending reflected declines in both goods (-0.4%) and services (-0.5%) outlays.
On inflation, the Fed's preferred inflation metric, the core PCE price deflator, decelerated on a monthly basis, and held steady annually. The measure fell from 0.3% to 0.2% month-over-month and remained at 2.8% annually. While the annual reading was in line with market expectations, the monthly number came in marginally lower than expected (0.3%).
The personal savings rate remained at 3.6% for the second consecutive month.
Key Implications
The downward revision to Q1 consumer spending and lackluster start to Q2 add to the collection of evidence pointing to a slowing U.S. economy. Expectations that labor demand will continue to soften combined with decelerating wage growth should also exert further downward pressure. As such, consumer spending, while not grinding to a halt, is expected to continue losing some momentum as the year progresses.
Given the break in upside inflation surprises with April's CPI report, market participants were hopeful that the Fed's preferred inflation gauge, would also post some good news. Today's core PCE deflator delivered on that front. The monthly figure cooled, and the 3-month annualized change decelerated for the first time in four months (from 4.4% to 3.5%). While April's inflation numbers are headed in the right direction once again, Fed governors are likely to continue their exercise in patience, with the first rate cut occurring closer to the end of the year.
USD/JPY Mid-Day Outlook
Daily Pivots: (S1) 156.23; (P) 156.96; (R1) 157.54; More...
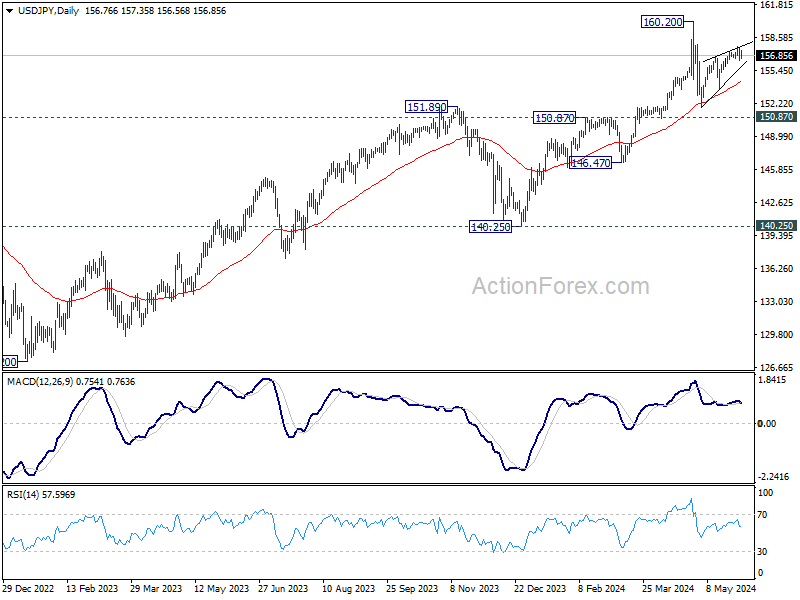
Intraday bias in USD/JPY remains neutral first. Decisive break of 156.36 will confirm short term topping at 157.70, on bearish divergence condition in 4 H MACD. Intraday bias will be back on the downside for 153.59 support. Firm break there will target 151.86 and below as the third leg of the corrective pattern from 160.20.
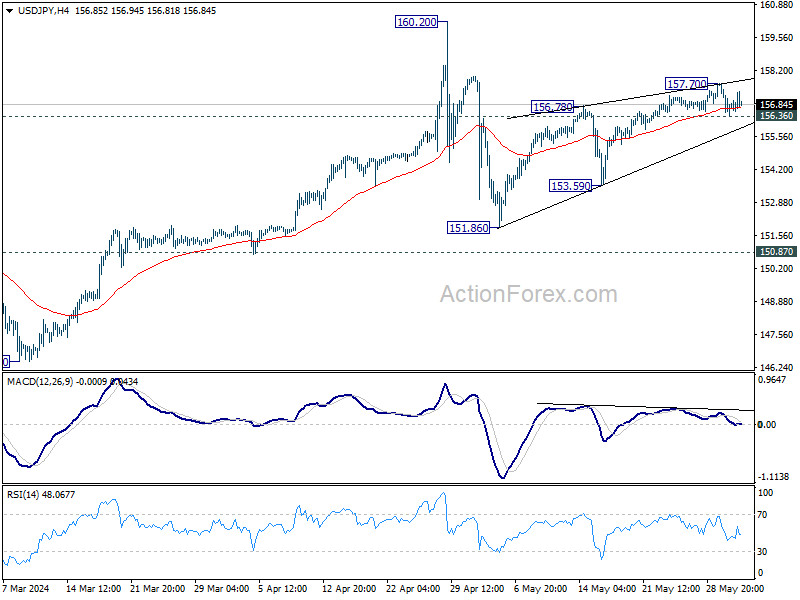
In the bigger picture, a medium term top might be formed at 160.20. But as long as 150.87 resistance turned support holds, fall from there is seen as correcting rise from 150.25 only. However, decisive break of 150.87 will argue that larger correction is possibly underway, and target 146.47 support next.
USD/CHF Mid-Day Outlook
Daily Pivots: (S1) 0.8995; (P) 0.9070; (R1) 0.9110; More....
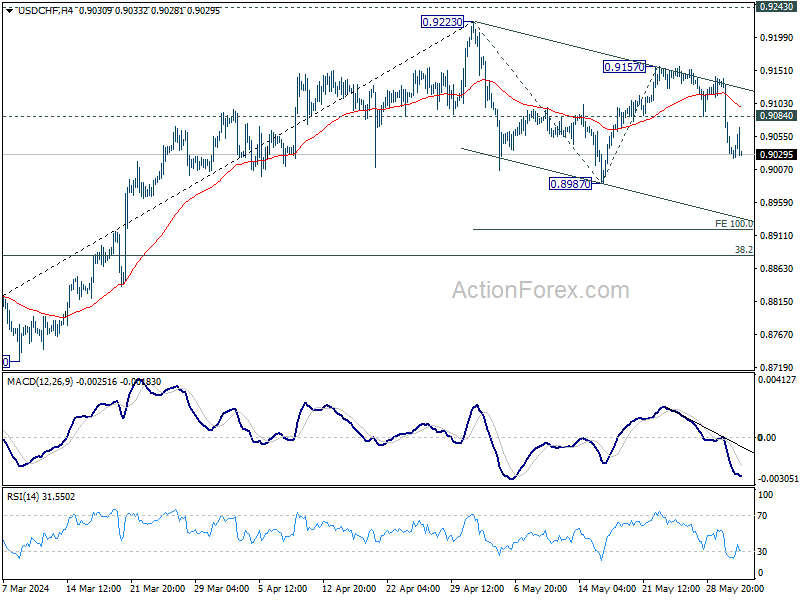
Intraday bias in USD/CHF remains on the downside for the moment. Fall from 0.9157 is seen as the third leg of the pattern from 0.9223. Deeper fall would be seen to 0.8987 support. Break will target 100% projection of 0.9223 to 0.8987 from 0.9157 at 0.8921. On the upside, above 0.8904 minor resistance will turn intraday bias neutral first.
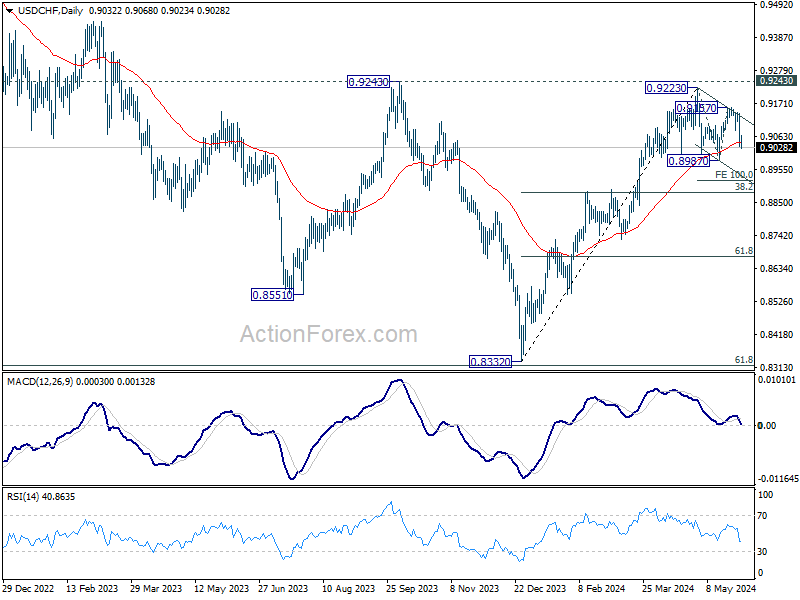
In the bigger picture, price actions from 0.8332 medium term bottom are tentatively seen as developing into a corrective pattern to the down trend from 1.0146 (2022 high). Rejection by 0.9243 resistance, followed by sustained break of 38.2% retracement of 0.8332 to 0.9223 at 0.8883 will strengthen this case, and maintain medium term bearishness. However, decisive break of 0.9243 will argue that the trend has already reversed and turn medium term outlook bullish for 1.0146.
GBP/USD Mid-Day Outlook
Daily Pivots: (S1) 1.2693; (P) 1.2721; (R1) 1.2760; More...
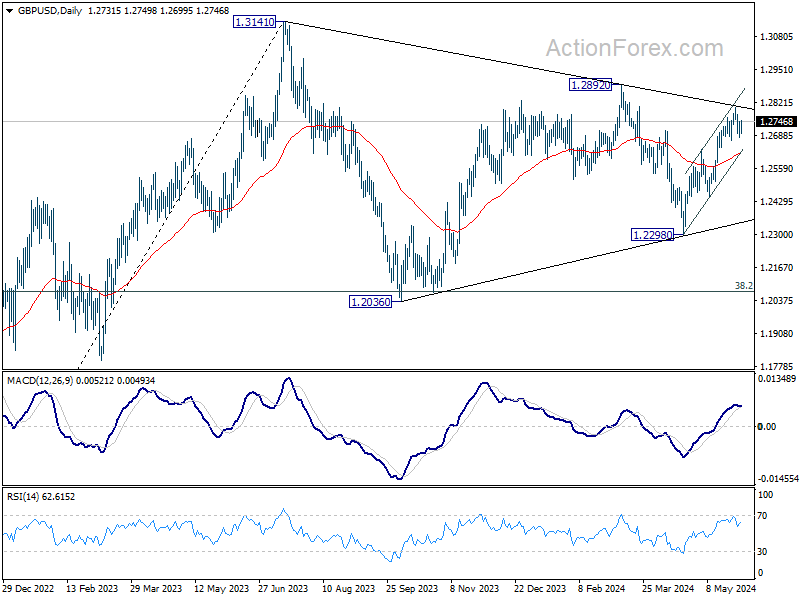
GBP/USD is still bounded in range below 1.2799 and intraday bias remains neutral for the moment. Further rise is expected as long as 1.2670 support holds. Above 1.2799 will resume the rally from 1.2298 and target 1.2892 resistance. However, break of 1.2670 will indicate short term topping, and turn bias back to the downside for deeper pullback.
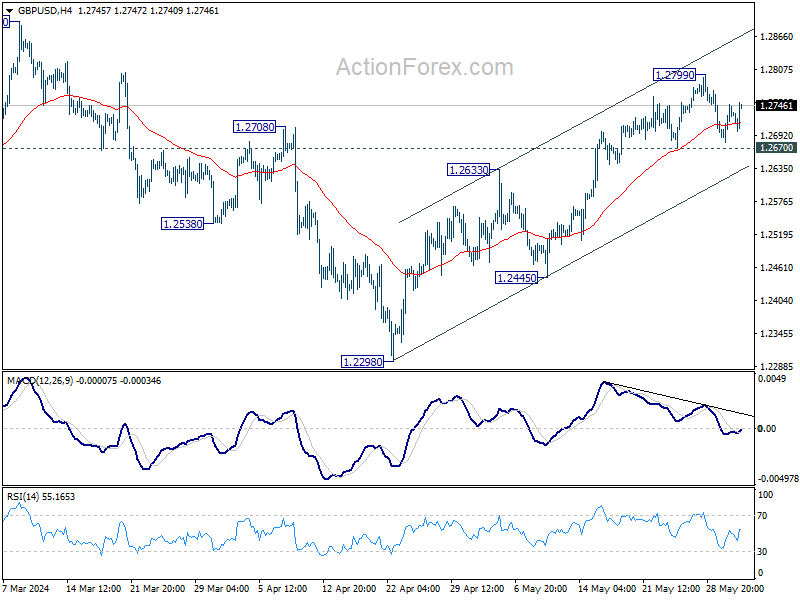
In the bigger picture, price actions from 1.3141 medium term top are seen as a corrective pattern. Fall from 1.2892 is seen as the third leg which might have completed already. Break of 1.2892 resistance will argue that larger up trend from 1.0351(2022 low) is ready to resume through 1.3141. Meanwhile, break of 1.2445 support will extend the corrective pattern with another decline instead.
EUR/USD Mid-Day Outlook
Daily Pivots: (S1) 1.0798; (P) 1.0822; (R1) 1.0855; More....
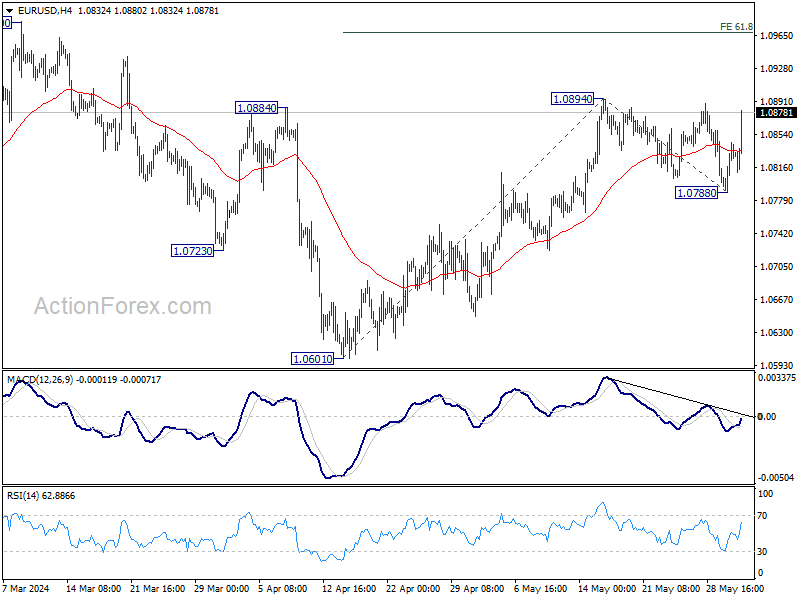
Focus is now on 1.0894 in EUR/USD with today's strong bounce. Firm break there will resume whole rally from 1.0601, and target 61.8% projection of 1.0601 to 1.0894 from 1.0788 at 1.0969. For now, risk will stay on the upside as long as 1.0788 support holds, in case of retreat.
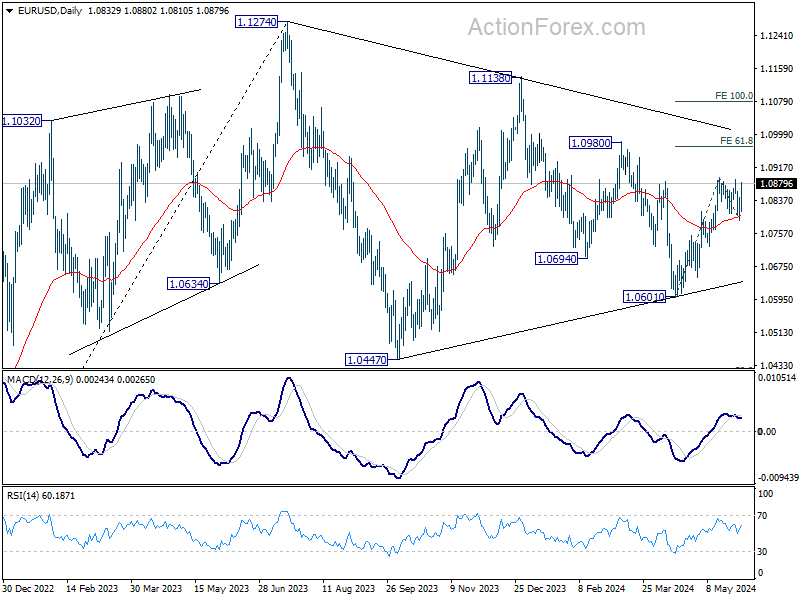
In the bigger picture, price actions from 1.1274 are viewed as a corrective pattern. Fall from 1.1138 is seen as the third leg and could have completed. Firm break of 1.1138 will argue that larger up trend from 0.9534 (2022 low) is ready to resume through 1.1274 high. On the downside, break of 1.0601 will extend the corrective pattern instead.
Euro Rallies on Inflation Surprise, US PCE Data Bolsters Stocks
Euro surges broadly today after Eurozone inflation data showed larger than expected re-acceleration in May. While this increase doesn't shift the consensus that ECB will proceed with a rate cut next week, it significantly dampens any remaining expectations for a subsequent cut in July. Market speculation now leans towards the possibility of only two ECB rate cuts this year, rather than the previously anticipated three.
Amidst these developments, Euro's rally is overshadowed by stronger performances from New Zealand Dollar and Australian Dollar, driven by a robust rebound in risk markets following the release of US. PCE inflation data. The data revealed that both headline and core inflation annual rates remained stable, aligning with forecasts. However, it was the slightly lower-than-expected monthly increase in core PCE that ignited a positive response from the markets, prompting a jump in US futures and a corresponding decline in the 10-year yield.
For the week, the Swiss Franc holds its position as the strongest currency, followed by Aussie and then Kiwi. On the other end of the spectrum, British Pound has emerged as the weakest, with Japanese Yen and US. Dollar also underperforming. Canadian Dollar and Euro are positioning in the middle.
In Europe, at the time of writing, FTSE is up 0.64%. DAX is up 0.13%. CAC is up 0.14%. UK 10-year yield is down -0.009 at 4.342. Germany 10-year yield is up 0.014 at 2.667. Earlier in Asia, Nikkei rose 1.14%. Hong Kong HSI fell -0.83%. China Shanghai SSE fell -0.16%. Singapore Strait Times rose 0.40%. Japan 10-year JGB yield rose 0.0149 to 1.075.
US PCE unchanged at 2.7% yoy in Apr, core PCE steady at 2.8% yoy
US PCE price index rose 0.3% mom in April, matched expectations. Core PCE price index (excluding food and energy) rose 0.2% mom, below expectation of 0.3% mom. Prices for goods increased 0.2% mom, and prices for services increased 0.3% mom. Food prices decreased -0.2 mom and energy prices increased 1.2% mom.
Annually, PCE price index was unchanged at 2.7% yoy. Core PCE price index was unchanged at 2.8% yoy. Both matched expectations. Prices for goods increased 0.1% yoy and prices for services increased 3.9% yoy. Food prices increased 1.3% yoy and energy prices increased 3.0% yoy.
Personal income rose 0.3% mom or USD 65.3B, matched expectations. Personal spending rose 0.2% mom or USD 39.1B, below expectation of 0.3% mom.
Canada's GDP flat in Mar, up 0.4% qoq in Q1
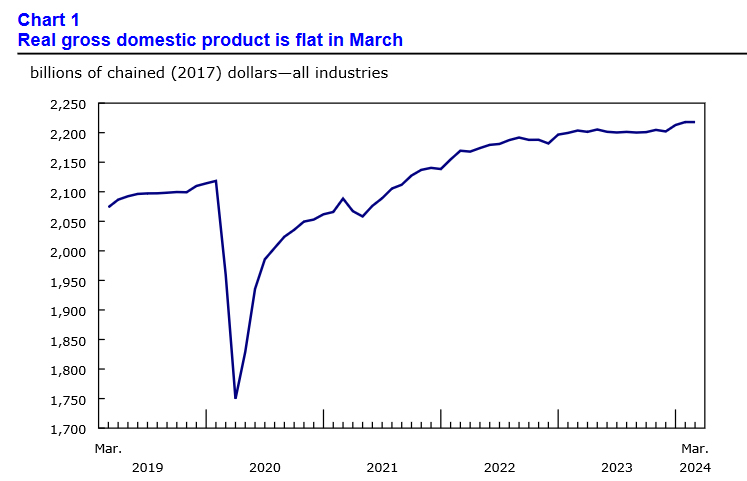
Canada's GDP was essentially unchanged in March, matched expectations. Both goods-producing and services-producing industries were essentially unchanged. Overall, 11 of 20 sectors increased in the month.
Advance estimate suggests that GDP rose 0.3% mom in April. Increases in manufacturing, mining, quarrying, and oil and gas extraction and wholesale trade were partially offset by decreases in utilities.
In Q1, GDP increased 0.4% qoq, Higher household spending on services was the top contributor to the increase in GDP, while slower inventory accumulations moderated overall growth.
Eurozone CPI rises to 2.6% in May, CPI core up to 2.9%
Eurozone CPI accelerated from 2.4% yoy to 2.6% yoy in May, above expectation of 2.5% yoy. CPI core (ex-energy, food, alcohol & tobacco) also jumped from 2.7% yoy to 2.9% yoy, above expectation of 2.7% yoy.
Looking at the main components, services is expected to have the highest annual rate in May (4.1%, compared with 3.7% in April), followed by food, alcohol & tobacco (2.6%, compared with 2.8% in April), non-energy industrial goods (0.8%, compared with 0.9% in April) and energy (0.3%, compared with -0.6% in April).
ECB's Panetta advocates for prompt and gradual policy adjustments
ECB Governing Council member Fabio Panetta suggested today that even multiple rate cuts would leave ECB's monetary policy in a tight stance. Panetta emphasized the importance of managing these adjustments carefully to avoid macroeconomic instability, stating, "When defining the path of policy rate cuts, it should be borne in mind that prompt and gradual action contains macroeconomic volatility better than a tardy and hasty approach."
Panetta clarified that the anticipated rate cuts should not be seen as economic "stimulus" but rather as necessary adjustments to prevent the monetary policy from becoming "excessively tight" which might otherwise risk an inflation undershoot.
"Over the coming months, if the incoming data is consistent with the current projections, it will be appropriate to ease monetary conditions," he said. "This will not stop the action to restore price stability."
Reacting to today's release of Eurozone inflation data, Panetta described the figures as "neither good nor bad."
Japan's Tokyo CPI core rises in May, industrial production weakens in Apr
In May, Japan's Tokyo CPI core (excluding fresh food) increased from 1.6% yoy to 1.9% yoy, matching expectations. This rise was primarily driven by higher electricity costs. However, CPI core-core (excluding food and energy) slowed slightly from 1.8% yoy to 1.7% yoy. Private sector service inflation also decreased from 1.6% yoy to 1.4% yoy. The headline CPI saw an uptick from 1.8% yoy to 2.2% yoy.
April's industrial production declined by -0.1% mom, falling short of the anticipated 1.5% mom rise. The Ministry of Economy, Trade, and Industry maintained its assessment that industrial production "showed weakness while fluctuating indecisively." Among the 15 industrial sectors surveyed, seven reported lower output, while eight saw increases. Manufacturers expect output to rise by 6.9% in May before falling by -5.6% in June.
Additionally, April's retail sales jumped by 2.4% yoy, surpassing the expected 1.9% increase. Unemployment rate remained steady at 2.6%.
China's manufacturing PMI falls back into contraction in May
China's official PMI Manufacturing index fell from 50.4 to 49.5 in May, below the expected 50.5, indicating contraction after two months of expansion. The new manufacturing export order subindex also dropped significantly to 47.2 from 50.6 in April, highlighting weakening external demand.
PMI Non-Manufacturing index ticked down slightly from 51.2 to 51.1, missing the expectation of 51.5. Within this sector, the construction new order subindex decreased to 44.1 from 45.3, and the service sector business activity subindex declined to 47.4 from 50.3, showing reduced activity.
PMI Composite, which combines manufacturing and non-manufacturing data, fell from 51.7 to 51.0, indicating a slowdown in overall economic activity.
EUR/USD Mid-Day Outlook
Daily Pivots: (S1) 1.0798; (P) 1.0822; (R1) 1.0855; More....
Focus is now on 1.0894 in EUR/USD with today's strong bounce. Firm break there will resume whole rally from 1.0601, and target 61.8% projection of 1.0601 to 1.0894 from 1.0788 at 1.0969. For now, risk will stay on the upside as long as 1.0788 support holds, in case of retreat.
In the bigger picture, price actions from 1.1274 are viewed as a corrective pattern. Fall from 1.1138 is seen as the third leg and could have completed. Firm break of 1.1138 will argue that larger up trend from 0.9534 (2022 low) is ready to resume through 1.1274 high. On the downside, break of 1.0601 will extend the corrective pattern instead.
Economic Indicators Update
| GMT | Ccy | Events | Actual | Forecast | Previous | Revised |
|---|---|---|---|---|---|---|
| 23:30 | JPY | Tokyo CPI Y/Y May | 2.20% | 1.80% | ||
| 23:30 | JPY | Tokyo CPI ex Fresh Food Y/Y May | 1.90% | 1.90% | 1.60% | |
| 23:30 | JPY | Tokyo CPI ex Food & Energy Y/Y May | 1.70% | 1.80% | ||
| 23:30 | JPY | Unemployment Rate Apr | 2.60% | 2.60% | 2.60% | |
| 23:50 | JPY | Industrial Production M/M Apr P | -0.10% | 1.50% | 4.40% | |
| 23:50 | JPY | Retail Trade Y/Y Apr | 2.40% | 1.90% | 1.20% | 1.10% |
| 01:30 | AUD | Private Sector Credit M/M Apr | 0.50% | 0.40% | 0.30% | 0.40% |
| 01:30 | CNY | NBS Manufacturing PMI May | 49.5 | 50.5 | 50.4 | |
| 01:30 | CNY | NBS Non-Manufacturing PMI May | 51.1 | 51.5 | 51.2 | |
| 05:00 | JPY | Housing Starts Y/Y Apr | 13.90% | -0.20% | -12.80% | |
| 06:00 | EUR | Germany Import Price M/M Apr | 0.70% | 0.50% | 0.40% | |
| 06:00 | EUR | Germany Retail Sales M/M Apr | -1.20% | 0.10% | 1.80% | 2.60% |
| 06:30 | CHF | Real Retail Sales Y/Y Apr | 2.70% | 0.20% | -0.10% | -0.20% |
| 06:45 | EUR | France GDP Q/Q Q1 | 0.20% | 0.20% | 0.20% | |
| 08:30 | GBP | Mortgage Approvals Apr | 61K | 62K | 61K | |
| 08:30 | GBP | M4 Money Supply M/M Apr | 0.10% | 0.40% | 0.70% | |
| 09:00 | EUR | Eurozone CPI Y/Y May P | 2.60% | 2.50% | 2.40% | |
| 09:00 | EUR | Eurozone CPI Core Y/Y May P | 2.90% | 2.70% | 2.70% | |
| 12:30 | CAD | GDP M/M Mar | 0.00% | 0.00% | 0.20% | |
| 12:30 | USD | Personal Income M/M Apr | 0.30% | 0.30% | 0.50% | |
| 12:30 | USD | Personal Spending Apr | 0.20% | 0.30% | 0.80% | 0.70% |
| 12:30 | USD | PCE Price Index M/M Apr | 0.30% | 0.30% | 0.30% | |
| 12:30 | USD | PCE Price Index Y/Y Apr | 2.70% | 2.70% | 2.70% | |
| 12:30 | USD | Core PCE Price Index M/M Apr | 0.20% | 0.30% | 0.30% | |
| 12:30 | USD | Core PCE Price Index Y/Y Apr | 2.80% | 2.80% | 2.80% | |
| 13:45 | USD | Chicago PMI May | 40 | 37.9 |
Canada’s GDP flat in Mar, up 0.4% qoq in Q1
Canada's GDP was essentially unchanged in March, matched expectations. Both goods-producing and services-producing industries were essentially unchanged. Overall, 11 of 20 sectors increased in the month.
Advance estimate suggests that GDP rose 0.3% mom in April. Increases in manufacturing, mining, quarrying, and oil and gas extraction and wholesale trade were partially offset by decreases in utilities.
In Q1, GDP increased 0.4% qoq, Higher household spending on services was the top contributor to the increase in GDP, while slower inventory accumulations moderated overall growth.