Sample Category Title
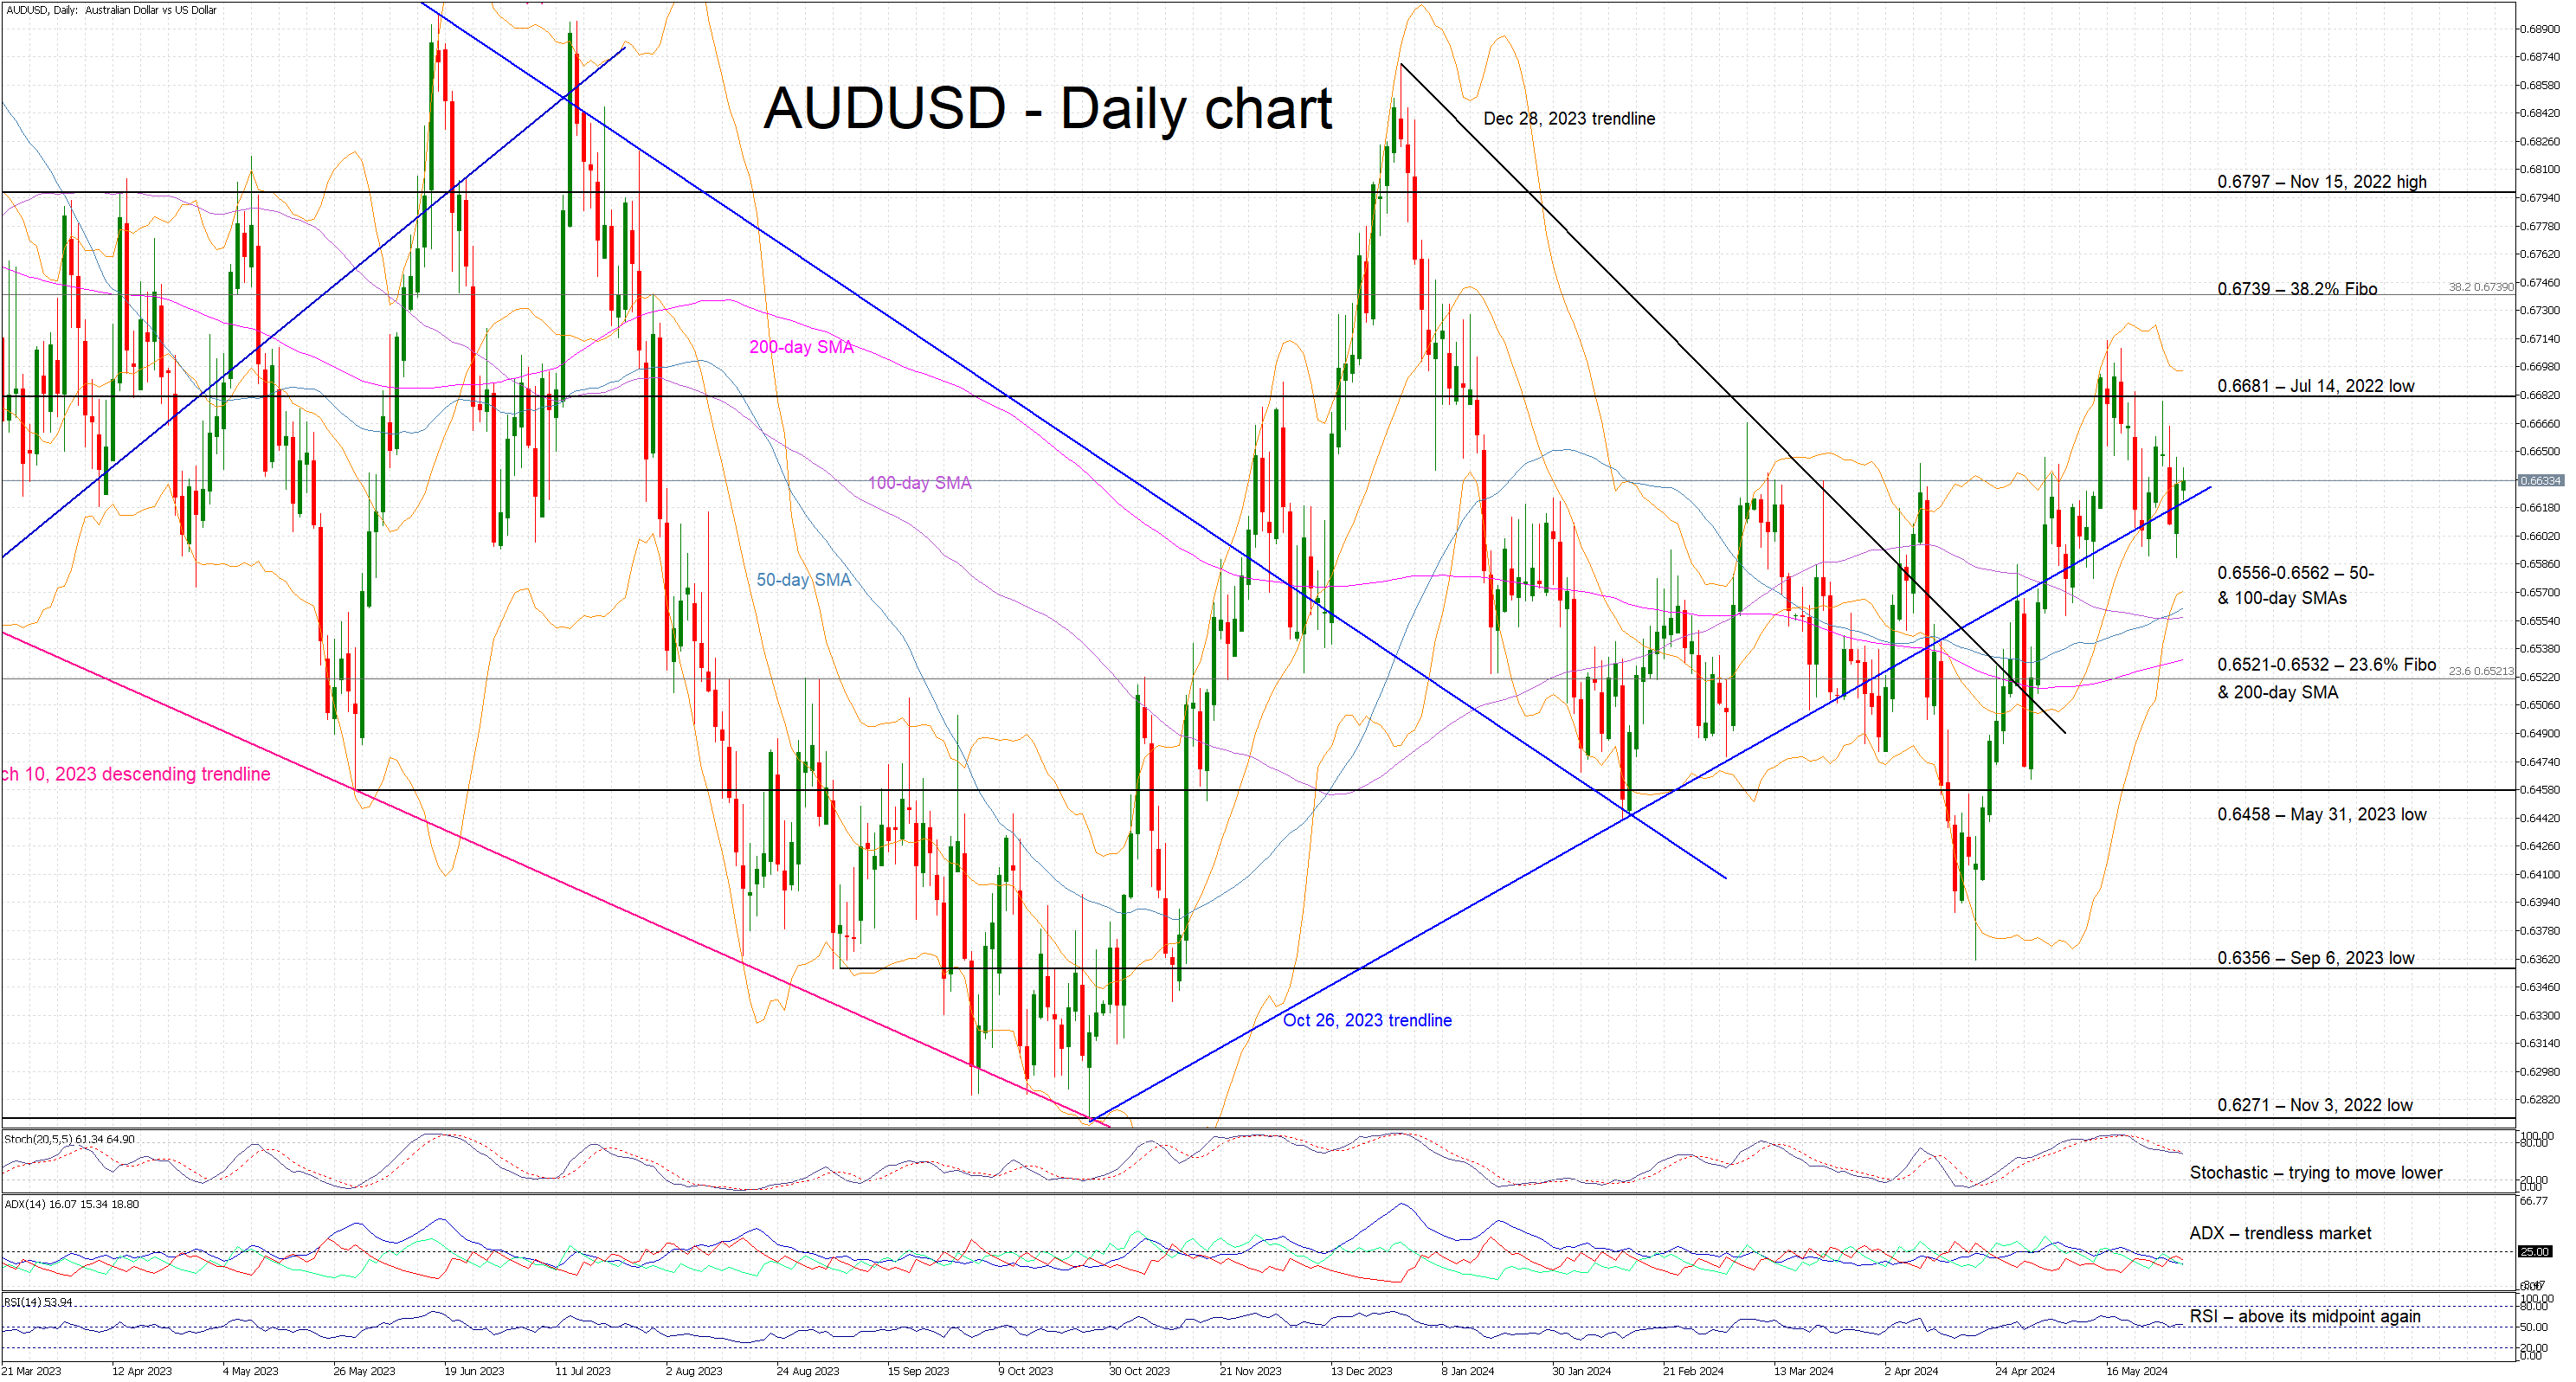
US PCE unchanged at 2.7% yoy in Apr, core PCE steady at 2.8% yoy
US PCE price index rose 0.3% mom in April, matched expectations. Core PCE price index (excluding food and energy) rose 0.2% mom, below expectation of 0.3% mom. Prices for goods increased 0.2% mom, and prices for services increased 0.3% mom. Food prices decreased -0.2 mom and energy prices increased 1.2% mom.
Annually, PCE price index was unchanged at 2.7% yoy. Core PCE price index was unchanged at 2.8% yoy. Both matched expectations. Prices for goods increased 0.1% yoy and prices for services increased 3.9% yoy. Food prices increased 1.3% yoy and energy prices increased 3.0% yoy.
Personal income rose 0.3% mom or USD 65.3B, matched expectations. Personal spending rose 0.2% mom or USD 39.1B, below expectation of 0.3% mom.
ECB’s Panetta advocates for prompt and gradual policy adjustments
ECB Governing Council member Fabio Panetta suggested today that even multiple rate cuts would leave ECB's monetary policy in a tight stance. Panetta emphasized the importance of managing these adjustments carefully to avoid macroeconomic instability, stating, "When defining the path of policy rate cuts, it should be borne in mind that prompt and gradual action contains macroeconomic volatility better than a tardy and hasty approach."
Panetta clarified that the anticipated rate cuts should not be seen as economic "stimulus" but rather as necessary adjustments to prevent the monetary policy from becoming "excessively tight" which might otherwise risk an inflation undershoot.
"Over the coming months, if the incoming data is consistent with the current projections, it will be appropriate to ease monetary conditions," he said. "This will not stop the action to restore price stability."
Reacting to today's release of Eurozone inflation data, Panetta described the figures as "neither good nor bad."
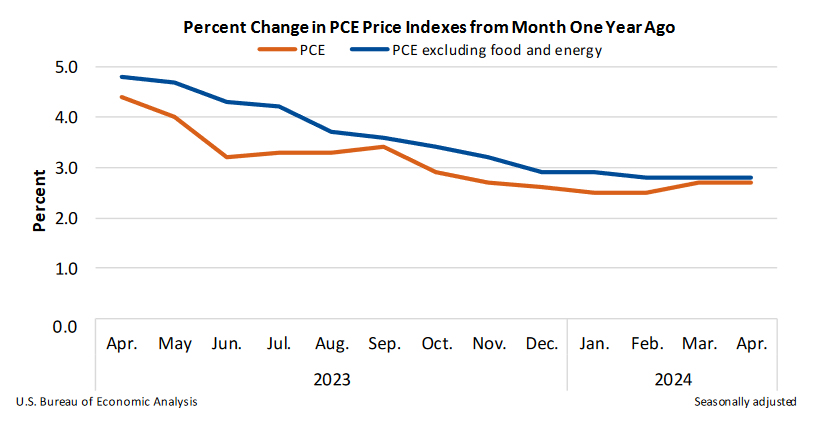
USD/CHF Rate Falls Over 1% After SNB Chief’s Statements
As evidenced by the USD/CHF chart, yesterday one US dollar was worth 0.913 Swiss francs, but today it is already 0.903, indicating a rate drop of approximately 1%.
According to MT Newswires, the franc's strengthening is attributed to statements by Swiss National Bank (SNB) President Thomas Jordan. In his view, an overly weak franc is the most likely source of higher inflation in Switzerland.
Notably, since the beginning of 2024, the Swiss franc has weakened against the US dollar by more than 7%, one of the worst performances among G10 currencies. The exchange rate has formed an ascending trend channel (indicated in blue).
Today's USD/CHF chart shows two important resistance lines:
→ The 0.913 level – the price could not consolidate above this level despite several attempts;
→ The median line of the channel.
On May 22, a downward reversal occurred from this resistance block (indicated by an arrow), and today the USD/CHF price is near the lower boundary of the channel.
Bullish arguments:
→ Near the lower boundary of the channel, demand may increase;
→ The psychological level of 0.9 CHF per 1 USD may provide support – this has occurred several times during the spring.
It is likely that the SNB does not want the upward trend to continue, and if so, in the near future, we might see a consolidation in the USD/CHF market within the range of 0.900 – 0.913, until significant fundamental news emerges to disrupt the balance that has been forming since April.
Trade over 50 forex markets 24 hours a day with FXOpen. Take advantage of low commissions, deep liquidity, and spreads from 0.0 pips. Open your FXOpen account now or learn more about trading forex with FXOpen.
This article represents the opinion of the Companies operating under the FXOpen brand only. It is not to be construed as an offer, solicitation, or recommendation with respect to products and services provided by the Companies operating under the FXOpen brand, nor is it to be considered financial advice.
Canadian Dollar Eyes Canadian GDP
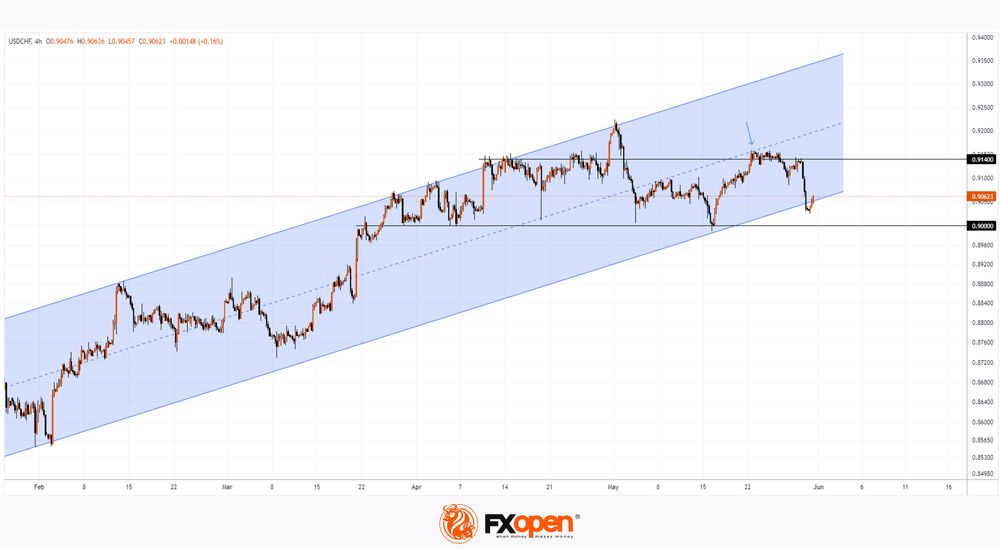
The Canadian dollar is showing little movement on Friday, but that could change with the release of Canadian GDP and the US PCE Price index later today. USD/CAD is trading at 1.3660 in the European session, down 0.15% on the day.
Canada’s economy expected to have flatlined in March
Canada’s economy is expected to have remained unchanged in March, after a weak gain in February of just 0.2% m/m, which was less than expected. The year started out on a high note, as the economy climbed 0.6% m/m in January, but since then the economy has looked sluggish. On an annualized basis, first-quarter GDP is expected to have expanded by 2.2%, compared to 1% in the fourth quarter of 2023.
If today’s GDP report misses expectations, it will put more pressure on the Bank of Canada to lower rates at next week’s meeting. The Bank of Canada has held rates at 5% for six straight times, and restless consumers are looking for some rate relief as they continue to feel the squeeze of elevated rates and the high cost of inflation. The conditions appear to be right for a rate cut, as the economic slowdown has been accompanied by falling inflation.
In April, CPI dropped to 2.7%, down from 2.9% a month earlier. With the headline and core rates below 3%, a rate cut is possible even with inflation above the BoC’s 2% target.
In the US, the Personal Consumption Expenditure Price Index, which is closely watched the Federal Reserve, is expected to remain unchanged at 2.7% y/y and 0.3% m/m, respectively. An unexpected reading could shake up USD/CAD in the North American session.
USD/CAD Technical
- USD/CAD is putting pressure on support at 1.3650. Below, there is support at 1.3617
- 1.3692 and 1.3725 are the next resistance lines
Eurozone CPI rises to 2.6% in May, CPI core up to 2.9%
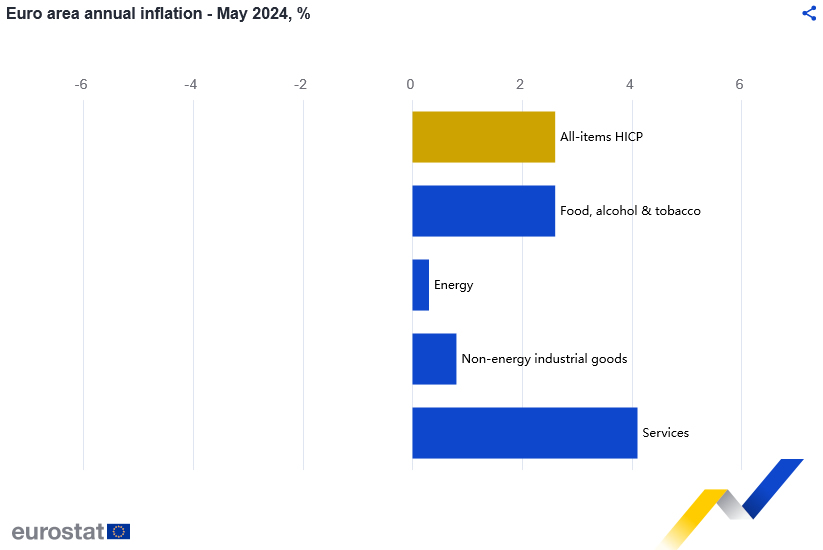
Eurozone CPI accelerated from 2.4% yoy to 2.6% yoy in May, above expectation of 2.5% yoy. CPI core (ex-energy, food, alcohol & tobacco) also jumped from 2.7% yoy to 2.9% yoy, above expectation of 2.7% yoy.
Looking at the main components, services is expected to have the highest annual rate in May (4.1%, compared with 3.7% in April), followed by food, alcohol & tobacco (2.6%, compared with 2.8% in April), non-energy industrial goods (0.8%, compared with 0.9% in April) and energy (0.3%, compared with -0.6% in April).
GBP/USD Dips While USD/CAD Eyes More Gains
GBP/USD is attempting a recovery wave from 1.2680. USD/CAD is rising and might aim for a move above the 1.3690 resistance zone.
Important Takeaways for GBP/USD and USD/CAD Analysis Today
- The British Pound started a fresh decline from the 1.2800 resistance zone.
- There is a key bearish trend line forming with resistance near 1.2740 on the hourly chart of GBP/USD at FXOpen.
- USD/CAD is showing positive signs above the 1.3660 support zone.
- There is a connecting bearish trend line forming with resistance near 1.3690 on the hourly chart at FXOpen.
GBP/USD Technical Analysis
On the hourly chart of GBP/USD at FXOpen, the pair started a fresh decline from the 1.2800 zone after a decent increase, as mentioned in the previous analysis. The British Pound traded below the 1.2740 support to again move into a short-term bearish zone against the US Dollar.
The pair even traded below 1.2710 and the 50-hour simple moving average. Finally, the bulls appeared near the 1.2680 level. A low was formed near 1.2680 and the pair is now attempting a short-term recovery wave.
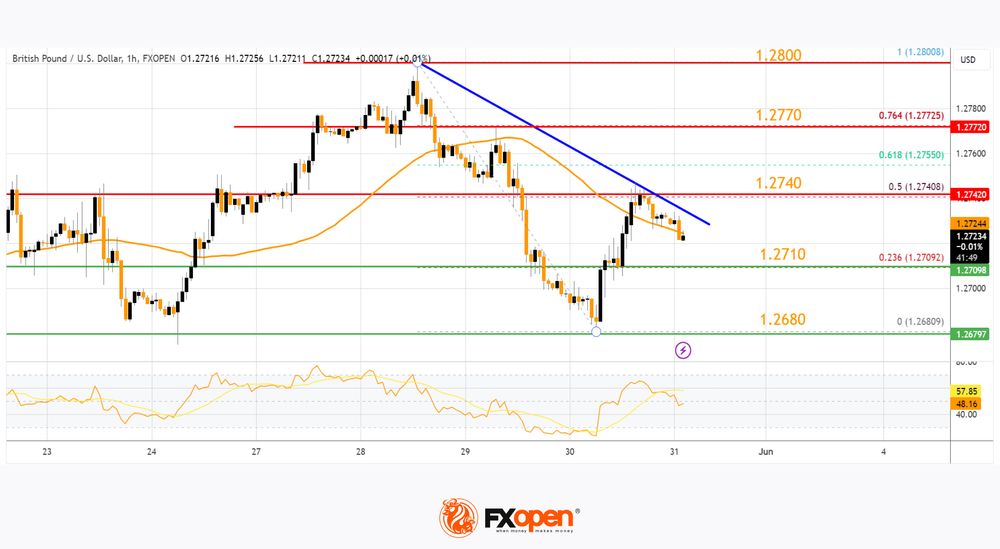
There was a fresh upside above the 1.2710 level. The pair climbed above the 23.6% Fib retracement level of the downward move from the 1.2800 swing high to the 1.2680 low.
Immediate resistance on the upside is near the 50% Fib retracement level of the downward move from the 1.2800 swing high to the 1.2680 low at 1.2740 and the 50-hour simple moving average. There is also a key bearish trend line forming with resistance near 1.2740.
The first major resistance on the GBP/USD chart is near the 1.2770 level. A close above the 1.2770 resistance might spark a decent increase. The next major resistance is near the 1.2800 level. Any more gains could lead the pair toward the 1.2880 resistance in the near term.
Initial support sits near 1.2710. The next major support sits at 1.2680, below which there is a risk of another sharp decline. In the stated case, the pair could drop toward 1.2620.
USD/CAD Technical Analysis
On the hourly chart of USD/CAD at FXOpen, the pair formed a strong support base above the 1.3600 level. The US Dollar started a fresh increase above the 1.3660 resistance against the Canadian Dollar.
The pair cleared the 50-hour simple moving average and climbed above 1.3700. Finally, it tested the 1.3735 zone before there was a downside correction. The pair traded below the 1.3700 support zone. There was a move below the 50% Fib retracement level of the upward move from the 1.3615 swing low to the 1.3734 high.
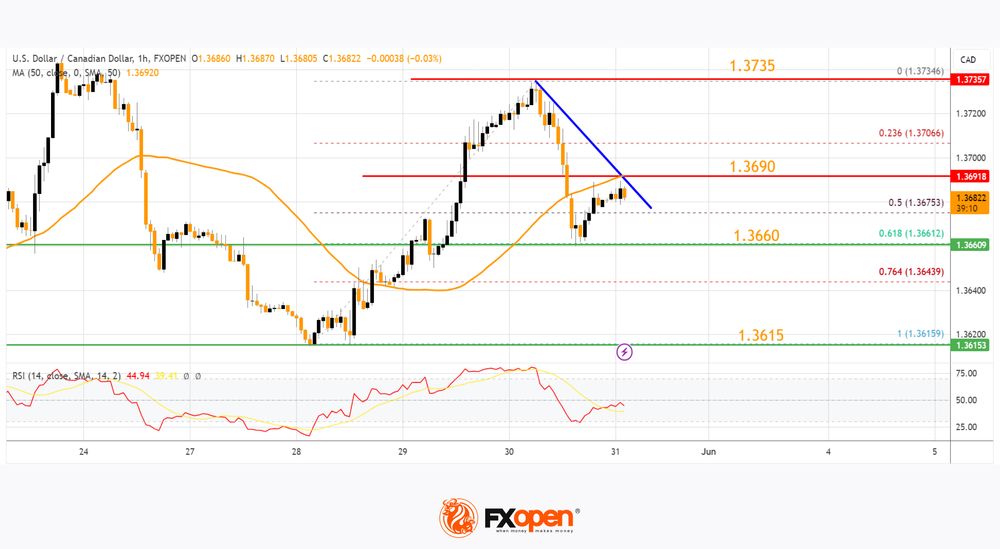
It tested the 1.3660 support zone and the 61.8% Fib retracement level of the upward move from the 1.3615 swing low to the 1.3734 high. The pair is again rising above the 1.3675 level.
Initial resistance sits near the 1.3690 level and the 50-hour simple moving average. There is also a connecting bearish trend line forming with resistance near 1.3690. A clear upside break above 1.3690 could start another steady increase.
The next major resistance is the 1.3735 level. A close above the 1.3735 level might send the pair toward the 1.3800 level. Any more gains could open the doors for a test of the 1.3850 level.
Conversely, the pair could start another decline. Initial support is near the 1.3660 level on the same USD/CAD chart. The next major support is near 1.3615. A downside break below the 1.3615 level could push the pair further lower. The next major support is near the 1.3550 support zone, below which the pair might visit 1.3500.
Trade over 50 forex markets 24 hours a day with FXOpen. Take advantage of low commissions, deep liquidity, and spreads from 0.0 pips. Open your FXOpen account now or learn more about trading forex with FXOpen.
This article represents the opinion of the Companies operating under the FXOpen brand only. It is not to be construed as an offer, solicitation, or recommendation with respect to products and services provided by the Companies operating under the FXOpen brand, nor is it to be considered financial advice.
Gold: Looking Good for Bulls
Gold (XAUUSD) has rebounded, trading in the $2,340s on Thursday, due to a weaker US Dollar following the second estimate of US GDP data, which was revised down because of reduced consumer spending. The annualized US GDP growth for Q1 was adjusted to 1.3% from an initial estimate of 1.6%, below Q4's 3.4% but matching analysts' expectations, leading to a decline in US Treasury yields that positively impacts Gold. This GDP revision implies the US economy is weaker than previously thought, potentially signaling lower inflation and encouraging the Federal Reserve to reduce interest rates, benefiting Gold by lowering its holding costs. However, Gold faces pressure due to statements from Fed officials suggesting interest rates will remain elevated and higher-than-anticipated inflation figures in Europe. Specifically, inflation in Germany and Spain exceeded expectations, decreasing the likelihood that the European Central Bank will continue with further rate cuts following their anticipated June reduction.
XAUUSD – D1 Timeframe
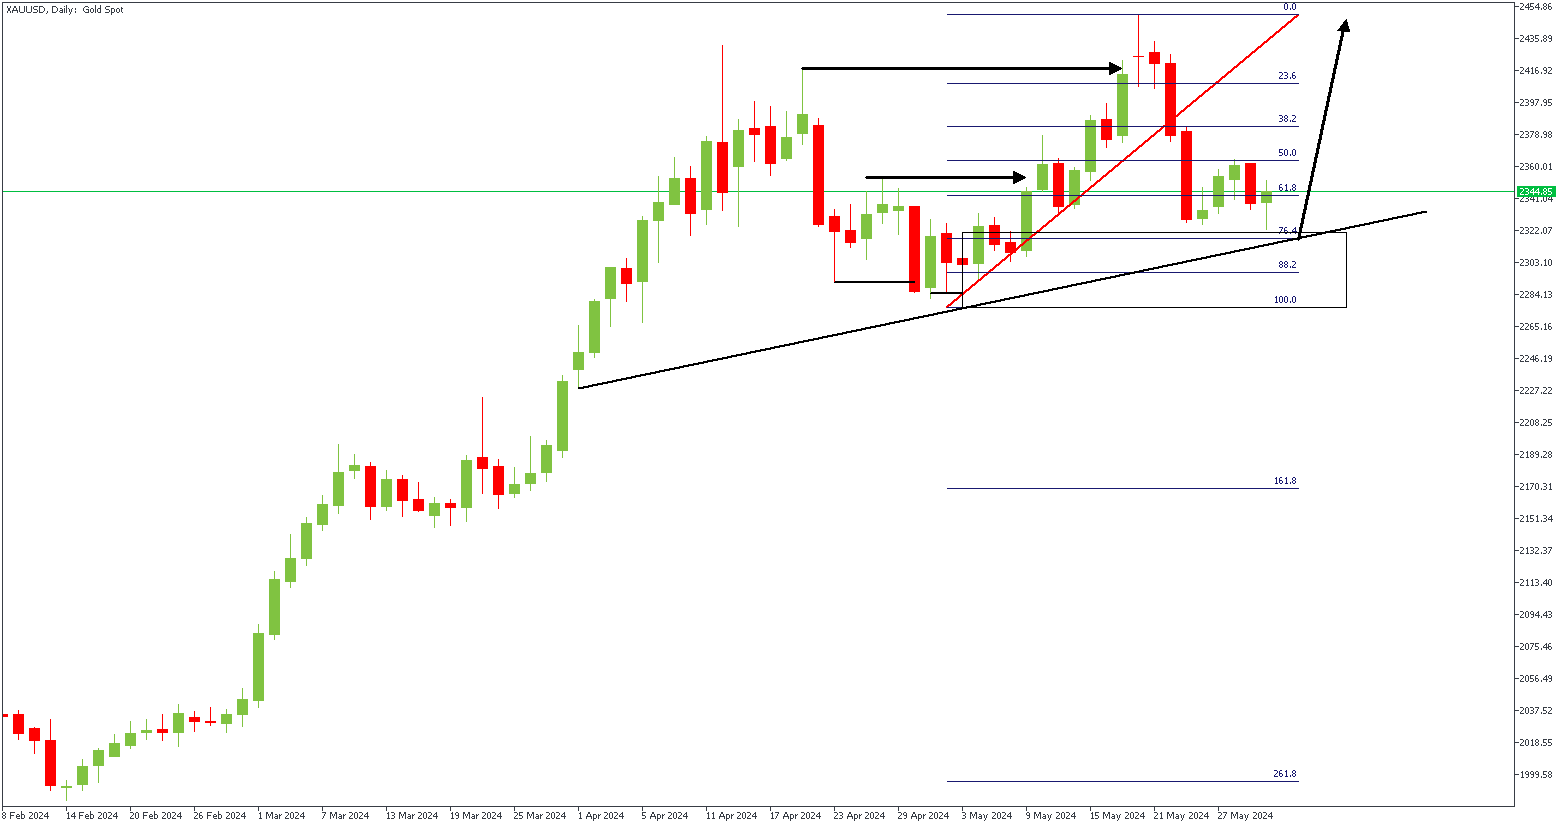
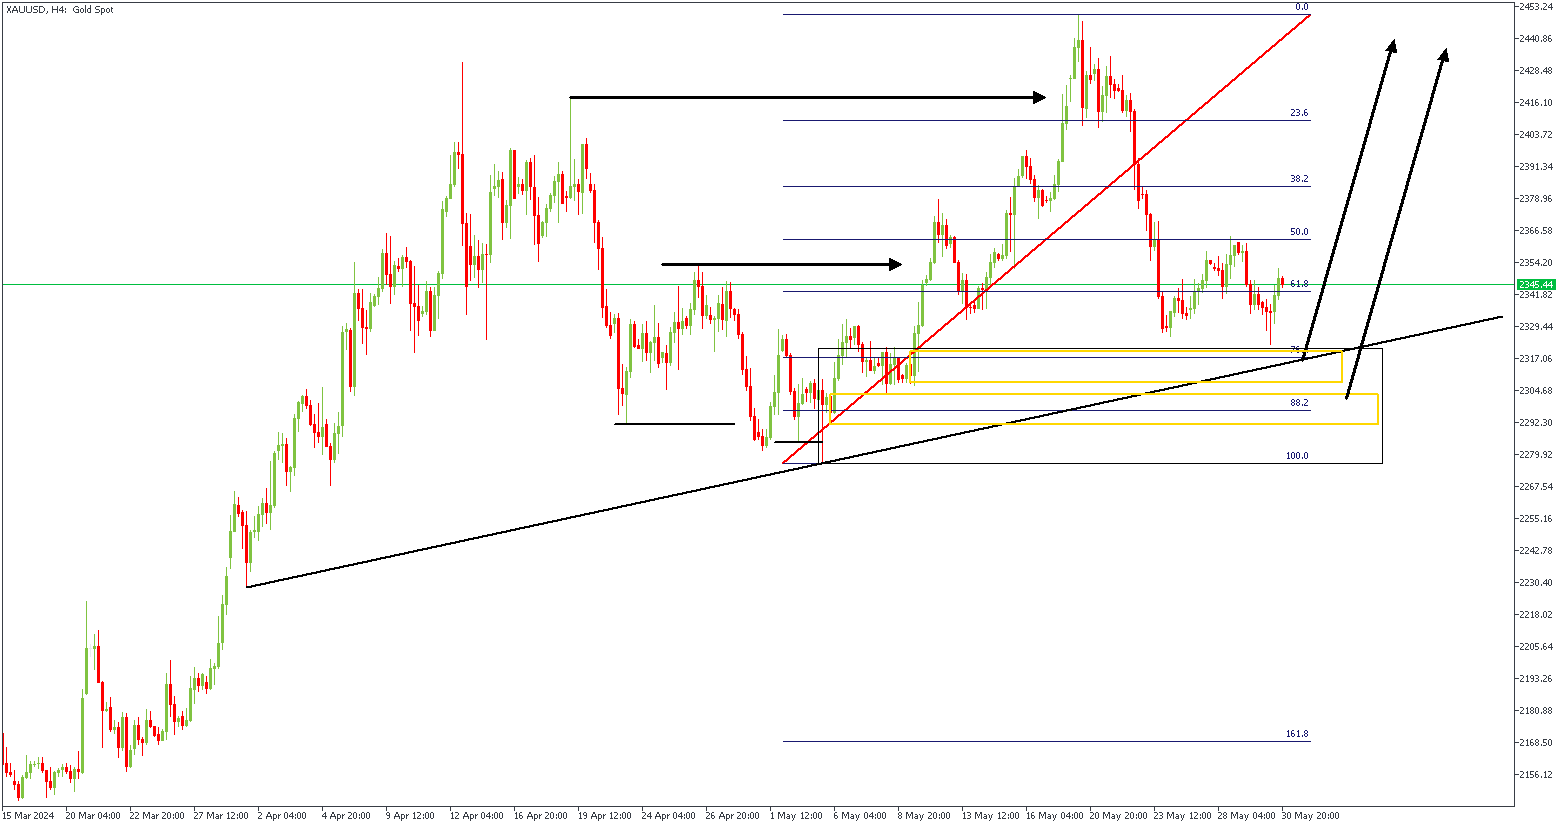
The current situation on the Daily timeframe of XAUUSD (Gold) shows that the bullish trend could very much continue since the bearish retracement has now reached a demand zone. In confluence with the demand zone on the daily timeframe, we have the trendline support, and the 76% of the Fibonacci retracement.
XAUUSD – H4 Timeframe
The 4-hour timeframe of XAUUSD presents a QMR pattern where we can see the sweep of the previous low, the break above the previous high, and the sweep of the inducement. These are the clear definitions of a Quasimodo Reversal (QMR) pattern; very similar to an inverted head-and-shoulder in this case.
Analyst’s Expectations:
- Direction: Bullish
- Target: $2,449.44
- Invalidation: $2,274.59
CONCLUSION
The trading of CFDs comes at a risk. Thus, to succeed, you have to manage risks properly. To avoid costly mistakes while you look to trade these opportunities, be sure to do your due diligence and manage your risk appropriately.
EURGBP Stuck Around the Crucial 0.8500 Floor
- EURGBP remains directionless near the long-term 0.8500 reflection point
- Technical signals flag oversold conditions, but a bullish outlook could come above 0.8600
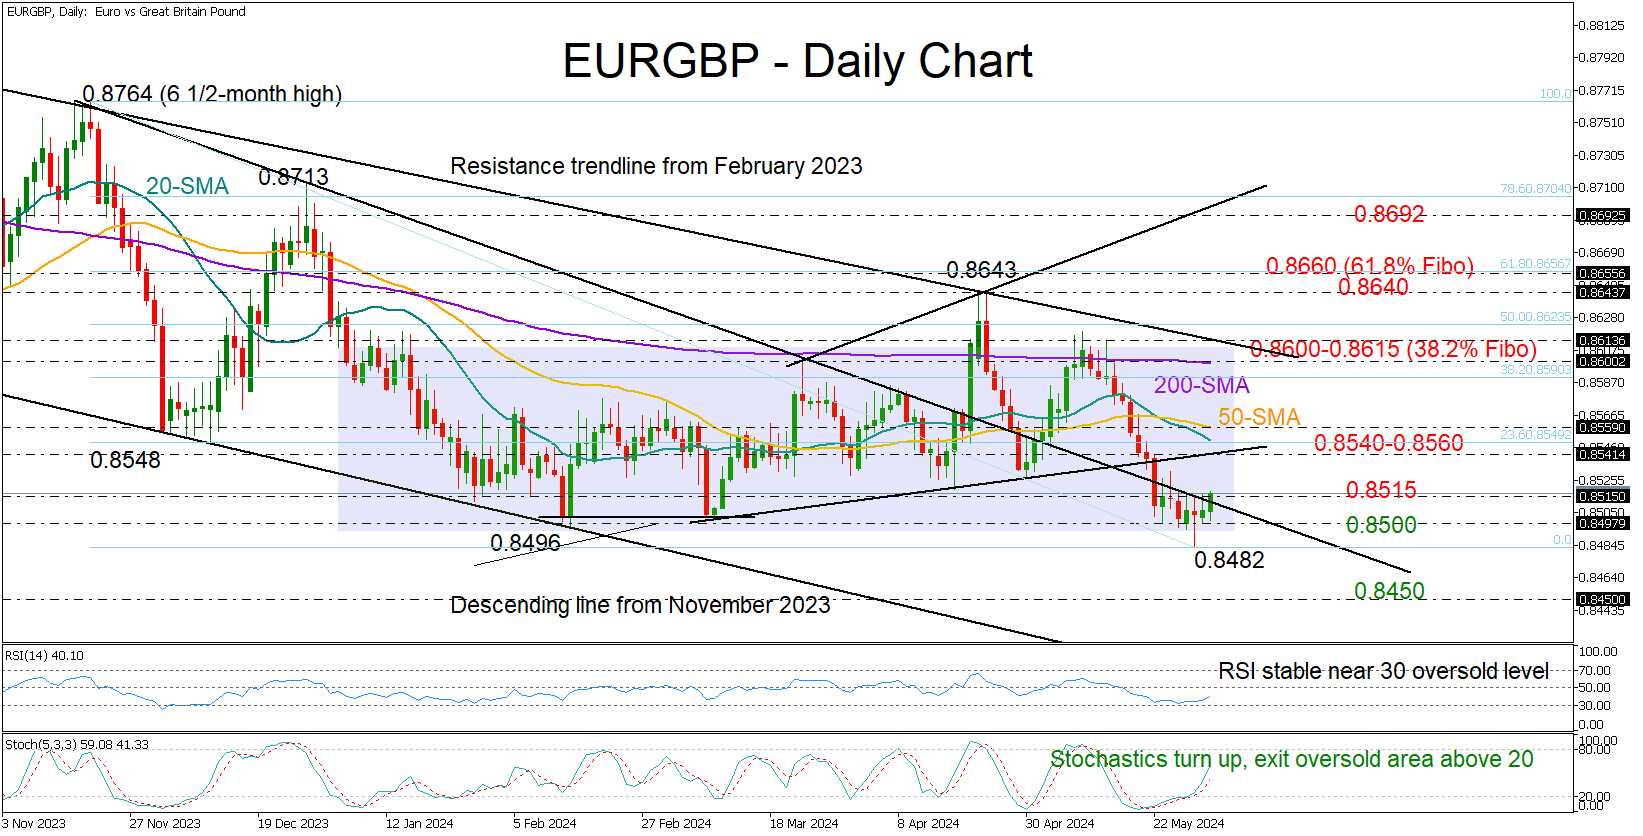
Despite hitting a 20-month low of 0.8482, EURGBP has remained flat and unable to establish a clear direction around the significant level of 0.8500 over the past week.
Eurozone’s preliminary CPI inflation data will be out today at 09:00 GMT. From a technical perspective, the bulls might be around the corner given the positive reversal in the stochastic oscillator. The RSI, although not showing any strong bias, is hovering near the oversold level of 30, promoting the bullish scenario too.
Still, a bullish correction may not entice buyers unless the price crosses above the range of 0.8540-0.8560. A decisive close higher could produce another leg up to 0.8600-0.8615 region, where the key falling descending trendline from February 2023 is placed. The pair will have to breach that territory as well to resume its positive medium-term outlook.
If the 0.8500 floor cracks, the pair may face considerable pressure to find shelter around the 0.8450 barrier, which was last observed in 2021-2022, or drop towards the psychological mark of 0.8400. Interestingly, the latter overlaps with the descending line, which joins the lows from November 2023 and February 2024.
All in all, EURGBP keeps fighting for a bullish rotation near the familiar 0.8500 base. Even if there is a potential for an upward bounce, downside risks might remain intact unless the price surges above 0.8600-0.8615.
USDCAD Meets Uptrend Line Again and Again
- USDCAD fails to climb above 1.3740
- Momentum oscillators show contradicting signs
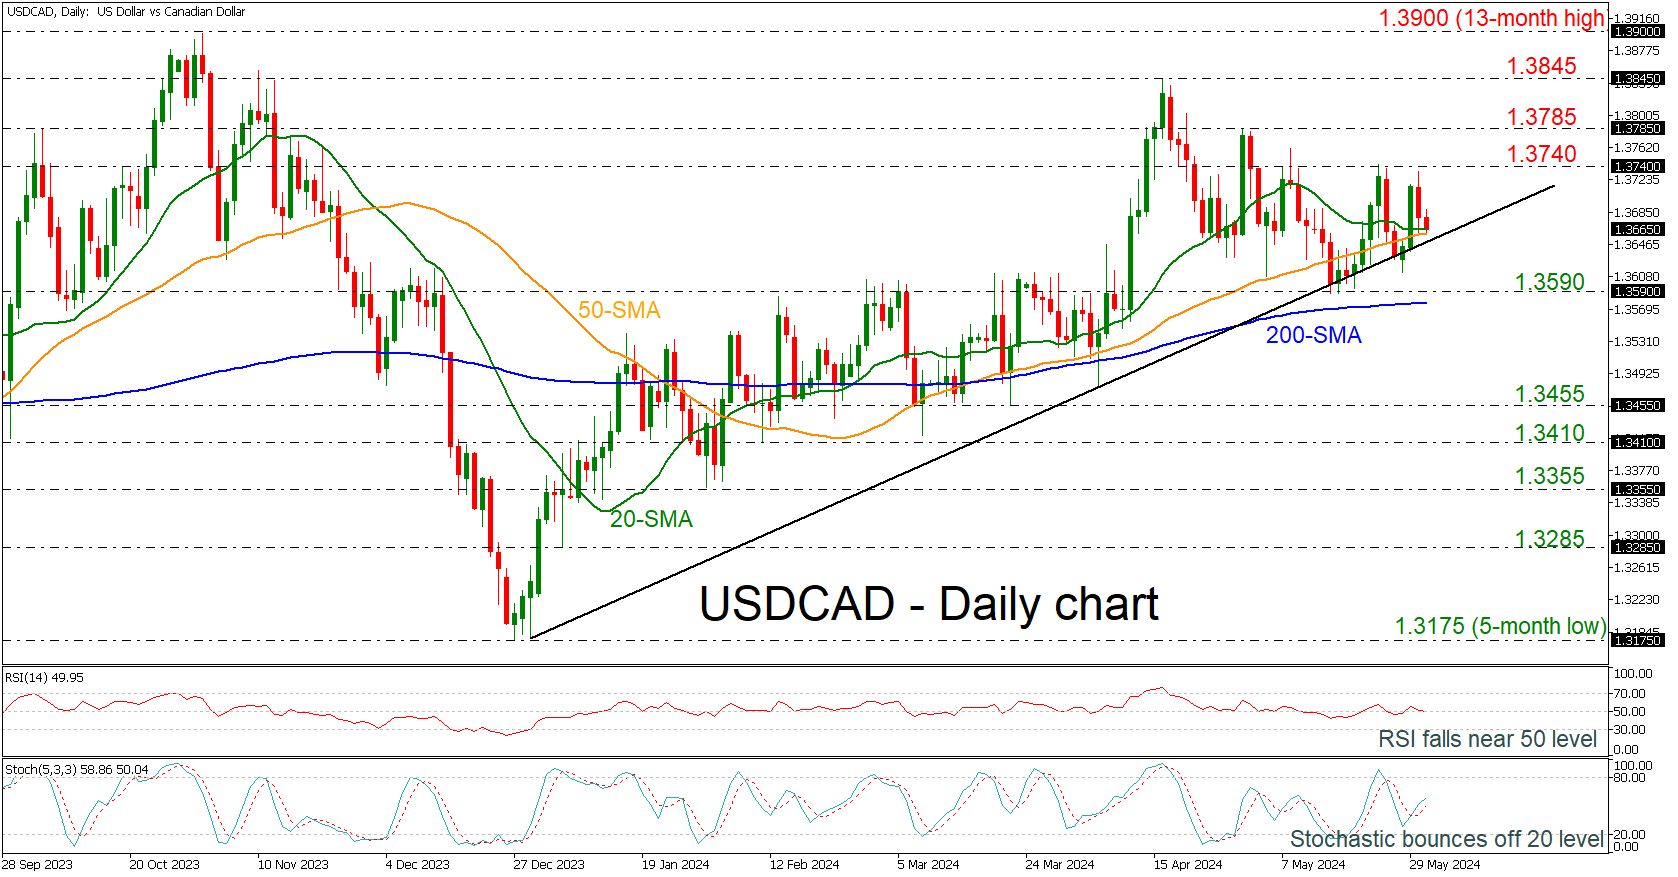
USDCAD has been rebounding off the medium-term ascending trend line over the last couple of weeks, remaining in a positive territory. However, the pair is also finding strong resistance around the 1.3740 barricade with the short-term simple moving averages (SMAs) suggesting a potential bearish crossover.
The technical oscillators are showing some mixed signs. The RSI is crossing the 50 level to the downside, while the stochastic oscillator is pointing upwards after the bullish crossover within its %K and %D lines.
If the bears take the market lower, the price could find immediate support at the 1.3590 level, ahead of the flattened 200-day SMA at 1.3575. A slip below this obstacle could send traders until the 1.3455 support.
On the other hand, immediate resistance could open the way for a retest of the 1.3740 mark. A successful move higher may add some optimism for more bullish actions until 1.3785 and 1.3845.
In brief, USDCAD is still in a positive territory as it is standing above the uptrend line, but any declines beneath the 200-day SMA could switch the outlook to a more bearish one in the short-term view.
AUDUSD Bullish Tendency in Doubt
- AUDUSD in the green again today, above a key trendline
- AUD has managed to withstand the recent USD strength
- Momentum indicators mixed; stochastics could send a bearish signal
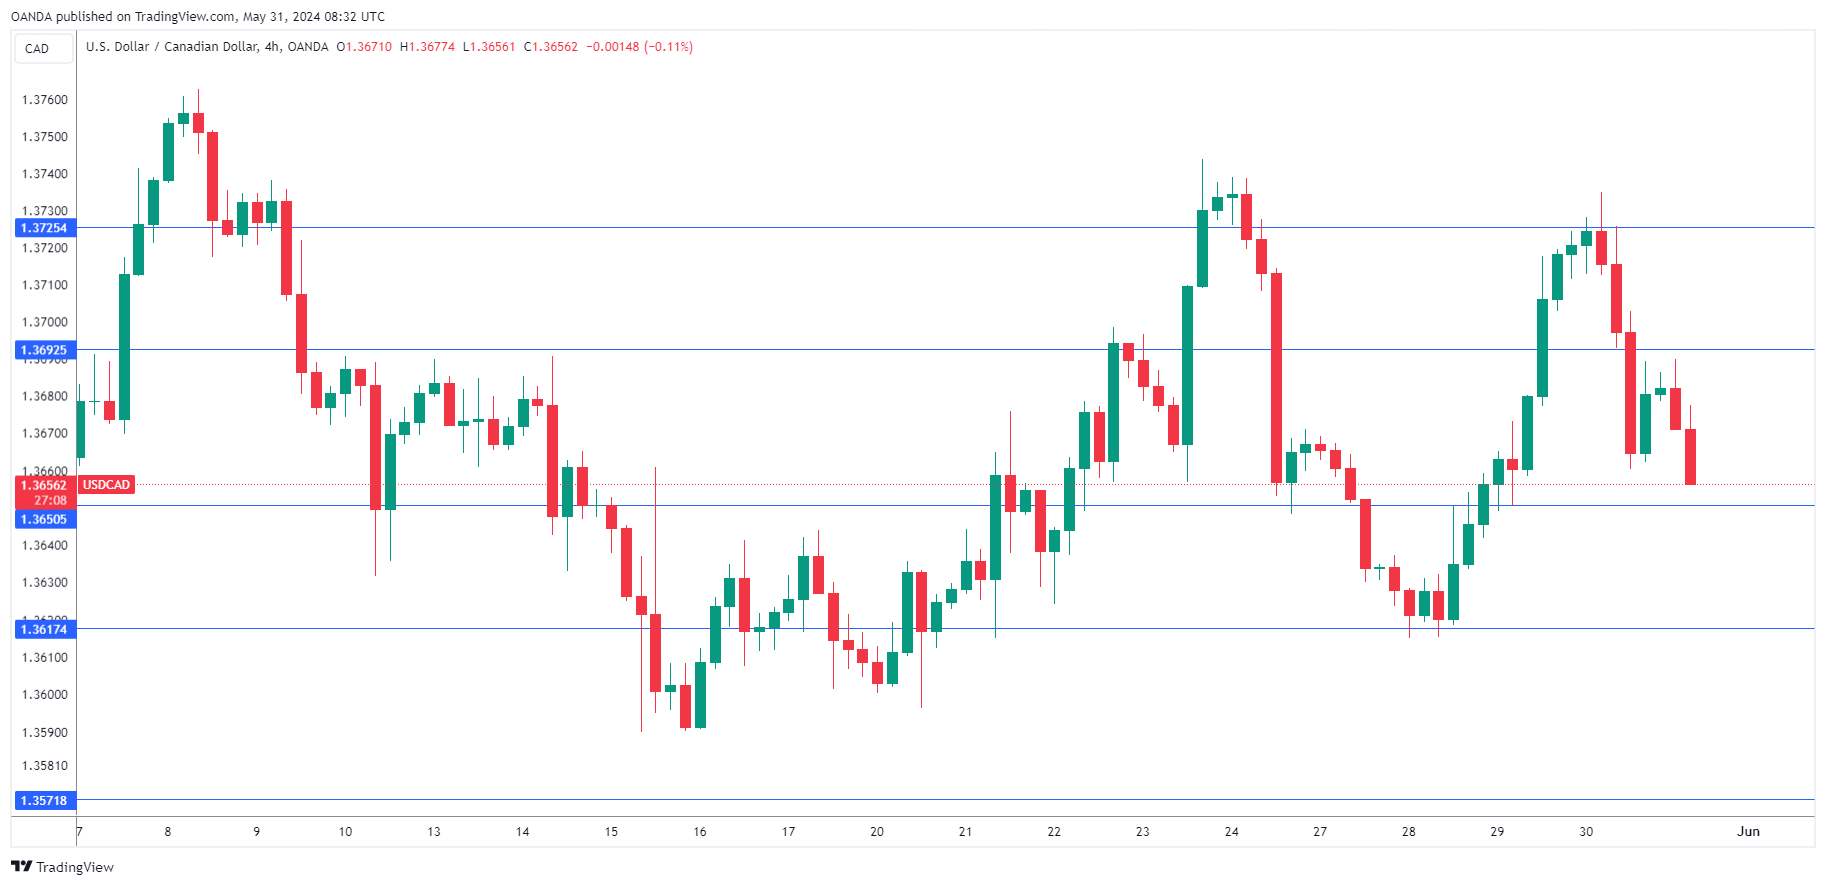
AUDUSD is recording another green candle today as the market continues to react positively to the recent data releases from Australia and, in particular, the hotter April inflation print. Although the Fed is not expected to ease before the November Presidential elections, the RBA is seen as the most hawkish of the pack, thus allowing AUDUSD to remain bid. The pair is currently battling the October 26, 2023 ascending trendline and could possibly be on its way to record another higher high.
The momentum indicators appear mixed at this juncture. In more detail, the Average Directional Movement Index (ADX) remains stuck below its 25-threshold, signaling a trendless market, and the RSI is tentatively edging above its 50-midpoint. More interestingly, the stochastic oscillator is trying to move below its moving average, setting a course for a lower low and possibly opening the door to a similar move in AUDUSD.
Should the bulls remain confident, they could try to keep AUDUSD above the October 26, 2023 trendline, and then gradually stage a move towards the July 14, 2022 low at 0.6681. The 38.2% Fibonacci retracement level of the April 5, 2022 – October 13, 2022 downtrend at 0.6739 could be next.
On the flip side, the bears are probably keen to put a stop to the current bullish move by pushing AUDUSD below the October 26, 2023 trendline and towards the 0.6556-0.6562 area, which is defined by the 50- and 100-day simple moving averages (SMAs). If successful, they could then have a go at testing the support set by the 0.6521-0.6532 range that is populated by the 23.6% Fibonacci retracement level and the 200-day SMA.
To sum up, AUDUSD bulls remain in control, but they probably need to rally above the recent peak of 0.6713 to keep the current bullish trend intact.