
Sample Category Title
EUR/JPY Daily Outlook
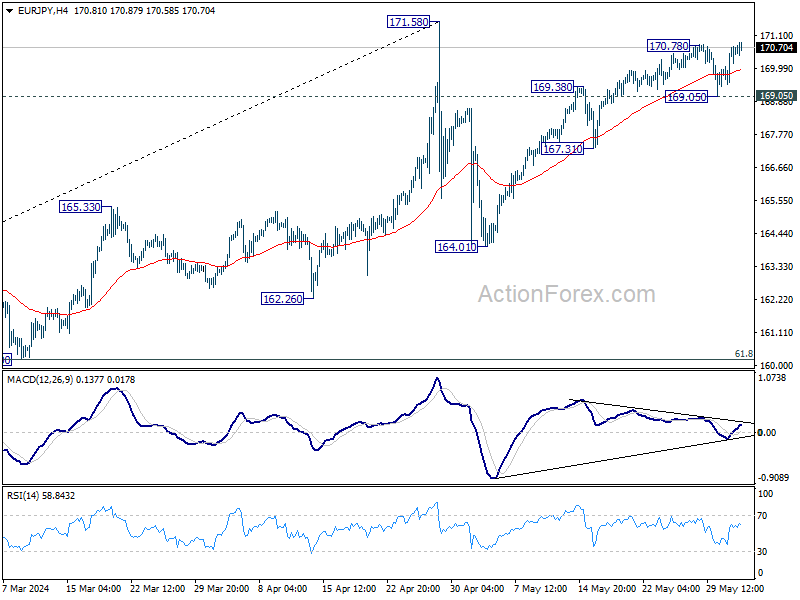
Daily Pivots: (S1) 169.80; (P) 170.28; (R1) 171.10; More….
Intraday bias in EUR/JPY is back on the upside with breach of 170.78 temporary top. Rise from 164.01 would now target 171.58 resistance. Firm break there will resume larger up trend. On the downside, below 169.05 minor support will turn bias back to the downside for 167.31 instead.
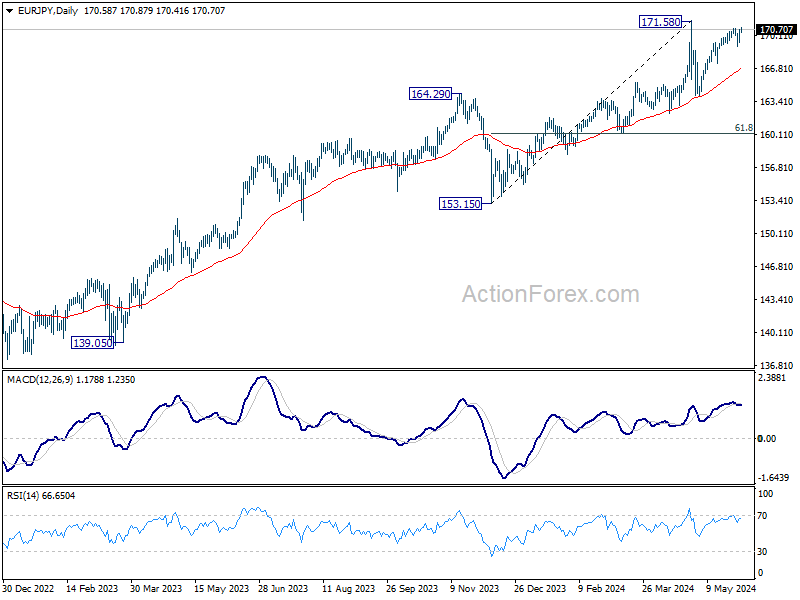
In the bigger picture, a medium top was formed at 171.58 after brief breach of 169.96 (2008 high). But as long as 55 W EMA (now at 166.81) holds, price actions from there is seen as correcting the rise from 153.15 only. That is, larger up trend remains in favor to continue. However, sustained break of 55 W EMA will argue that larger scale correction is underway and target 153.15 support.
Euro Area Inflation Beat Expectations
In focus today
Today in the US, we get the May ISM Manufacturing index at 16.00 CET. Its PMI-counterpart released earlier shifted modestly higher, but the leading new orders indices still pointed towards muted growth.
In Sweden, we get the manufacturing PMI for May at 08.30 CET. It is set to continue higher from last month's 51.4, as suggested by the order/inventory-spread reaching its highest level since mid-2021. Notably, it was primarily export orders that were strong in April, with the sub-index rising from 49.9 to 54.6. Domestic orders are also on a rising trend, but the sub-index remained below the 50-mark coming in at 49.4 in April.
For the rest of the week focus will turn especially to the euro area and the ECB, where we expect the ECB to cut interest rates by 25bp on Thursday, thus lowering the deposit facility rate to 3.75%. In the US focus will be on the job market as we get the JOLTs for April on Tuesday, ADP report on Wednesday, and NFP report on Friday. On Wednesday we also get the ISM non-manufacturing figures. The Bank of Canada as well as the Polish central bank will also both convene Wednesday and announce their rate decisions.
Economic and market news
What happened overnight
In China, the Caixin manufacturing PMI for May was released overnight. The figure printed at 51.7 (prior: 51.4), thus beating the expected 51.5, and remaining in expansionary territory (above the 50.0 mark), as it has been since November last year. In fact, the figure has not printed as high since June 2022.
Interestingly, this is somewhat the opposite of what was seen last week with the NBS manufacturing PMI, which unexpectedly dropped to 49.5 from 50.4, thus falling into contractionary territory. The Caixin figure has generally been stronger than its official NBS counterpart, and the two figures do not always follow one another on a monthly basis.
There was also Manufacturing PMI data from other Asian countries such as South Korea and Japan. Here the data also showed an improved outlook for the Asian manufacturing sector.
The Asian equity markets responded positively to the data with gains across the region. The Indian equity market was up on the back of the widely anticipated victory for PM Modi at the general election which concluded yesterday (see more below).
There were modest gains in the Asian bond markets this morning with a small decline in bond yields.
Oil is flat this morning with Brent trading around USD81/bbl. This comes after OPEC+ announced an extension and phasing-out plan of their voluntary production cuts yesterday. Whereas the extension of the cuts was expected by most market participants, the phasing-out scheme was news. However, commenting on the plan after the meeting, Saudi Arabia's oil minister said that they would maintain their 'cautious and pre-emptive approach', which could entail 'pausing or even reversing the phase-out of the cuts' if deemed necessary.
What happened on Friday and over the weekend
In the euro area, HICP headline for May inflation came in slightly higher than expected at 2.6% y/y (prior: 2.4%), whereas consensus expected 2.5%. The higher-than-expected inflation was in line with the signals from the country data released before the aggregate print. Core inflation also printed higher than expected at 2.9% y/y (prior: 2.7%). Consensus expected 2.7% y/y. Service inflation once again came in very strong rising to 4.1% y/y from 3.7% y/y. The monthly increase in seasonally adjusted service inflation was around 0.5% m/m for the second consecutive month.
Overall, the inflation print for May confirmed the picture we have seen over the past months of a strong underlying pressure on inflation from service prices. The sticky services inflation is a key reason for the ECB to await more data before embarking on a series of rate cuts not counting the all-but-promised cut on Thursday 6 June, which we see as a roll-back of the 'insurance hike' from last September.
Going forward, we expect that euro area inflation will hover around 2.5% over the next couple of months due to rising energy inflation and sticky services inflation. After summer, we then expect headline inflation to hit the 2% target in some months due to energy base effects, but the sticky underlying inflation means that we expect inflation only to sustainably converge to the 2% target during 2025.
In the US, the Fed's favourite price gauge, the PCE price index, showed headline inflation for April standing at 2.7% y/y and 0.3% m/m both unchanged from the month prior and in line with expectations. As for core inflation, it stood at 2.8% y/y and 0.2% m/m. Whereas the annual rate was unchanged from the month prior and in line with expectations, the monthly rate came in lower than the 0.3% m/m consensus had expected according to a poll by Reuters. However, on a double-digit note, the measure stood at 0.25% m/m, hence it came very close to consensus. With the PCE inflation figures we also received April figures for the real personal consumption volume which stood at -0.1% m/m, down from the revised March figure of 0.4% m/m.
In India, prime minister Modi's party looked set to win big in the Indian general election according to exit polls, pointing to Modi securing a third five-year term as prime minister. The National Democratic Alliance led by prime minister Modi's party, the BJP, was projected to improve on their current absolute majority from 2019 of 353 seats by securing between 353 and 401 seats out of the total 543 seats in parliament. Modi's party alone accounted for 301 in the alliance after the 2019 election, and 3 out of 5 exit polls predicted the prime minister's party would improve on this. Despite somewhat 'patchy' track records of polling agencies in India, often claimed to be due to the vast size and large diversity of the country, prime minister Modi went on X (previously Twitter) saying that he with "confidence [could say] that the people of India have voted in record numbers to re-elect the NDA government". Results of the election will be expected on 4 June.
In France, the S&P rating agency downgraded France to an AA- credit rating from AA. The S&P said in their announcement the downgrade was due to higher projected debt-to-GDP ratios than previously expected, as they now forecast a ratio of 112% in 2027 up from 109% in 2023. Likewise, they also foresee a higher budgetary deficit in 2027 of 3%, after a higher-than-expected deficit in 2023 of 5.5%.
Nifty Hits Record, Oil Weakens Post-OPEC Decision
OPEC+ announced on Sunday that it will extend supply cuts to the Q3 but will gradually return barrels to the market over the following 12 months. The fact that OPEC has a clear time in mind for waning its supply cut policy is not supportive of oil bulls. The barrel of US crude fell to $76.50 at the weekly open before rebounding toward the $77pb on the back of a stronger-than-expected Chinese manufacturing PMI, with the Caixin index pointing at the strongest expansion in nearly 2 years. Expected interest rate cuts from major banks could temper a soft OPEC decision this week, but they may not be enough to send oil prices on a sustained bullish journey unless global growth expectations improve alongside a softer monetary policy outlook from major central banks.
In India, the Nifty 50 jumped to a fresh record, and the rupee rallied as exit polls for the Indian election hinted at a clear-cut victory for PM Modi’s party. In separate news, S&P upgraded its outlook for India from stable to positive, laying the foundation for a higher credit rating for the rising EM giant. This upgrade could lower borrowing costs for the country and further support its economic rise.
The combination of Friday’s soft US inflation data, OPEC’s hint on softer supply policy, the Chinese PMI figure and the reaction to the Indian election results paint the market in green this Monday.
The central bank mosaic
The core PCE data showed on Friday that inflation in the US met the expectation of 0.2% monthly advance in April - the smallest advance of the year, and personal spending grew last than expected. The combination of softer-than-expected US growth and spending, combined with a satisfactory inflation read gave some relief to the market on Friday. As a result, the week ended on a more dovish note compared to when it started. The US 2-year yield slipped below the 4.90% level after having tested the 5% mark earlier in the week, the 10-year yield eased below 4.50%, the S&P500 recovered 0.80% on Friday and closed the week juts 0.5% lower, as Nasdaq managed to close a difficult session near flat and limited losses to around 1.1% for the week.
Hopefully, the surviving chance of a Federal Reserve (Fed) rate cut - or two - could help improve the investor sentiment this week as eyes turn to the Bank of Canada (BoC) and the European Central Banks (ECB) that are preparing to announce their first rate cut this week.
Note that, the ECB has been clear - and probably a bit too clear - on its intention to start cutting the rates in the June meeting. So they can’t really back down now; there will probably be a 25bp cut announced this Thursday. But the truth is, Friday’s CPI update for the Eurozone wasn’t much enchanting for the ECB doves. Consumer prices accelerated from 2.4% to 2.6% in May – higher than 2.5% expected by analysts - and core inflation unexpectedly spiked from 2.7% to 2.9%. The latest CPI update didn’t bring much confusion regarding the ECB cut expectations this week, but somehow killed hope regarding a possible, second rate cut in July. As such, and in the light of the latest developments, the ECB’s communication on what it is planning to do next amid signs of quickening inflation will matter more than the cut itself. If the ECB sounds cautious considering the rising upside risks to the price stability - and that’s my base case scenario - we could see the euro get some support following a choppy end of May. The pair is trading near the 1.0850 this morning.
GBP/JPY Daily Outlook
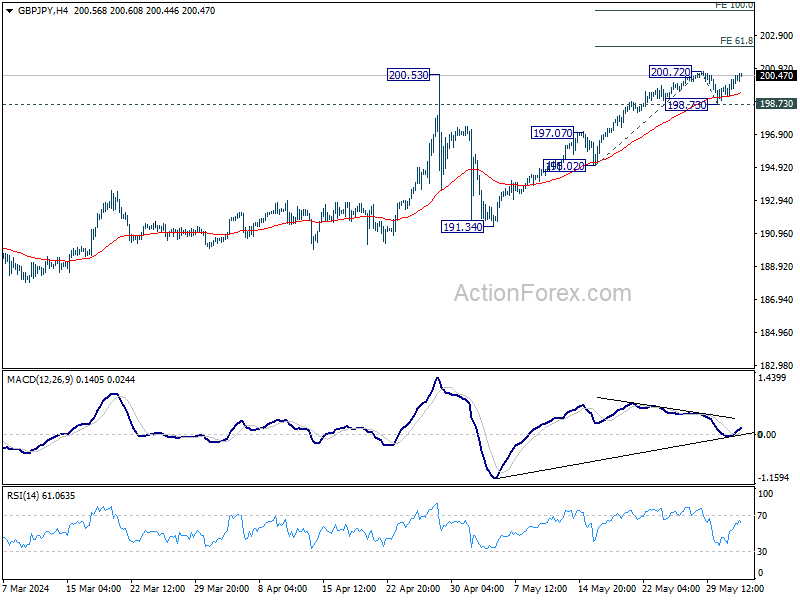
Daily Pivots: (S1) 199.60; (P) 200.06; (R1) 200.88; More….
Intraday bias in GBP/JPY remains neutral for the moment. Further rally is expected as long as 198.73 support holds. Firm break of 200.72 will confirm larger up trend resumption. Next target is 61.8% projection of 195.02 to 200.72 from 198.73 at 202.25.
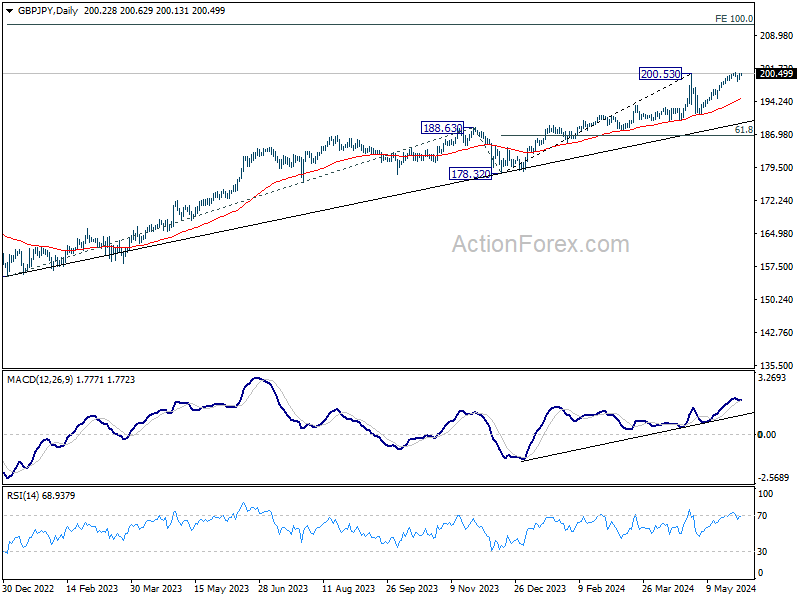
In the bigger picture, as long as 188.63 resistance turned support holds, long term up trend is expected to continue. Sustained trading above 200.53 will pave the way to 100% projection of 155.33 to 188.63 from 178.32 at 211.62.
Risk Sentiment Firm, Currencies Hold Steady, Anticipate Rate Cuts and Crucial Economic Data
Global markets started the week on a positive note, drawing momentum from the robust close last week in the US and buoyed further by slightly better than expected manufacturing data out of China. In Tokyo, stocks received additional support from comments by BoJ Executive Director Takashi Kato, who indicated that the central bank has no immediate plans to unload its holdings of ETFs.
Currency markets, however, are showing less activity as traders hold their positions in anticipation of significant events scheduled for later in the week. Japanese Yen, Australian Dollar, and Canadian Dollar are currently weaker, while Swiss Franc, Euro, and New Zealand Dollar are on the stronger side. Dollar and British Pound are showing mixed performance. The focus of global markets are on the upcoming meetings of ECB and BoC, which may result in interest rate cuts. Additionally, the release of high-profile economic data such as US ISM indexes and Non-Farm Payrolls will be closely watched.
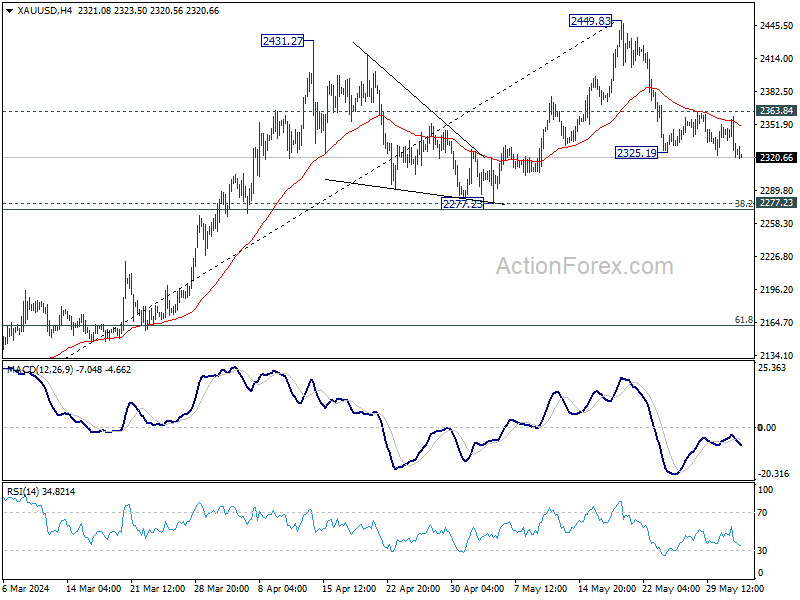
Technically, Gold's breach of 2325.19 minor support suggests that corrective fall from 2449.83 is resuming for 2277.34 cluster support holds (38.2% retracement of 1984.05 to 2449.83 at 2271.90). Strong support could be seen there to bring rebound. Brea of 2363.84 resistance will argue that larger rally is ready to resume. However, sustained break of 2277.23 will argue that larger scale correction is already underway.
In Asia, at the time of writing, Nikkei is up 1.14%. Hong Kong HSI is up 2.44%. China Shanghai SSE is down -0.43%. Singapore Strait Times is up 0.28%. Japan 10-year JGB yield is down -0.0006 at 1.074.
Japan's PMI manufacturing, finalized at 50.4, above neutral mark for first time in a year
Japan's PMI Manufacturing index was finalized at 50.4 in May, up from 49.6 in April, crossing the 50 neutral mark for the first time in a year. S&P Global noted that both output and new orders remained broadly stable, while employment and input stocks saw expansion.
Pollyanna De Lima at S&P Global Market Intelligence highlighted the "encouraging trends" in the manufacturing industry, noting that new orders and output were stable, and businesses were optimistic about the year ahead. She mentioned that input stocks increased as materials ordered in recent months arrived, which bodes well for production and suggests a gradual near-term recovery.
Factory employment also rose but continued to be affected by retirements and difficulties in finding suitable replacements. Another challenge faced by manufacturers was the intensification of cost pressures due to yen depreciation, which strained the prices of imported items. This, along with rising wage costs, led to the sharpest increase in output charges in a year. De Lima pointed out that this is concerning given the subdued domestic and external demand.
China's Caixin PMI manufacturing rises to 51.7, production picks up
China's Caixin PMI Manufacturing index edged up from 51.4 to 51.7 in May, surpassing expectations of 51.5. Caixin reported that production expanded at its most pronounced pace since June 2022, with the fastest growth in purchasing activity in three years. Meanwhile, input price inflation reached a seven-month high.
Wang Zhe, Senior Economist at Caixin Insight Group, highlighted that the manufacturing sector continued to improve, with gains in supply, domestic demand, and exports. Logistics and transportation remained efficient, and businesses increased their purchase quantities and inventories, reflecting a positive outlook.
Despite these positive developments, Wang noted persistent challenges, particularly low price levels on the sales side. Additionally, employment continued to shrink as businesses remained cautious about hiring.
Global rate cut camp to expand: ECB and BoC to lower rates this week?
Meetings of two major central banks, BoC and ECB—will be closely monitor this week, together with market moving indicators from the US, Swiss, Australia and China.
For BoC, expectations are leaning towards a 25 basis point rate cut to 4.75%, especially after Canadian GDP showed slower than expected growth in Q1 and inflation rates stabilized within the target band of 1-3% for several months. However, not all economists are in agreement, with some predicting the rate cut might be postponed until July.
Whether policy easing starts this week of not, the focal point for BoC will undoubtedly be any forward-looking guidance they provide about the path of monetary policy easing throughout the year. A recent Reuters poll indicated that the majority of economists are anticipating at least three rate cuts this year, with predictions centering on a reduction to 4.00% by year-end. BoC has the possibility to move the Canadian Dollar by shaping expectations the other ways.
On ECB front, a rate cut seems almost certain this week, with expectations pointing to a 25bps reduction in deposit rate to 3.75% and corresponding adjustment in main refinancing rate to 4.25%. Given the recent unexpected uptick in Eurozone inflation, a consecutive rate cut in July appears highly unlikely.
ECB President Christine Lagarde is expected to maintain a data-dependent stance, focusing on a meeting-by-meeting approach in her communications. However, the upcoming economic projections could offer valuable insights into the likelihood of whether one or two additional rate cuts will be delivered later in the year.
Apart from these central bank meetings, several other key economic reports are set to be released, which could also sway market sentiments. These include US ISM indexes and non-farm payrolls, Japan’s cash earnings and household spending, Swiss CPI, Canadian employment figures, Australia's GDP, and China’s Caixin PMIs and trade balance.
Here are some highlights for the week:
- Monday: Japan PMI manufacturing final; China Caixin PMI manufacturing; Swiss PMI Manufacturing; Eurozone PMI manufacturing final; UK PMI manufacturing final; Canada PMI manufacturing; US ISM Manufacturing, construction spending.
- Tuesday: Japan monetary base; Australia current account; Swiss CPI; Germany unemployment; US factory orders.
- Wednesday; New Zealand terms of trade; Japan average cash earnings; Australia GDP; China Caixin PMI services; France industrial production; Eurozone PMI services final, PPI; UK PMI services final; US ADP employment, ISM services; BoC rate decision,
- Thursday: Australia goods trade balance; Swiss unemployment; Germany factory orders; Italy retail sales; UK PMI construction; Eurozone retail sales; ECB rate decisions; Canada trade balance, Ivey PMI; US jobless claims; trade balance.
- Friday: New Zealand manufacturing sales; Japan household spending; China trade balance; Germany industrial production, trade balance; Swiss foreign currency reserves; Eurozone GDP revision; Canada employment; US non-farm payrolls.
GBP/JPY Daily Outlook
Daily Pivots: (S1) 199.60; (P) 200.06; (R1) 200.88; More….
Intraday bias in GBP/JPY remains neutral for the moment. Further rally is expected as long as 198.73 support holds. Firm break of 200.72 will confirm larger up trend resumption. Next target is 61.8% projection of 195.02 to 200.72 from 198.73 at 202.25.
In the bigger picture, as long as 188.63 resistance turned support holds, long term up trend is expected to continue. Sustained trading above 200.53 will pave the way to 100% projection of 155.33 to 188.63 from 178.32 at 211.62.
Economic Indicators Update
| GMT | Ccy | Events | Actual | Forecast | Previous | Revised |
|---|---|---|---|---|---|---|
| 23:50 | JPY | Capital Spending Q1 | 6.80% | 12.20% | 16.40% | |
| 0:30 | JPY | Manufacturing PMI May F | 50.4 | 50.5 | 50.5 | |
| 1:45 | CNY | Caixin Manufacturing PMI May | 51.7 | 51.5 | 51.4 | |
| 7:30 | CHF | Manufacturing PMI May | 45.4 | 41.4 | ||
| 7:45 | EUR | Italy Manufacturing PMI May | 48 | 47.3 | ||
| 7:50 | EUR | France Manufacturing PMI May F | 46.7 | 46.7 | ||
| 7:55 | EUR | Germany Manufacturing PMI May F | 45.4 | 45.4 | ||
| 8:00 | EUR | Eurozone Manufacturing PMI May F | 47.4 | 47.4 | ||
| 8:30 | GBP | Manufacturing PMI May F | 51.3 | 51.3 | ||
| 13:30 | CAD | Manufacturing PMI May | 49.4 | |||
| 13:45 | USD | Manufacturing PMI May F | 50.9 | 50.9 | ||
| 14:00 | USD | ISM Manufacturing PMI May | 49.8 | 49.2 | ||
| 14:00 | USD | ISM Manufacturing Prices Paid May | 60 | 60.9 | ||
| 14:00 | USD | ISM Manufacturing Employment Index May | 48.6 | |||
| 14:00 | USD | Construction Spending M/M Apr | 0.20% | -0.20% |
China’s Caixin PMI manufacturing rises to 51.7, production picks up
China's Caixin PMI Manufacturing index edged up from 51.4 to 51.7 in May, surpassing expectations of 51.5. Caixin reported that production expanded at its most pronounced pace since June 2022, with the fastest growth in purchasing activity in three years. Meanwhile, input price inflation reached a seven-month high.
Wang Zhe, Senior Economist at Caixin Insight Group, highlighted that the manufacturing sector continued to improve, with gains in supply, domestic demand, and exports. Logistics and transportation remained efficient, and businesses increased their purchase quantities and inventories, reflecting a positive outlook.
Despite these positive developments, Wang noted persistent challenges, particularly low price levels on the sales side. Additionally, employment continued to shrink as businesses remained cautious about hiring.
EUR/USD Eyes More Gains Above 1.0900, Bulls In Control
Key Highlights
- EUR/USD started a consolidation phase below the 1.0900 resistance.
- A major bullish trend line is forming with support at 1.0820 on the 4-hour chart.
- Gold prices are still consolidating above the $2,320 support zone.
- GBP/USD might continue to rise unless there is a close below 1.2650.
EUR/USD Technical Analysis
The Euro remained in a positive zone above the 1.0780 pivot level against the US Dollar. EUR/USD gained pace for a move above 1.0850 but struggled near 1.0900.
Looking at the 4-hour chart, the pair started a consolidation phase above the 1.0820 level. There is also a major bullish trend line forming with support at 1.0820. The main support seems to be forming near the 1.0800 level.
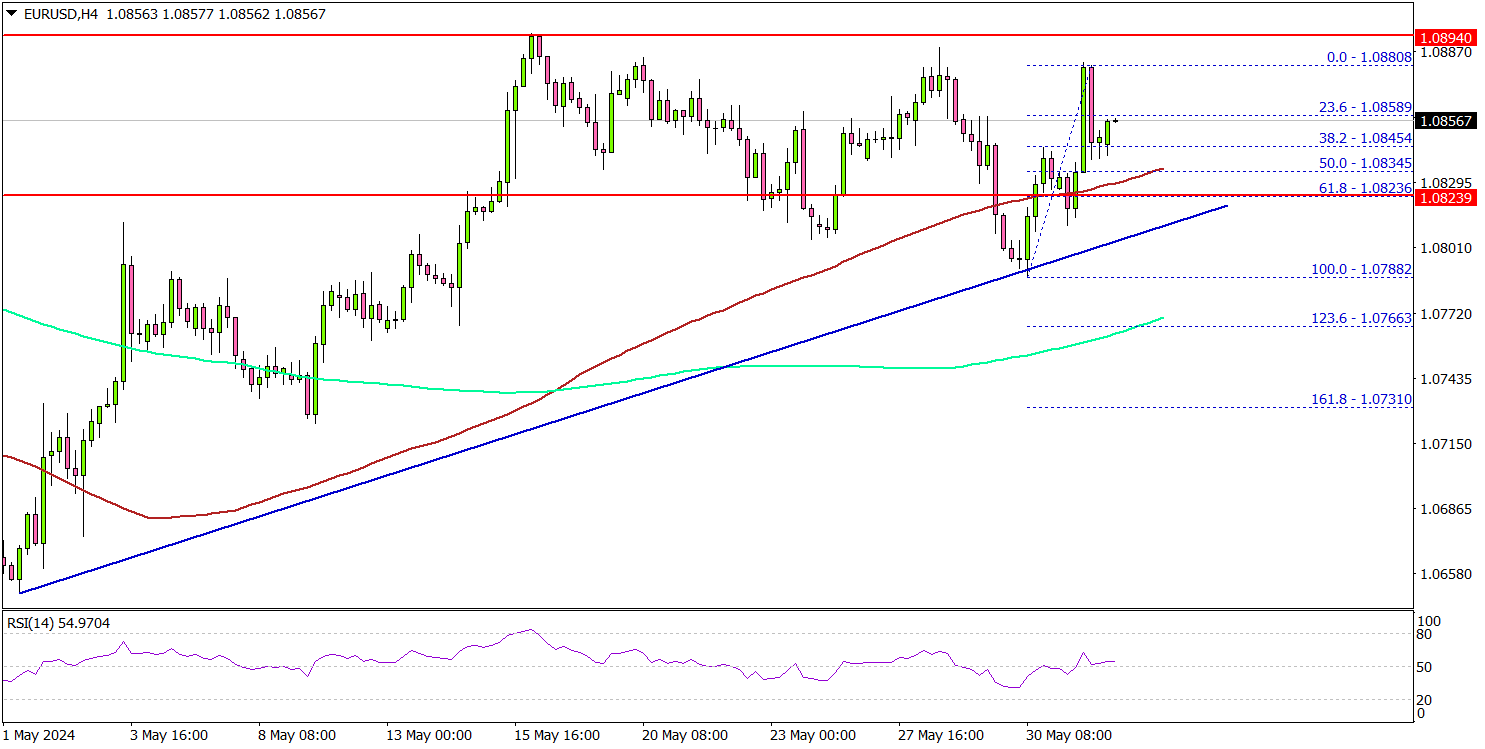
A downside break and close below the 1.0800 support zone could open the doors for a larger decline. In the stated case, the pair could decline toward the 1.0750 level.
On the upside, immediate resistance is near the 1.0890 zone. The first major resistance is near the 1.0900 level. A clear move above the 1.0900 resistance might send it toward the 1.0935 level. Any more gains might call for a move toward the 1.0950 level in the near term.
Looking at GBP/USD, the pair is holding gains above a couple of important support levels and might continue to rise in the near term.
Economic Releases
- Germany’s Manufacturing PMI for May 2024 - Forecast 45.4, versus 45.4 previous.
- Euro Zone Manufacturing PMI for May 2024 – Forecast 47.4, versus 47.6 previous.
- US Manufacturing PMI for May 2024 – Forecast 50.9, versus 50.9 previous.
- US ISM Manufacturing Index for May 2024 – Forecast 49.8, versus 49.2 previous.
Japan’s PMI manufacturing, finalized at 50.4, above neutral mark for first time in a year
Japan's PMI Manufacturing index was finalized at 50.4 in May, up from 49.6 in April, crossing the 50 neutral mark for the first time in a year. S&P Global noted that both output and new orders remained broadly stable, while employment and input stocks saw expansion.
Pollyanna De Lima at S&P Global Market Intelligence highlighted the "encouraging trends" in the manufacturing industry, noting that new orders and output were stable, and businesses were optimistic about the year ahead. She mentioned that input stocks increased as materials ordered in recent months arrived, which bodes well for production and suggests a gradual near-term recovery.
Factory employment also rose but continued to be affected by retirements and difficulties in finding suitable replacements. Another challenge faced by manufacturers was the intensification of cost pressures due to yen depreciation, which strained the prices of imported items. This, along with rising wage costs, led to the sharpest increase in output charges in a year. De Lima pointed out that this is concerning given the subdued domestic and external demand.
Trade of the Week (June 3-7)
Hey guys! For the first week in the month of June, there sure is a lot of market adjustments expected due to the fact that it serves as the start of a new month candle as well. To prep everyone for some quality trading opportunities this week, I will be sharing my views on GBPNZD as the Trade of the Week.
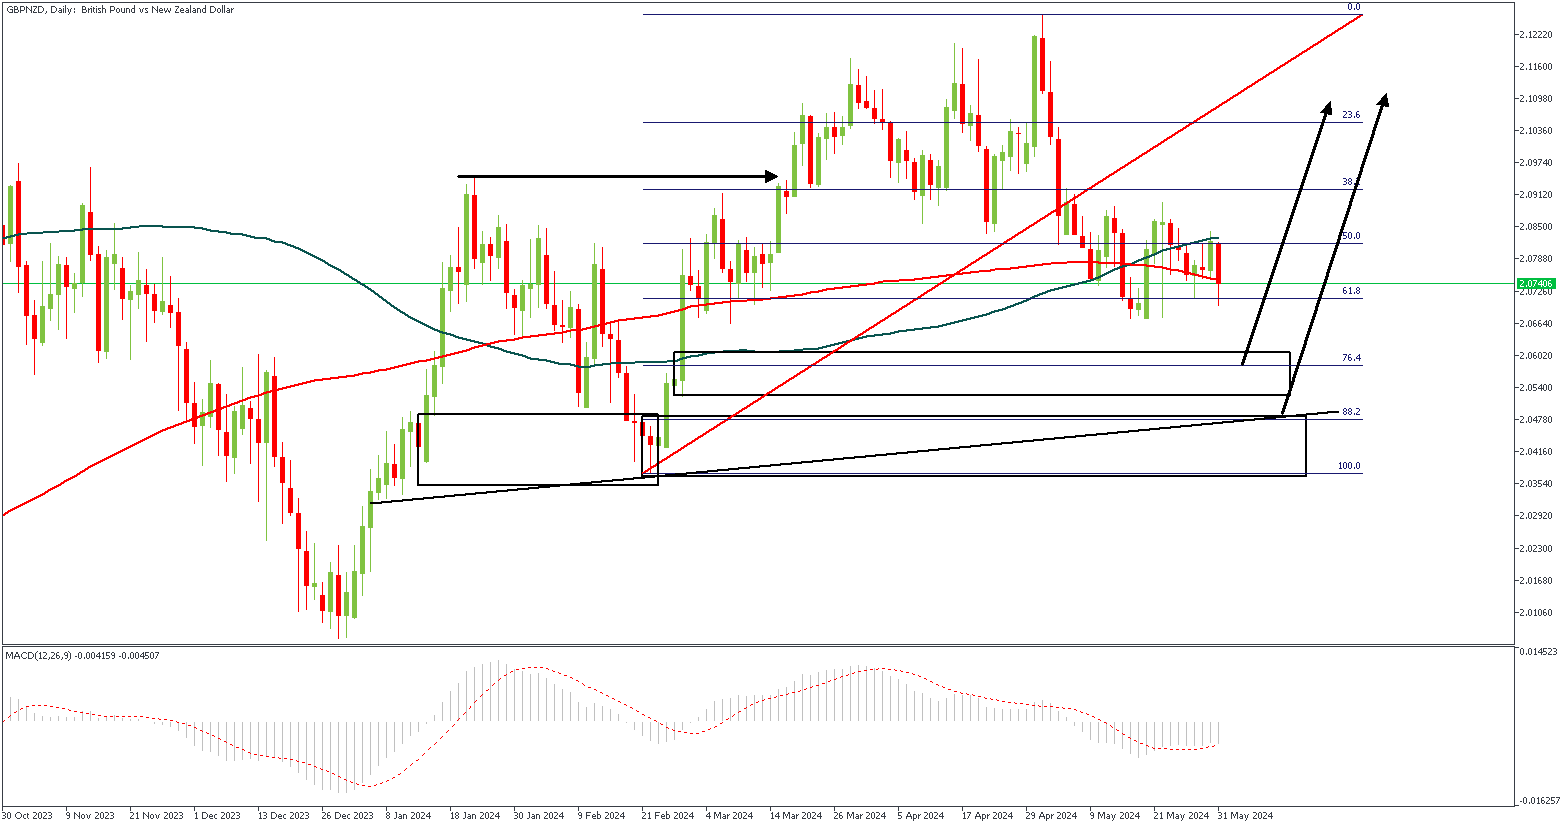
GBPNZD – D1 Timeframe
GBPNZD on the daily timeframe clearly broke above the previous high at the highlighted region (based on the horizontal arrow), creating an impulse move that I have carefully used to map out a Fibonacci retracement analysis. The Fibonacci retracement tool reveals that price may be expected to experience a bullish rally based on the overlap of the demand zone and the key Fibonacci levels. The presence of a trendline support adds further confirmation to the bullish sentiment.
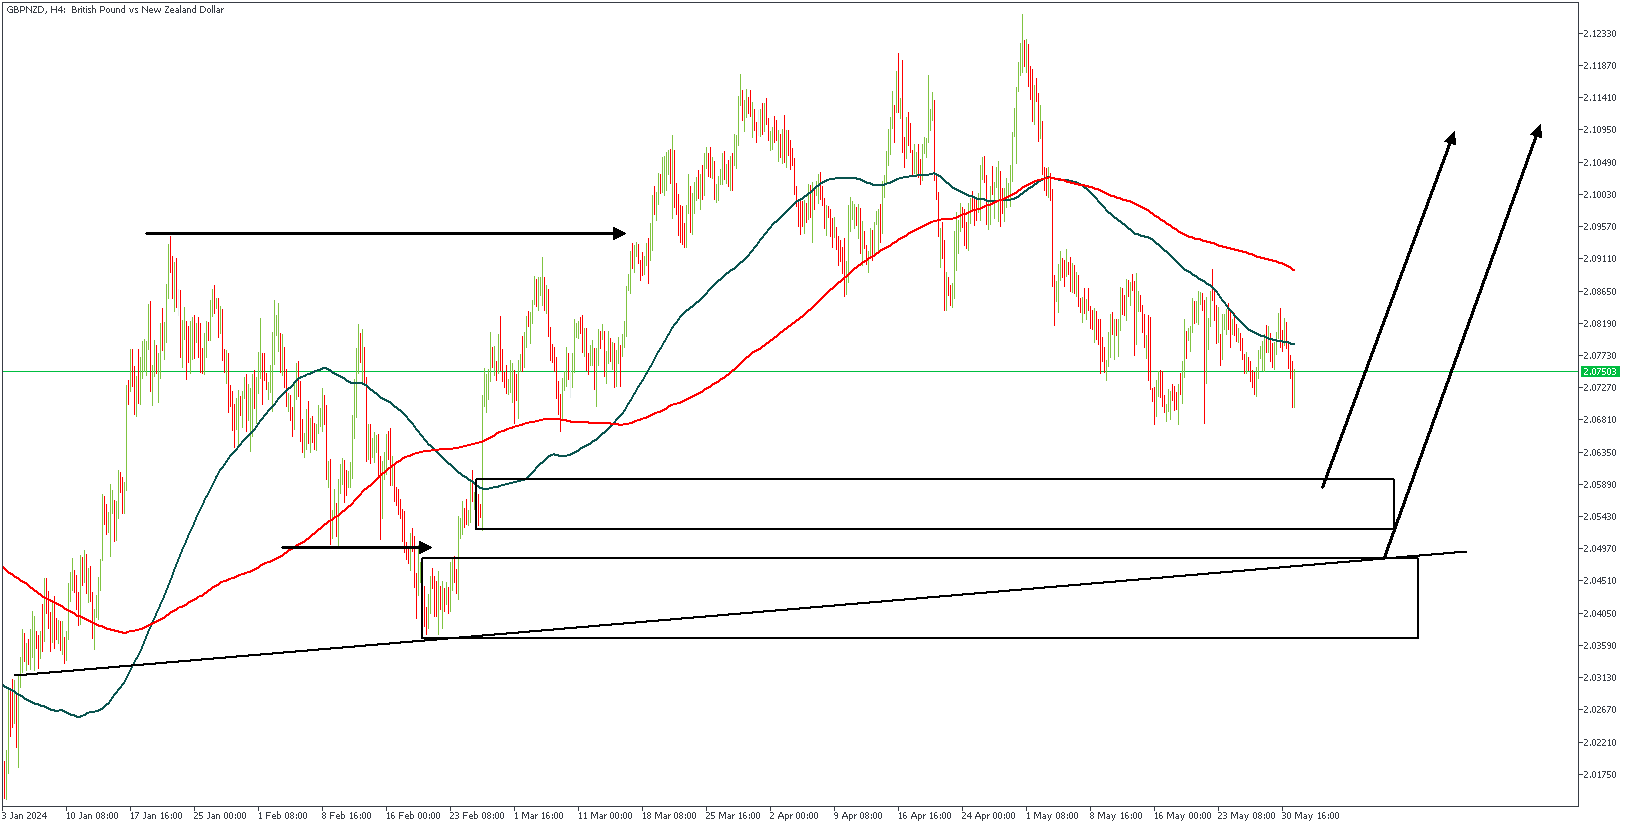
GBPNZD – H4 Timeframe
GBPNZD on the 4-hour timeframe as seen on the chart is currently printing a QMR pattern. The two horizontal arrows depict the points of the sweep and the break of structure. In line with the higher timeframe sentiment (from the daily timeframe chart above), I believe the presence of a QMR patter on the 4-hour timeframe pretty much completes the puzzle.
Analyst’s Expectations:
- Direction: Bullish
- Target: 2.11600
- Invalidation: 2.03258
.
CONCLUSION
The trading of CFDs comes at a risk. Thus, to succeed, you have to manage risks properly. To avoid costly mistakes while you look to trade these opportunities, be sure to do your due diligence and manage your risk appropriately.
WTT: What To Trade in June
Hey guys! Here comes June, and here, as usual, I share a few interesting trade ideas, and opportunities to capitalize on for profits. Here in this short piece, I present 3 pairs that are currently on my radar for the month of June. Be sure to do your due diligence, and avoid trading into moments of increased volatility if you’re incapable of handling such situations. Cheers!
AUDNZD – D1 Timeframe
AUDNZD on the daily timeframe is currently resting on a confluence of the 100 and 200-day moving averages. This means we can expect some bullish pressure in the market soon, after which, based on the recent break below the previous low, I anticipate a resumption of the bearish trend. The Fibonacci retracement level, rally-base-drop supply zone, and the break of structure are my confluence for this sentiment.
Analyst’s Expectations:
- Direction: Bearish
- Target: 1.08584
- Invalidation: 1.10336

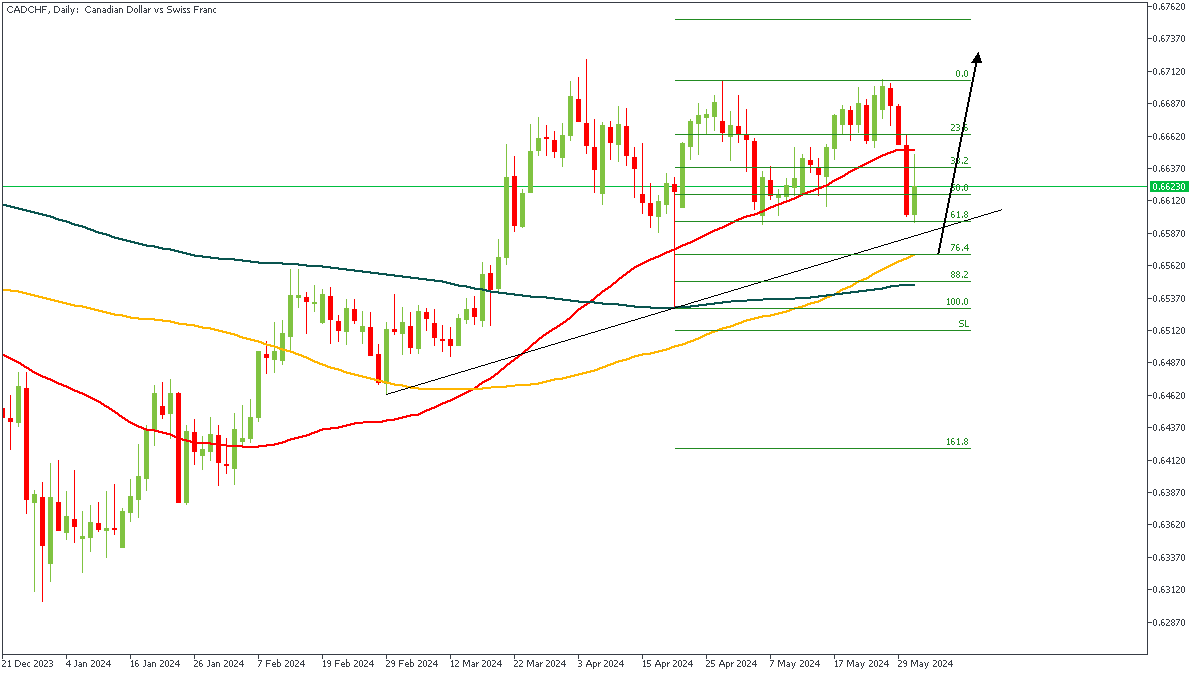
CADCHF – D1 Timeframe
CADCHF on the daily timeframe seems bullish, as indicated by the bullish array of the moving averages. Following this, we can see the trendline support, and how it aligns perfectly with the drop-base-rally demand zone from the wick of the highlighted candlestick. All of these factors add up to convince me in favor of a bullish sentiment.
Analyst’s Expectations:
- Direction: Bullish
- Target: 0.66679
- Invalidation: 0.65275
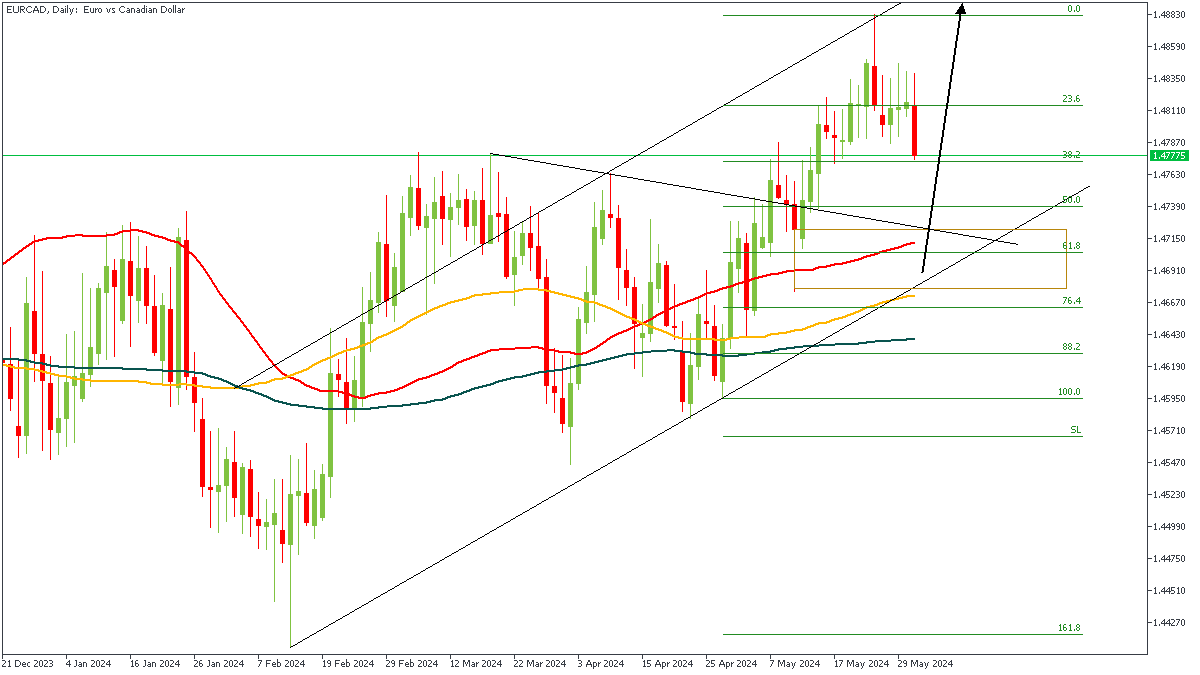
EURCAD – D1 Timeframe
I know this EURCAD chart may look somewhat like a construction drawing, but trust me, it is a valid analysis. Firstly, we have price getting rejected off the trendline resistance of an equidistant channel, following a break of structure above the previous high. Secondly, we see the previous trendline resistance that price broke, which I expect to now act as an area of support. And lastly, we see the drop-base-rally demand zone, moving average supports, as well as the Fibonacci retracement levels converging around the same area – these serve as a confluence for the bullish sentiment.
Analyst’s Expectations:
- Direction: Bullish
- Target: 1.48120
- Invalidation: 1.45930
CONCLUSION
The trading of CFDs comes at a risk. Thus, to succeed, you have to manage risks properly. To avoid costly mistakes while you look to trade these opportunities, be sure to do your due diligence and manage your risk appropriately.