Sample Category Title
Yen Rises Slightly, Yet Struggles to Gain Strong Momentum
The forex markets are showing relatively limited movement today, remaining mostly within established ranges. Yen is having a slight uptick, supported by the dips in US and European benchmark treasury yields. But the Japanese currency' gains are modest and insufficient to reverse recent declines. Meanwhile, Swiss Franc is charting a notable course as the day's second-strongest performer, showing some progress in its near-term recovery against the Euro and Sterling.
Conversely, Euro and Sterling are trailing today, marked as the weaker performers, with Dollar also lagging slightly behind. Commodity currencies are finding themselves in a middling position, with New Zealand Dollar slightly outperforming its peers.
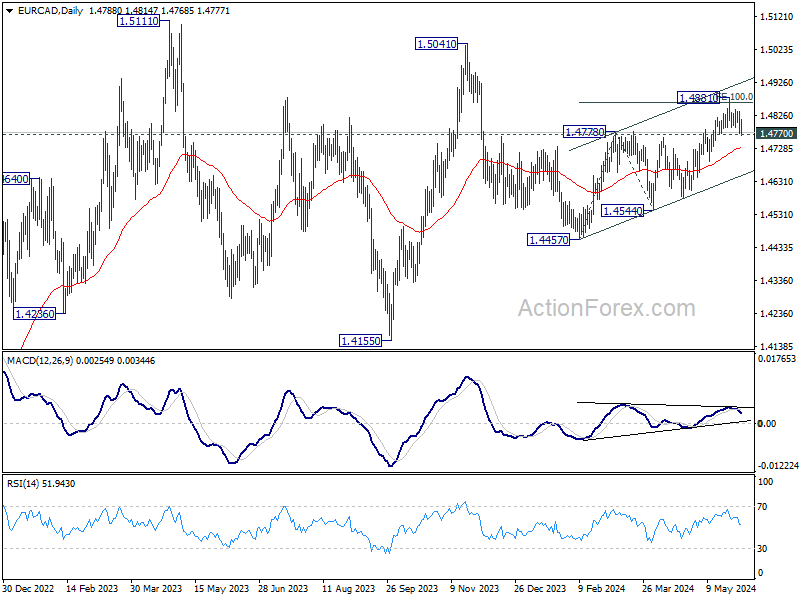
Technically, focus stays on 1.4770 minor support in EUR/CAD. Firm break there will argue that corrective rise from 1.4457 has completed with three waves up to 1..4881. Further break of 55 D EMA (now at 1.4731) will affirm this bearish case and target 1.4554 support first. Nevertheless, firm break of 1.4881 will resume the rise from 1.4457 towards 1.5041 resistance instead. The upcoming BoC and then ECB rate decisions would be be pivotal in determining the next significant movement in EUR/CAD.
In Europe, at the time of writing, FTSE is up 0.34%. DAX is up 0.93%. CAC is up 0.50%. UK 10-year yield is down -0.0504 at 4..271. Germany 10-year yield is down -0.060 at 2.612. Earlier in Asia, Nikkei rose 1.13%. Hong Kong HSI rose 1.79%. China Shanghai SSE fell -0.27%. Singapore Strait Times rose 0.37%. Japan 10-year JGB yield fell -0.0062 to 1.068.
UK PMI manufacturing finalized at 51.2, a solid revival
UK PMI Manufacturing index was finalized at 51.2 in May, up from April's 49.1, marking the highest reading since July 2022. S&P Global noted that output increased across all main sub-sectors and size categories, and business optimism soared to a 27-month high.
Rob Dobson, Director at S&P Global Market Intelligence, described May's performance as a "solid revival" of activity in the UK manufacturing sector. Production and new business levels both rose at their fastest rates since early 2022. The recovery's breadth was notable, with concurrent output and new order growth across all main sub-industries—consumer, intermediate, and investment goods—and all company size categories for the first time in over two years.
However, the latest PMI survey data presented a mixed picture for price pressures. Output charge inflation at the factory gate strengthened for the fifth consecutive month, reaching its highest level in a year. Despite this, there was a solid easing in the rate of increase in input costs, which should help prevent price pressures from becoming entrenched.
Eurozone PMI manufacturing finalized at 47.3, a turning point?
Eurozone PMI Manufacturing index was finalized at 47.3 in May, up from April's 45.7 and reaching a 14-month high. This improvement suggests a potential turning point for the manufacturing sector, which has been declining since April 2023.
Country-specific data reveals that Greece led with a PMI of 54.9, although this marked a 4-month low. Spain followed with 54.0, hitting a 26-month high, while the Netherlands posted a 21-month high of 52.5. France recorded a 3-month high at 46.4, and Austria saw a 15-month high at 46.3. Italy and Germany, however, showed lower figures with PMIs of 45.6 and 45.4, respectively, though both countries achieved multi-month highs.
Cyrus de la Rubia, Chief Economist at Hamburg Commercial Bank, highlighted this as a potential "turning point" for the sector, noting that the industry is nearing the end of its production decline. He pointed out that business confidence regarding future production is at its highest level since early 2022.
Germany, despite having the lowest PMI among the four major Eurozone economies, is close to overtaking Italy, which has recently seen its performance deteriorate. France's industrial sector has improved but still lags behind, while Spain remains the only Euro-4 country with a growing industrial sector.
Japan's PMI manufacturing, finalized at 50.4, above neutral mark for first time in a year
Japan's PMI Manufacturing index was finalized at 50.4 in May, up from 49.6 in April, crossing the 50 neutral mark for the first time in a year. S&P Global noted that both output and new orders remained broadly stable, while employment and input stocks saw expansion.
Pollyanna De Lima at S&P Global Market Intelligence highlighted the "encouraging trends" in the manufacturing industry, noting that new orders and output were stable, and businesses were optimistic about the year ahead. She mentioned that input stocks increased as materials ordered in recent months arrived, which bodes well for production and suggests a gradual near-term recovery.
Factory employment also rose but continued to be affected by retirements and difficulties in finding suitable replacements. Another challenge faced by manufacturers was the intensification of cost pressures due to yen depreciation, which strained the prices of imported items. This, along with rising wage costs, led to the sharpest increase in output charges in a year. De Lima pointed out that this is concerning given the subdued domestic and external demand.
China's Caixin PMI manufacturing rises to 51.7, production picks up
China's Caixin PMI Manufacturing index edged up from 51.4 to 51.7 in May, surpassing expectations of 51.5. Caixin reported that production expanded at its most pronounced pace since June 2022, with the fastest growth in purchasing activity in three years. Meanwhile, input price inflation reached a seven-month high.
Wang Zhe, Senior Economist at Caixin Insight Group, highlighted that the manufacturing sector continued to improve, with gains in supply, domestic demand, and exports. Logistics and transportation remained efficient, and businesses increased their purchase quantities and inventories, reflecting a positive outlook.
Despite these positive developments, Wang noted persistent challenges, particularly low price levels on the sales side. Additionally, employment continued to shrink as businesses remained cautious about hiring.
USD/JPY Mid-Day Outlook
Daily Pivots: (S1) 156.77; (P) 157.07; (R1) 157.58; More….
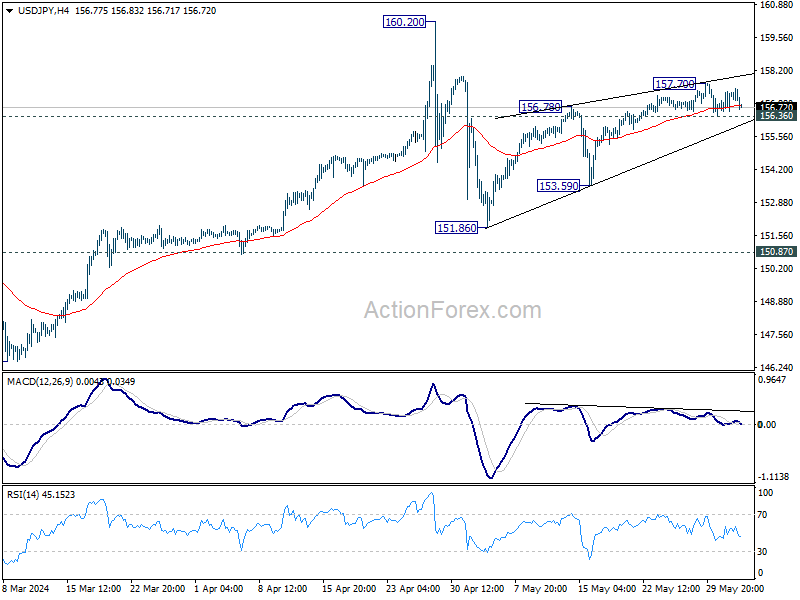
USD/JPY dips mildly today but stays in range of 156.36/157.70. Intraday bias remains neutral for the moment. On the downside, decisive break of 156.36 minor support will confirm short term topping at 157.70, on bearish divergence condition in 4H MACD. Intraday bias will be back on the downside for 153.59 support. Firm break there will target 151.86 and below as the third leg of the corrective pattern from 160.20. However, break of 157.70 will extend the rally from 151.86 towards 160.20.
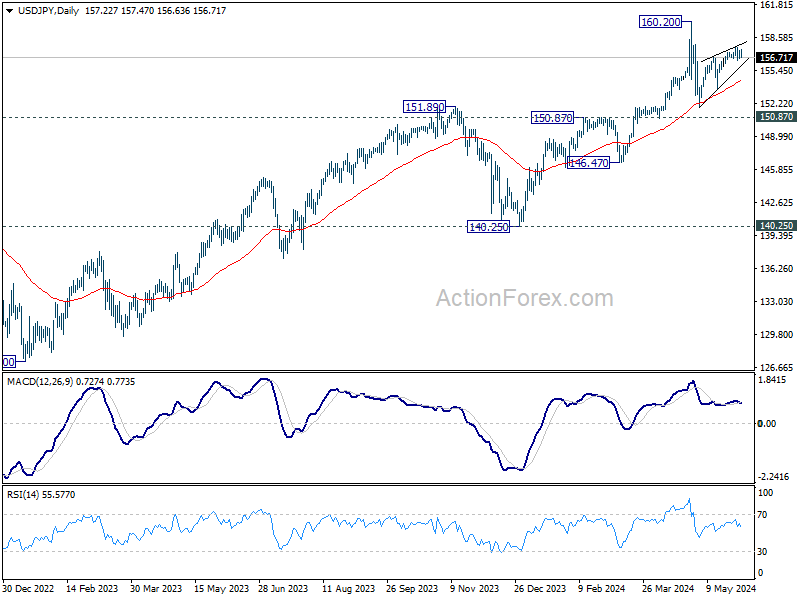
In the bigger picture, a medium term top might be formed at 160.20. But as long as 150.87 resistance turned support holds, fall from there is seen as correcting rise from 150.25 only. However, decisive break of 150.87 will argue that larger correction is possibly underway, and target 146.47 support next.
Economic Indicators Update
| GMT | Ccy | Events | Actual | Forecast | Previous | Revised |
|---|---|---|---|---|---|---|
| 23:50 | JPY | Capital Spending Q1 | 6.80% | 12.20% | 16.40% | |
| 00:30 | JPY | Manufacturing PMI May F | 50.4 | 50.5 | 50.5 | |
| 01:45 | CNY | Caixin Manufacturing PMI May | 51.7 | 51.5 | 51.4 | |
| 07:30 | CHF | Manufacturing PMI May | 46.4 | 45.4 | 41.4 | |
| 07:45 | EUR | Italy Manufacturing PMI May | 46.4 | 48 | 47.3 | |
| 07:50 | EUR | France Manufacturing PMI May F | 46.4 | 46.7 | 46.7 | |
| 07:55 | EUR | Germany Manufacturing PMI May F | 45.4 | 45.4 | 45.4 | |
| 08:00 | EUR | Eurozone Manufacturing PMI May F | 47.3 | 47.4 | 47.4 | |
| 08:30 | GBP | Manufacturing PMI May F | 51.2 | 51.3 | 51.3 | |
| 13:30 | CAD | Manufacturing PMI May | 49.4 | |||
| 13:45 | USD | Manufacturing PMI May F | 50.9 | 50.9 | ||
| 14:00 | USD | ISM Manufacturing PMI May | 49.8 | 49.2 | ||
| 14:00 | USD | ISM Manufacturing Prices Paid May | 60 | 60.9 | ||
| 14:00 | USD | ISM Manufacturing Employment Index May | 48.6 | |||
| 14:00 | USD | Construction Spending M/M Apr | 0.20% | -0.20% |
Instrument of the Week (June 3—7): EURCAD Outlook
The EURCAD pair represents the exchange rate between the Euro and the Canadian Dollar and is a vital measure of the relative economic health of the Eurozone and Canada. The Euro value is influenced mainly by economic activities and monetary policies within the Eurozone, including fiscal stability and economic growth rates of member countries such as Germany and France. At the same time, the Canadian Dollar is notably affected by fluctuations in commodity prices, oil in particular, and domestic economic policies.
Canada interest rate decision, June 5, 15:45 (GMT+2)
If the forecast that the Canadian interest rate remains steady at 5.00% is confirmed, it could strengthen the Canadian Dollar since it would reflect confidence in stability and growth. Such a scenario suggests a decrease in the EURCAD rate. However, suppose the regulator unexpectedly cuts the interest rate. In that case, it will indicate a potential economic slowdown or concerns and will likely weaken the Canadian Dollar against the Euro, causing the EURCAD rate to rise.
Eurozone interest rate decision, June 6, 14:15 (GMT+2)
If the anticipated decrease in Eurozone interest rates from 4.50% to 4.25% is confirmed, it could weaken the Euro as lower rates may reduce the currency’s attractiveness to yield-seeking investors. This would likely depress the EURCAD rate. Conversely, if the rate remained steady or increased contrary to expectations, it would signal a more robust economic outlook or rising inflation concerns. In this case, the Euro could strengthen, potentially elevating the EURCAD rate.
European Central Bank press conference, June 6, 14:45 (GMT+2)
A dovish tone at this press conference, confirming the rate cut and expressing concerns about the economic outlook, would likely pressure the Euro downwards against the Canadian dollar. On the other hand, a hawkish tone from the ECB, suggesting robust economic health or a reduction in financial risks, could boost the Euro’s value, leading to an increase in the EURCAD exchange rate.
In the daily timeframe, EURCAD has formed inverse head and shoulders in a long-term uptrend. The price has reached an important resistance at 23.6 Fibonacci, and despite the bullish sentiment, two possible scenarios should be considered.
- If the bulls push EURCAD above the resistance at 1.4840, we can expect a rise to 1.4940;
- However, if the price rebounds from the resistance, it could fall to 1.4700, corresponding to 38.2 Fibonacci.

WTI Oil Price Unchanged After OPEC+ Meeting
The OPEC+ meeting over the weekend did not have a substantial impact on the price of crude oil. As the chart shows, WTI oil opened today at $76.72 per barrel, while on Friday it closed at $76.57 – indicating that the decision made by oil producers is ambiguous.
The bullish argument is that restrictions on oil production to maintain its price will continue. According to Reuters, on Sunday, OPEC+ members agreed to extend the production cuts of 3.66 million barrels per day until the end of 2025.
The bearish argument is that eight OPEC+ countries have already signalled plans to gradually phase out voluntary cuts of 2.2 million barrels per day from October 2024 to September 2025.
Goldman Sachs analysts overall assessed the results of the meeting as more bearish for the market. "The communication of a gradual unwind reflects a strong desire to bring back production of several members given high spare capacity," they wrote.
The WTI crude oil chart shows that the market is breaking the upward trend (shown in blue), which we mentioned in our review on 10 May.
Since then, bulls attempted to resume the upward trend, but this only resulted in a false breakout of the psychological level of $80 per barrel on 29 May (indicated by an arrow).
Afterwards, bears regained control and sharply pushed the price below the lower boundary of the blue upward channel, making the downward channel (shown in red), which began in April, more relevant.
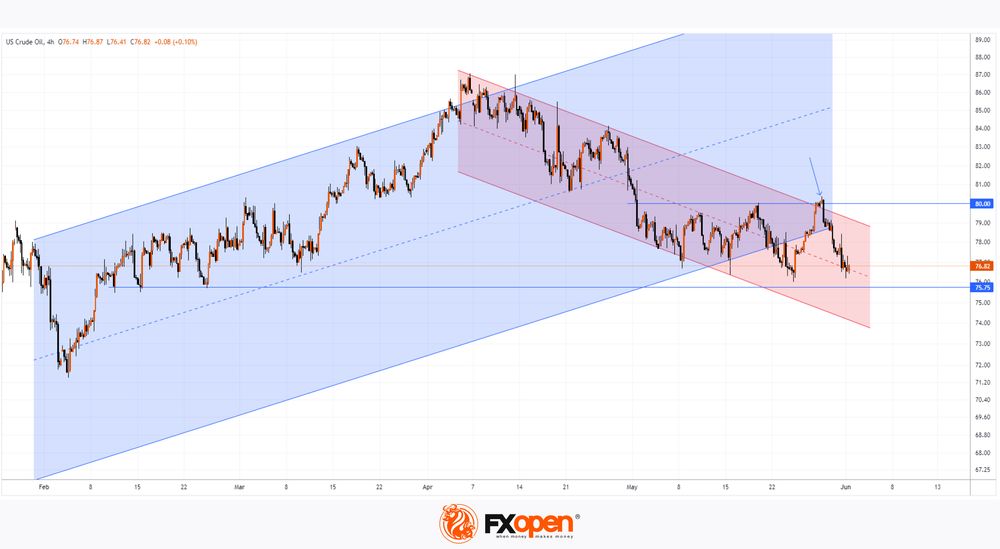
According to the technical analysis of the oil chart:
→ the price is near the median line of the red channel – a sign of temporary equilibrium between supply and demand;
→ below the current WTI crude oil price is an important level of $75.75, which provided support back at the end of winter.
If the bulls attempt a comeback (which would require fundamental drivers), the upper boundary of the downward channel may resist the price.
If the geopolitical situation in the Middle East does not escalate, the bears may continue to exert pressure aiming to break the $75.75 level – which would likely slow inflation and benefit the current U.S. administration ahead of the upcoming presidential elections.
Start trading commodity CFDs with tight spreads. Open your trading account now or learn more about trading commodity CFDs with FXOpen.
This article represents the opinion of the Companies operating under the FXOpen brand only. It is not to be construed as an offer, solicitation, or recommendation with respect to products and services provided by the Companies operating under the FXOpen brand, nor is it to be considered financial advice.
EUR/USD: Eases on Weaker Demand, Markets Await ECB’s Verdict
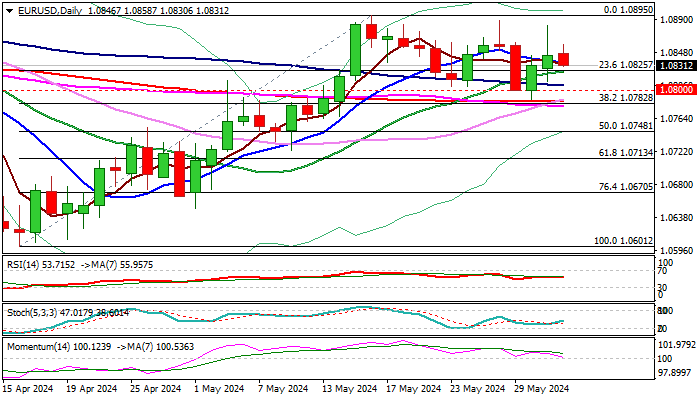
The Euro started to lose traction in European trading on Monday, adding to initial warning from Friday’s daily candle with long upper shadow, which was formed after strong upside rejection.
Initial signal of two-day recovery stall was boosted by a double-top formation on hourly chart (1.0858).
Fresh weakness needs to clear pivotal support at 1.0825 (20DMA) to add to downside prospects.
Daily studies are mixed as 14-d momentum is heading south and MA’s remain in bullish setup, though near-term bias expected to remain with bulls while the price stays above 20DMA and larger bulls to remain in play above daily cloud top / 200DMA (1.0791/85).
Weekly long-legged Doji candle also contribute to uncertain near-term outlook.
Fundamentals are expected to play significant role this week, as markets focus on EU PMI’s, reports from the US labor sector and key event of the week – ECB policy meeting, with wide expectations for the first rate cut.
Markets will also closely watch ECB’s comments and economic projections, to get more details about the central bank’s action on monetary policy in coming months..
Res: 1.0858; 1.0882; 1.0895; 1.0942.
Sup: 1.0825; 1.0810; 1.0785; 1.0748.
EUR/USD Calm as Eurozone Manufacturing Improves
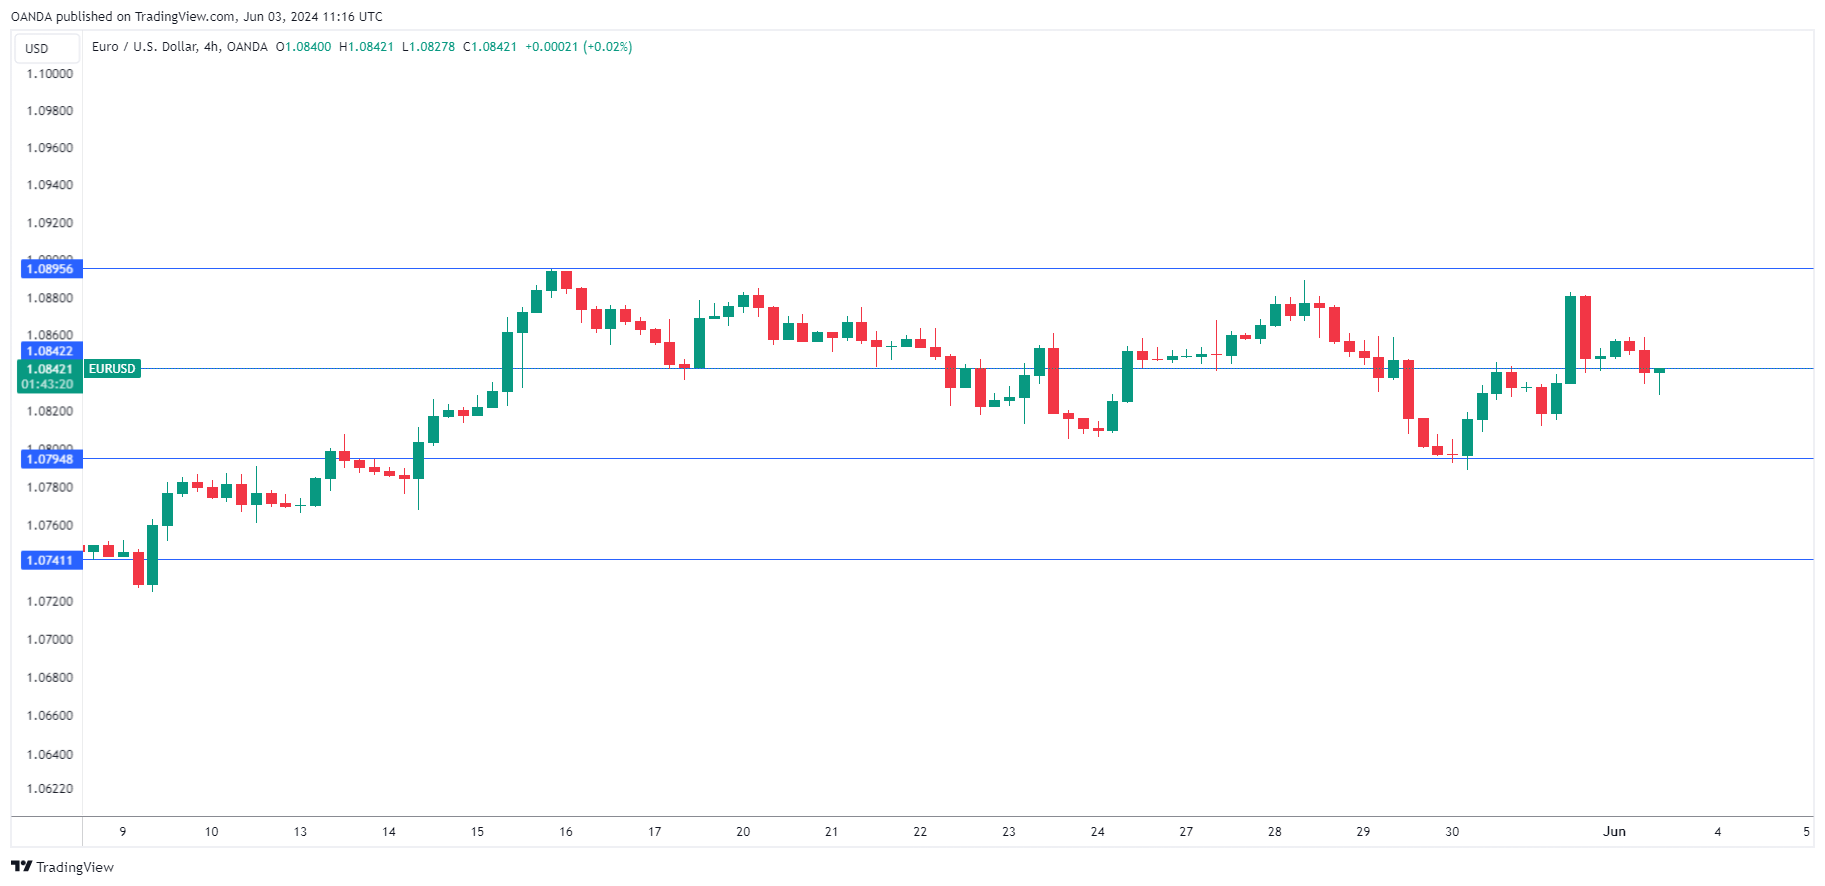
The euro has posted slight losses on Monday. EUR/USD is trading at 1.0835 in the European session, down 0.11% on the day.
Eurozone manufacturing close to stabilizing
The eurozone manufacturing sector is still contracting but there is light at the end of the tunnel. The manufacturing PMI rose to 47.3 in May, up from 45.7 in April and just shy of the market estimate of 47.4. The reading was the highest in 14 months. Business confidence in future manufacturing conditions also rose and hit its highest level in more than two years.
Germany, the largest economy in the eurozone, also saw a softer contraction in manufacturing production. Manufacturing PMI accelerated to 45.4, up from 42.5 in April and in line with expectations. The eurozone and Germany release services PMIs on Tuesday, with both releases expected to show growth.
It could be a historic week for the European Central Bank, which is widely expected to lower interest rates at Thursday’s meeting for the first time since March 2016. The ECB’s steep rate-tightening cycle has seen inflation fall from double-digits to the current rate of 2.6%. This is still above the ECB’s target of 2%, but the central bank is sufficiently confident that inflation won’t rebound after a rate cut. The May CPI report, released last week, showed that headline and core CPI accelerated unexpectedly, but that is unlikely to derail the expected decision to lower rates.
The US released the Personal Consumption Expenditure price index, the Federal Reserve’s favorite inflation indicator, on Friday. The indicator was unchanged at 2.7% y/y and 0.3% m/m in line with expectations. This points to inflation remaining sticky as the Fed tries to push it down to the 2% target.
EUR/USD Technical
- EUR/USD is testing support at 1.0842. Below, there is support at 1.0741
- 1.0895 and 1.0943 are the next lines of resistance
EURCHF Declines Sharply from 14-Month High
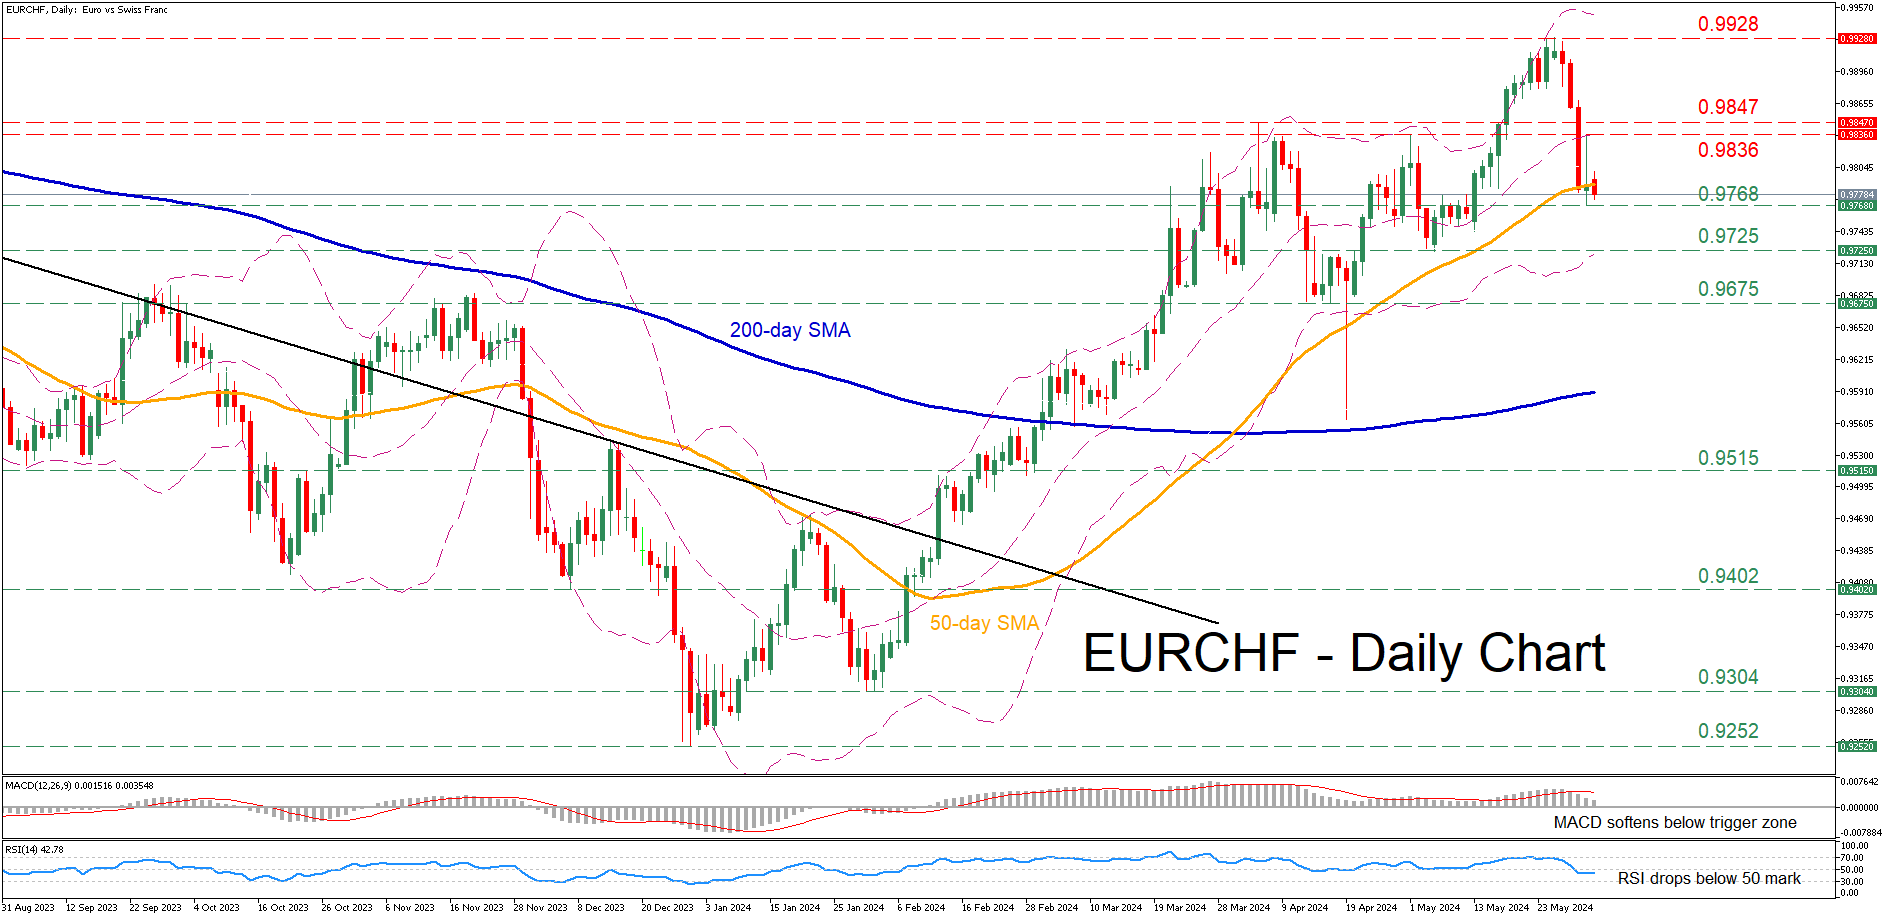
- EURCHF hits a fresh 14-month high of 0.9928
- Before plunging towards the 50-day SMA
- Momentum indicators turn bearish
EURCHF has been in a steady recovery since late December, attempting to erase its massive 2021-2023 downtrend. Last week, the pair surged to a fresh 14-month peak of 0.9928, but quickly retraced lower until the 50-day simple moving average (SMA) curbed its retreat.
If the recent weakness persists, the pair could violate the 50-day SMA and challenge the recent support of 0.9768. Further declines could then come to a halt at the May bottom of 0.9725. Even lower, the April support of 0.9675 might provide downside protection.
Alternatively, should the bulls regain control, immediate resistance could be found at 0.9836, which prevented the bulls from drifting further north on May 1. Higher, the April peak of 0.9847 could prove to be the next barricade for the price to overcome. A violation of that zone may pave the way for the 14-month high of 0.9928.
In brief, EURCHF experienced a strong pullback following its 14-month high of 0.9928, but the 50-day SMA appears to be holding its ground for now. Meanwhile, the pair could exhibit heightened volatility in the upcoming days as markets are bracing for the ECB’s rate decision on Thursday.
Gold on a Slippery Slope
- Gold tries to enter Ichimoku cloud
- Prices stand in short-term sideways move
- Momentum oscillators lose steam
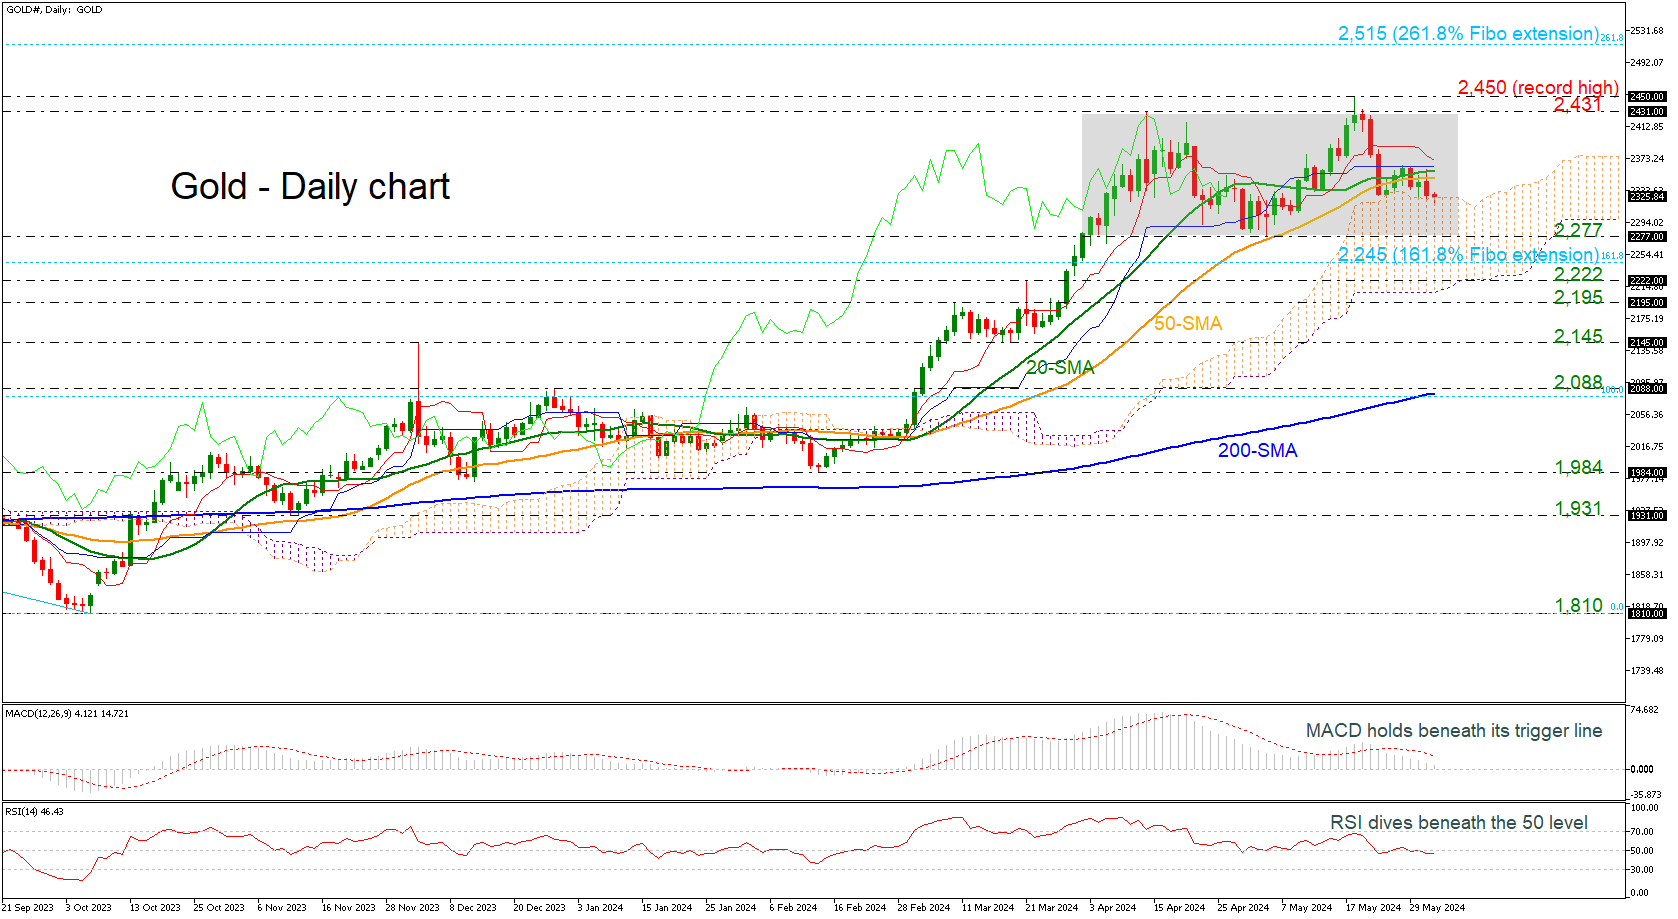
Gold prices are currently capped by the 20- and the 50-day simple moving averages (SMAs), remaining within the short-term consolidation area of 2,277 and 2,431.
In the near-term, the market could maintain a sideways move if the RSI keeps moving beneath 50 and the blue Kijun-sen line, hold flat. Regarding the trend, this is likely to remain on the downside as the MACD continues to lose strength below its trigger line and near the zero level.
If the commodity weakens, the 2,277 level could provide immediate support ahead of the 2,245 Fibonacci extension level of the down leg from 2,079 to 1,810. Even lower, the 2,222 barrier could attract greater attention as any leg lower could worsen the market’s bearish outlook, opening the way towards the 2,195 mark.
If there is an extension to the upside and above the short-term SMAs as well as the Ichimoku lines, resistance could run towards the 2,431 hurdle, which is the upper level of the trading range. Steeper increases could also reach the record high of 2,450.
Regarding the near-term picture, neutral sentiment deteriorated after the downfall from 2,431 and only a move above the all-time high could now help the market to return to a positive mode.
To summarize, gold looks neutral in the short-term, while in the long-term the picture is seen as bullish unless the price breaks below the 200-day SMA at 2.082.
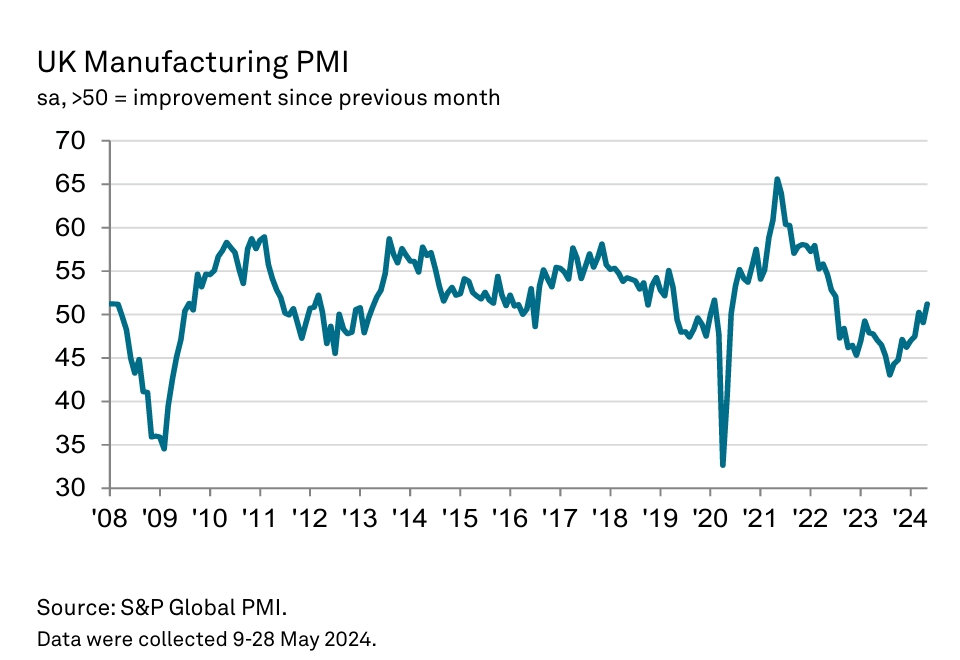
UK PMI manufacturing finalized at 51.2, a solid revival
UK PMI Manufacturing index was finalized at 51.2 in May, up from April's 49.1, marking the highest reading since July 2022. S&P Global noted that output increased across all main sub-sectors and size categories, and business optimism soared to a 27-month high.
Rob Dobson, Director at S&P Global Market Intelligence, described May's performance as a "solid revival" of activity in the UK manufacturing sector. Production and new business levels both rose at their fastest rates since early 2022. The recovery's breadth was notable, with concurrent output and new order growth across all main sub-industries—consumer, intermediate, and investment goods—and all company size categories for the first time in over two years.
However, the latest PMI survey data presented a mixed picture for price pressures. Output charge inflation at the factory gate strengthened for the fifth consecutive month, reaching its highest level in a year. Despite this, there was a solid easing in the rate of increase in input costs, which should help prevent price pressures from becoming entrenched.
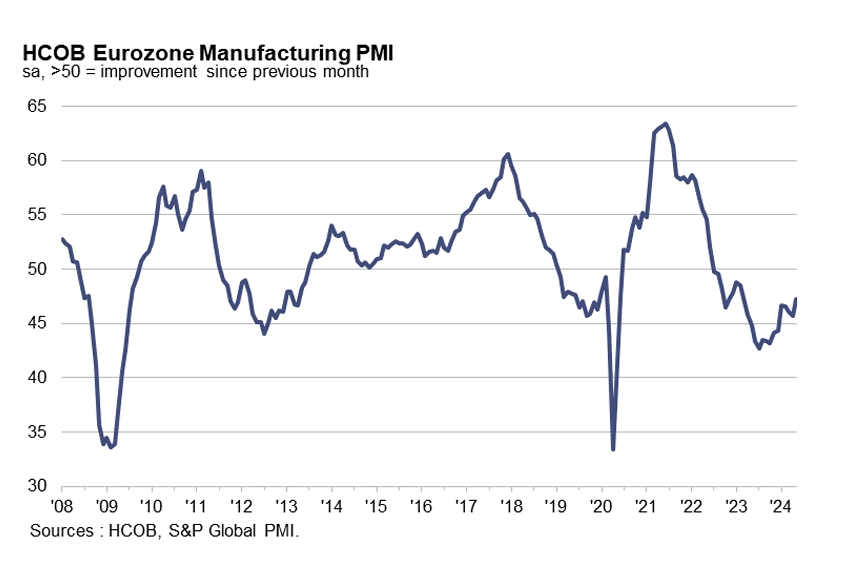
Eurozone PMI manufacturing finalized at 47.3, a turning point?
Eurozone PMI Manufacturing index was finalized at 47.3 in May, up from April's 45.7 and reaching a 14-month high. This improvement suggests a potential turning point for the manufacturing sector, which has been declining since April 2023.
Country-specific data reveals that Greece led with a PMI of 54.9, although this marked a 4-month low. Spain followed with 54.0, hitting a 26-month high, while the Netherlands posted a 21-month high of 52.5. France recorded a 3-month high at 46.4, and Austria saw a 15-month high at 46.3. Italy and Germany, however, showed lower figures with PMIs of 45.6 and 45.4, respectively, though both countries achieved multi-month highs.
Cyrus de la Rubia, Chief Economist at Hamburg Commercial Bank, highlighted this as a potential "turning point" for the sector, noting that the industry is nearing the end of its production decline. He pointed out that business confidence regarding future production is at its highest level since early 2022.
Germany, despite having the lowest PMI among the four major Eurozone economies, is close to overtaking Italy, which has recently seen its performance deteriorate. France's industrial sector has improved but still lags behind, while Spain remains the only Euro-4 country with a growing industrial sector.
EURUSD Neutral in Short-Term But Still Bullish in Medium-Term
- EURUSD rebounds off 1.0800 and 200-day SMA
- Trades within narrow range
- MACD and RSI lack direction
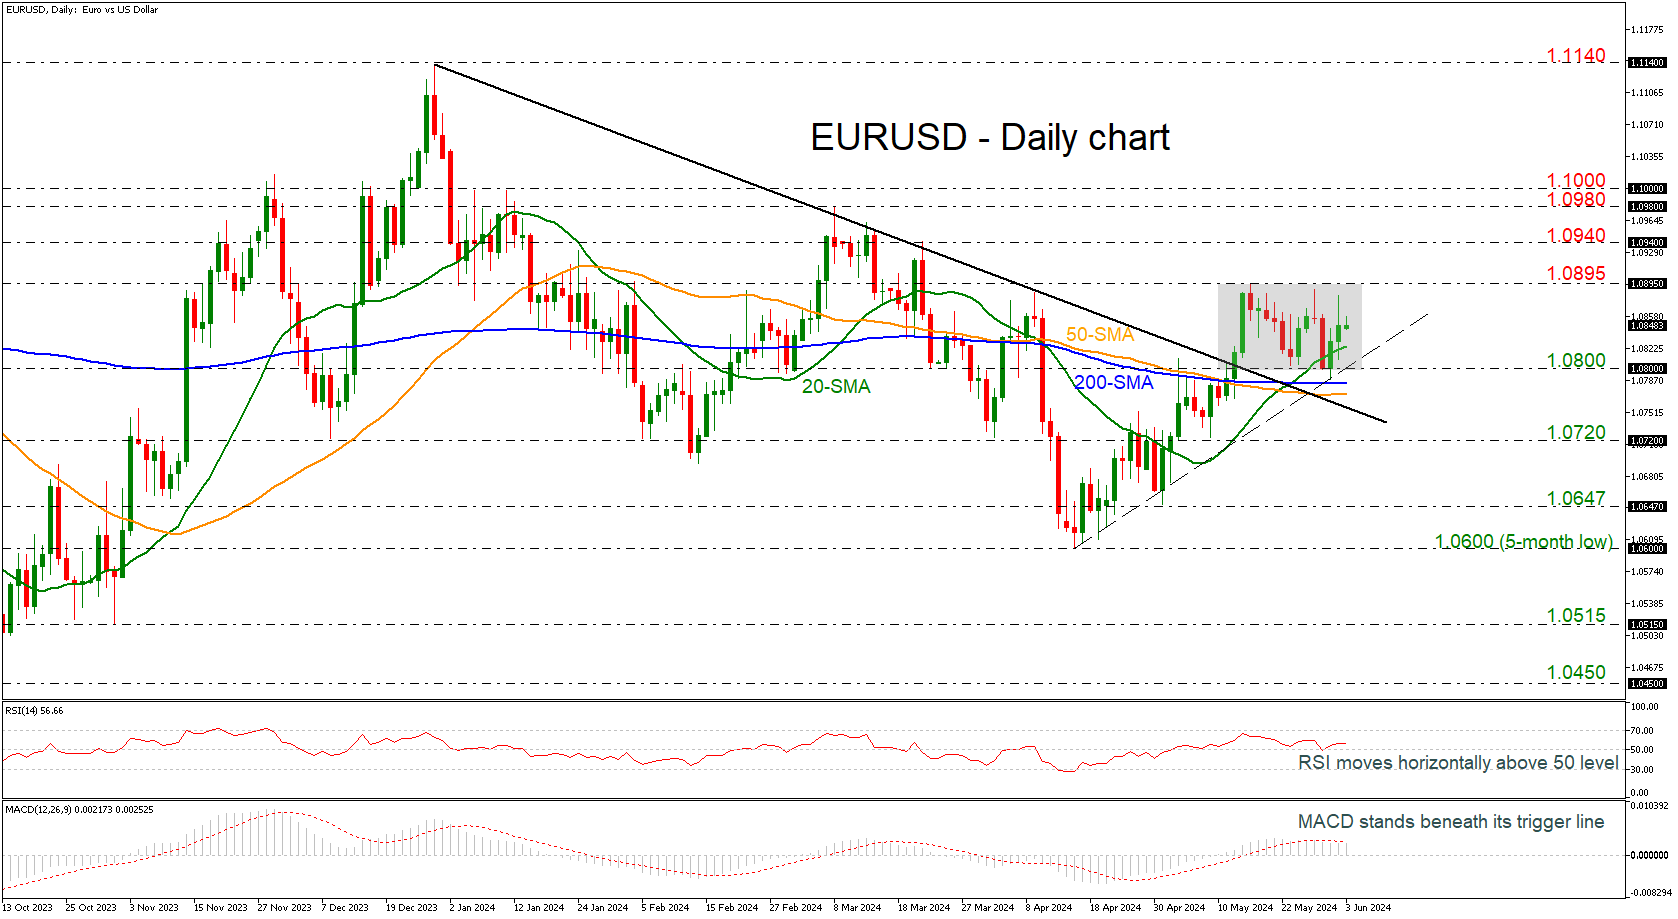
EURUSD is currently moving sideways within a two-week consolidation area with upper boundary the 1.0895 resistance and lower boundary the 1.0800 round number.
Looking at the momentum indicators, the RSI is lacking direction slightly above the neutral threshold of 50, suggesting that the market could keep consolidating in the near term. The MACD also supports this view in the positive territory but is currently embraced by its red signal line.
Should the pair manage to strengthen its positive momentum, the next resistance could come around the 1.0900 psychological level. A break above it would shift the bias to a more bullish one and open the way towards the 1.0940 bar and the restrictive region of 1.0980-1.1000.
However, if prices are unable to break to the upside the trading range in the next few sessions, the risk would shift back to the downside with the 1.0800 support and the 200- and the 50-day simple moving averages (SMAs) at 1.0785 and 1.0770. A drop below the medium-term descending trend line would signal a resumption of the bearish move, meeting the 1.0720 mark.
All in all, EURUSD is looking neutral to bullish in the short-term timeframe as it is still developing above the medium-term downtrend line and the SMAs.