
Sample Category Title
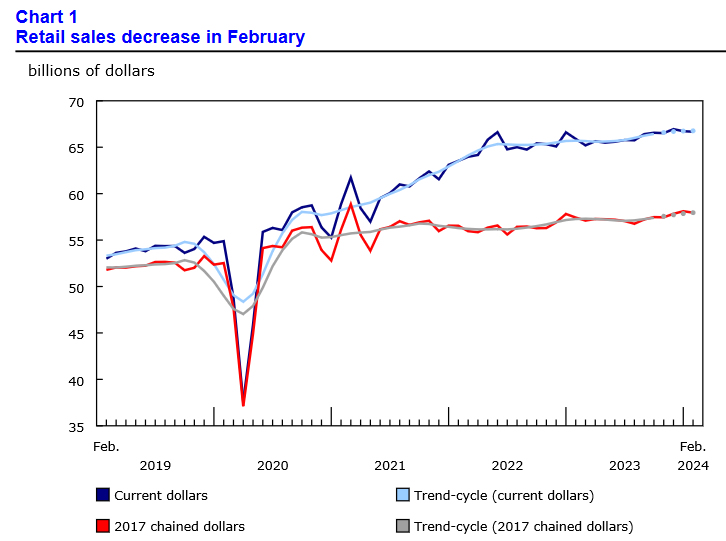
Canada’s retail sales down -0.1% mom in Feb
Canada's retail sales fell -0.1% mom to CAD 66.7B in February, worse than expectation of 0.1% mom rise. Sales were down in five of nine subsectors and were led by decreases at gasoline stations and fuel vendors (-2.2% mom).
Core retail sales, which exclude gasoline stations and fuel vendors and motor vehicle and parts dealers, were unchanged for the month.
Advance estimate indicates that retail sales was unchanged in March.
Will BoJ Disappoint Once Again?
- BoJ manages to upset the market even with historic hike
- Yen tumbles to 34-year low even as market prices in summer hike
- Will another disappointment trigger yen intervention?
- The Bank meets on Friday at 03:00 GMT
To stand pat after historic hike
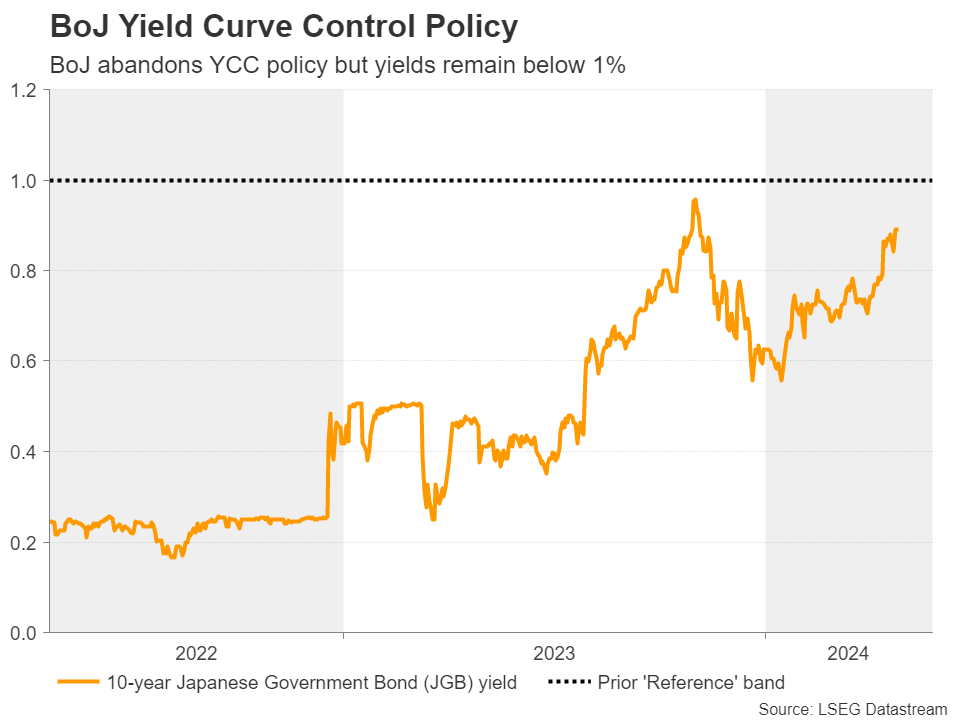
The Bank of Japan (BoJ) is very likely to keep interest rates untouched on Friday following a historic decision last month to take borrowing costs out of negative territory and to abolish its yield curve control policy.
However, even that historic move came as a disappointment to investors who continued selling the yen and triggering intervention warnings by Japanese authorities. Back then, the Bank said that they will continue buying bonds with broadly the same amounts as before, while Governor Ueda noted that they will maintain accommodative policy conditions, and thus market participants continued to believe that any subsequent hikes will be very gradual and slow. Just after the decision, they were expecting the next 10bps hike to be delivered in September or October.
Yen, Ueda, inflation, and wages
Although the market brought forward that timing to July, the yen continued to tumble, with dollar/yen flirting for more than a week now with the 155.00 psychological zone. Initially, Governor Ueda said that the central bank would not directly respond to currency moves, but on Thursday he appeared a little bit more hawkish, noting that the central bank may raise interest rates again if the yen’s declines result in accelerating inflation, adding that they could begin reducing their huge bond buying at some point in the future.
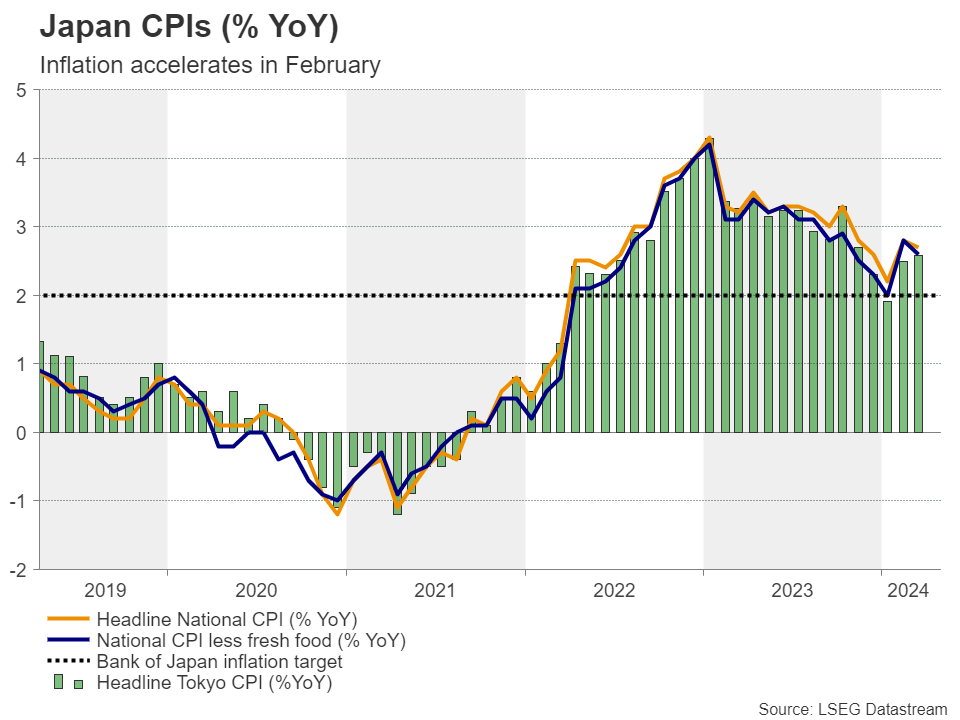
Inflation data showed that both the headline and core CPI rates rebounded strongly in February. Although they ticked down in March, the rebound in February and the yen’s depreciation suggest that the Bank may revise upward its inflation projections.
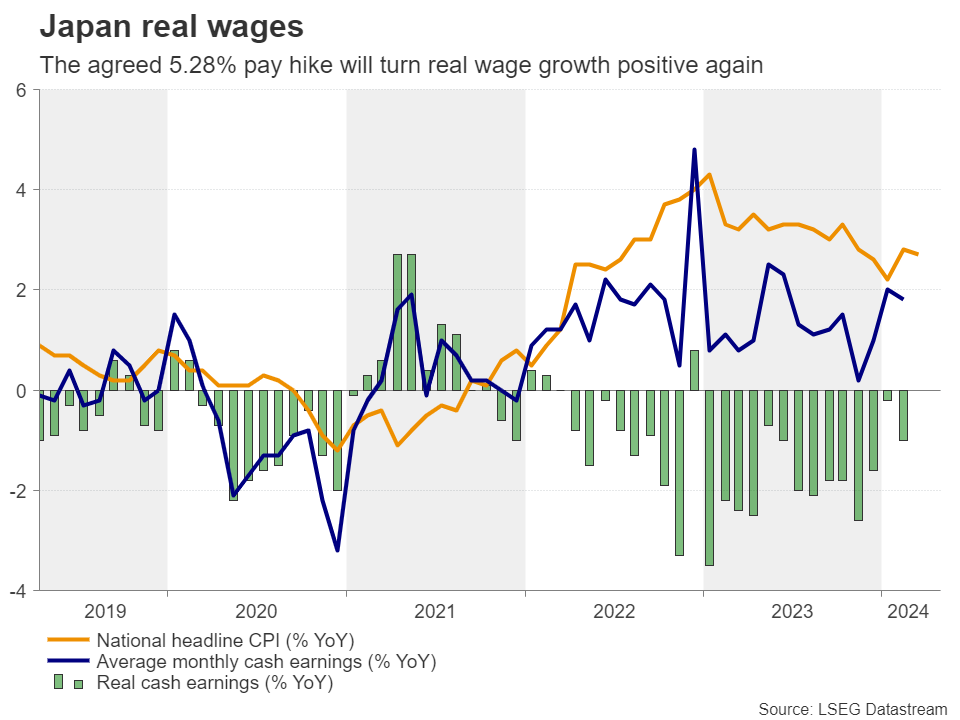
Taking all that into account, and also that the spring wage negotiations concluded with the nation’s biggest companies agreeing to the heftiest pay hikes in 33 years, investors may be on the lookout for any clues and hints about how likely a summer hike is.
 BoJ tends to upset market expectations
Having said all that though, the BoJ has been disappointing hawkish market expectations for a while now, and if this is the case on Friday as well, the yen is likely to continue losing ground against the greenback, especially if this week’s US data weigh further on Fed rate cut expectations.
A break above 155.00 may revive concerns about intervention by Japanese authorities, if they don’t act already of course. However, a closer examination of the officials’ stance suggests that they could wait for a while longer before opening the discussion about intervening again as they have been repeatedly highlighting that they will respond if the moves are speculative and do not reflect fundamentals. Indeed, they have been quiet lately as the latest leg south in the yen was driven by fundamental forces.
Will dollar/yen aim for 160.00?
From a technical perspective, dollar/yen has been printing higher highs and higher lows since December 28, while a longer-term uptrend is marked by a valid trendline drawn from the low of January 16, 2023.
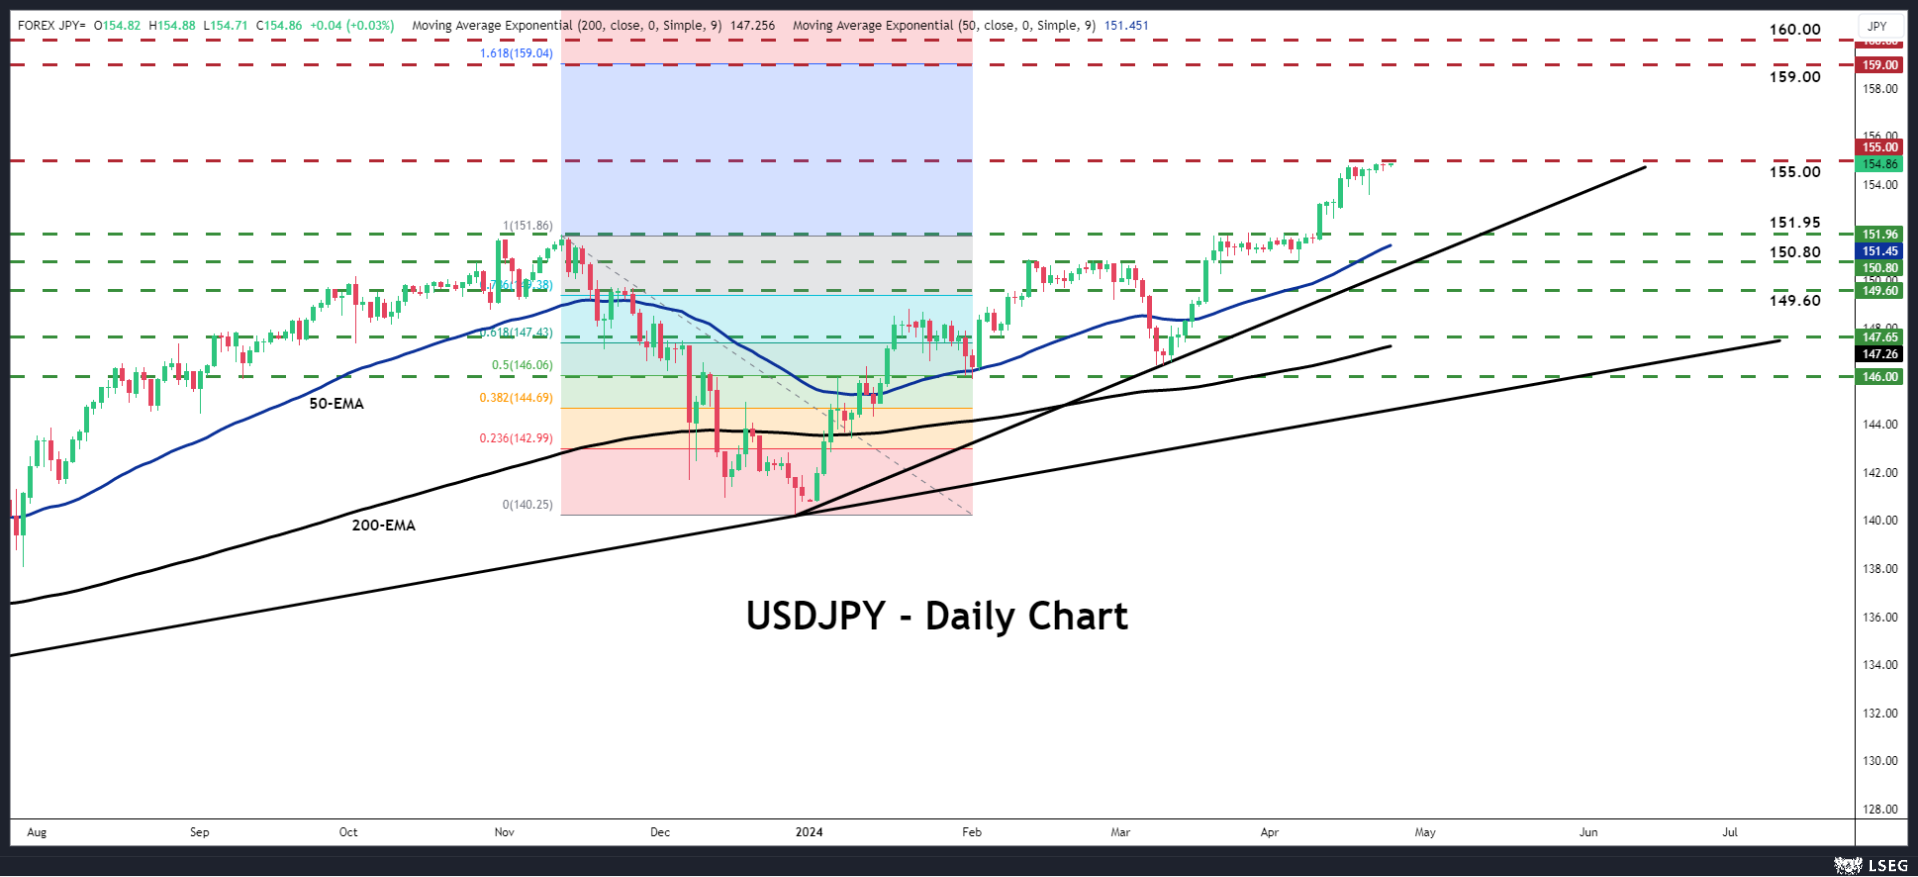
Currently, the pair is trading just a hair shy of the psychological 155.00 barrier, the break of which may encourage the bulls to extend their march towards the 161.8% Fibonacci extension level of the November 13 – December 28 correction, at around 159.00. The next level to consider as resistance may be the round number of 160.00.
On the downside, a decisive break below the crossroads of the 150.80 barrier and the upside support line drawn from the low of December 28 may invite more bears into the game, but it would still be premature to call for a full-scale reversal as the pair would still be above the longer-term uptrend line that’s been intact for more than a year.
Gold Technical: Is Bull Run Over After Worst Daily Decline in 2 Years?
The price actions of Gold (XAU/USD) have shaped the mean reversion decline after a test on the US$2,420 intermediate resistance. It tumbled by -2.7% on Monday, 22 April, its worst daily performance since 13 June 2022 (almost two years), and continued to extend its losses in yesterday’s (23 April) Asian session.
So far, it has recorded an accumulated loss of -5.8% from its recent fresh all-time high of US$2,431 printed on 12 April to yesterday’s intraday low of US$2,291.
Now, the golden question for Gold (XAU/USD); can the bulls be revived or is it game over for its medium-term uptrend that kickstarted in mid-February 2024?
Let’s look at several positive elements that support its current medium-term uptrend phase.
Gold/Copper ratio remains on support within a rising trend channel
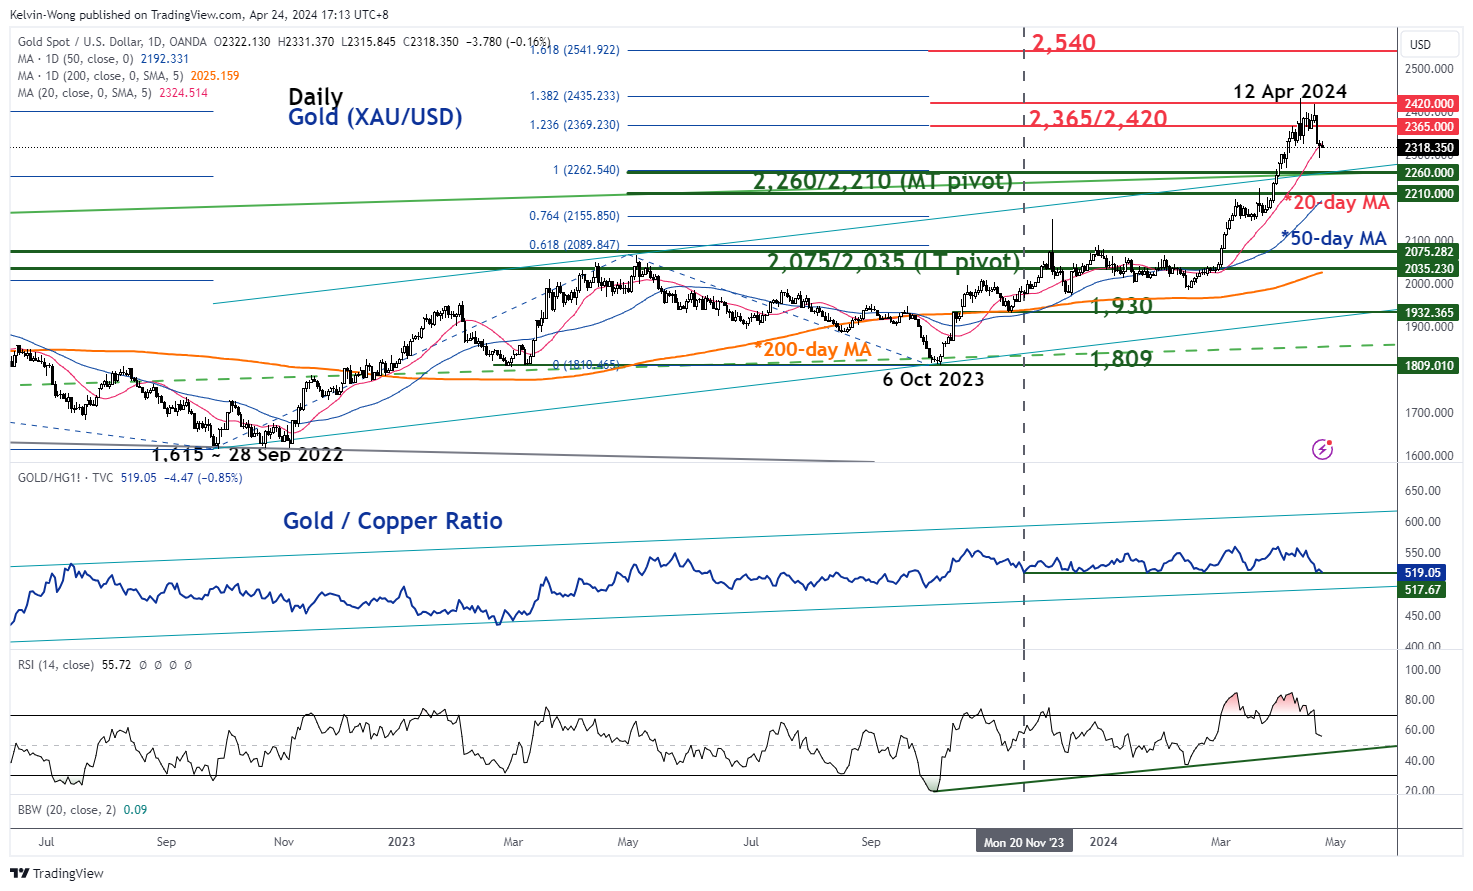
Fig 2: Gold (XAU/USD) medium-term trend with Gold/Copper ratio as of 24 Apr 2024 (Source: TradingView, click to enlarge chart)
The Gold/Copper ratio is defined by dividing the price of gold (XAU/USD) and the price of copper (I used high-grade copper futures denominated in USD). Hence the ratio removes the US dollar exchange rate effect from the equation which in turn solely measures the relative value or outperformance or underperformance of gold against copper.
Copper is considered an industrial commodity; hence its price trends reflect industrial demand and economic activities that stand in contrast with gold, a safe haven hedging asset/commodity with limited industrial usage.
If the ratio of Gold/Copper declines steadily, it suggests that global economic growth is likely in an expansionary mode, and vice versa when the Gold/Copper ratio rises due to a relatively higher demand for gold for hedging purposes due to economic growth slowdown or uncertainties.
The current state of the Gold/Copper ratio has so far remained on support since late November 2023 within a major ascending channel in place since 15 October 2021. Therefore, the current configuration of the ratio suggests that there is still a relatively higher demand for gold as a hedging asset for stagflation risk (see Fig 1).
Given the current economic context where inflationary expectations in the US remain sticky and elevated (above the US Federal Reserve’s 2% inflate target) which in turn puts the Fed in a “boxed up” situation that prevents it from enacting interest rate cuts aggressively. Therefore, fiscal expansionary policies will take over the driver’s seat to stimulate growth which in turn increases the federal budget deficit and may lead to a higher level of 10-year US Treasury yield (a long-term benchmark risk-free rate for pricing of corporate and consumer loans).
Higher costs of long-term funding or capital increase the “crowding out” effects that dampen internal demand which eventually slows down economic growth but not being able to offset sticky inflationary pressure due to persistent supply-side factors (geopolitical tensions & climate change that drive up the prices of oil and agriculture-related commodities).
The 50-day moving average is still acting as a support
Based on a technical analysis standpoint, the price actions of Gold (XAU/USD) are still trading above its 50-day moving average which confluences with a key medium-term pivotal support zone of US$2,260/2,210 that is defined by the former major ascending channel’s upper boundary from 28 September 2022, and the 38.2% Fibonacci retracement of the recent six-month impulsive upmove sequence from 6 October 2023 low to 12 April 2024 high (see Fig 1).
In addition, the daily RSI momentum indicator is still holding above a key parallel support at around the 50 level after its exit from the overbought region which suggests that the medium-term uptrend phase from 14 February 2024 low remains intact.
A clearance above US$2,420 may see the next medium-term resistance coming in at US$2,540. On the flip side, a break below the US$2,210 lower limit of the key medium-term pivotal support zone sees an extension of the ongoing corrective decline within its major uptrend phase to expose the long-term pivotal support zone of US$2,075/2,035 (also the 200-day moving average).
Euro Edges Lower Despite Stronger German Business Confidence
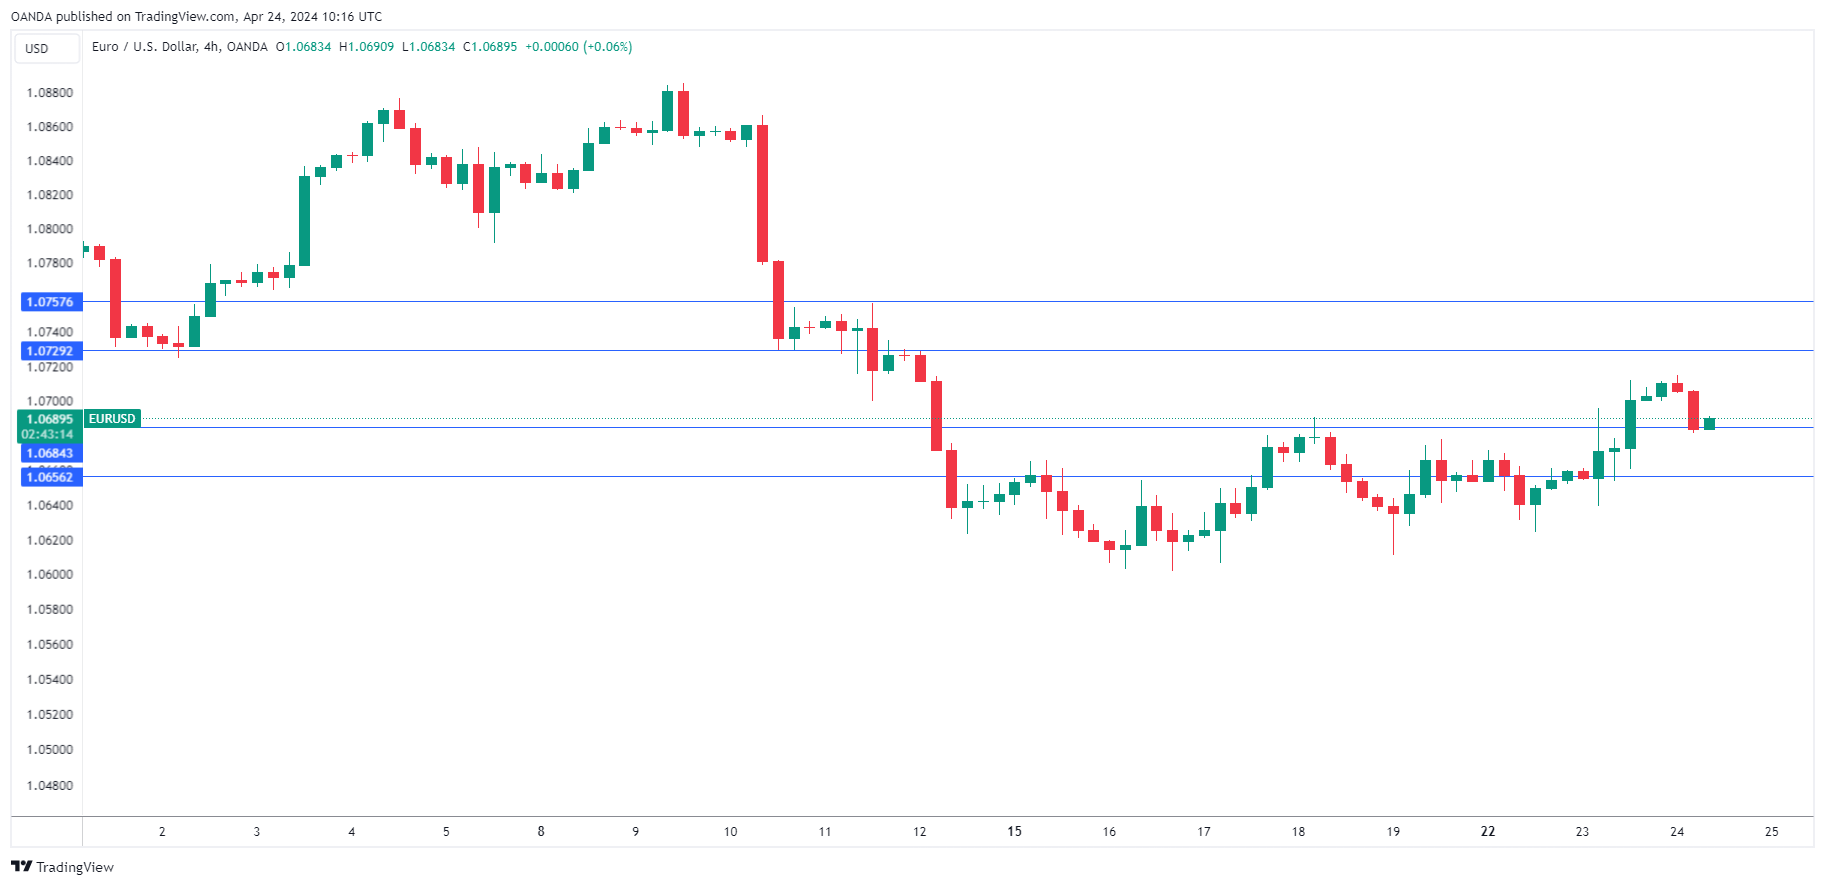
The euro is slightly lower on Wednesday. In the European session, EUR/USD is trading at 1.0685, down 0.16%.
German shows signs of optimism
Germany’s Ifo Business Climate index rose to 89.4 in April, up from a revised 87.9 in March and above the market estimate of 88.9. The index is still in negative territory (100 separates pessimism from optimism) but there are signs of optimism that the eurozone’s largest economy may have bottomed out.
The reading marked a third straight increase, which in the past has indicated that the German economy has turned a corner.
Business confidence is now at its highest level since May 2023, boosted by falling inflation and the expectation that the European Central Bank will soon cut interest rates. The German economy is by no means out of the woods yet but the improvement in business confidence is an encouraging sign.
Eurozone PMIs – services up, manufacturing down
Eurozone and German PMIs for April painted a mixed picture of economic activity, with services improving while manufacturing took a step backwards. The eurozone services PMI improved to 52.9, up from 51.5 in March and above the market estimate of 51.8. The manufacturing PMI fell from 46.1 to 45.6, shy of the market estimate of 46.5.
The German services PMI showed a return to growth after eight straight declines, climbing from 49.8 to 53.3, above the market estimate of 50.6. This is another sign of improvement in the German economy, although manufacturing remains mired in contraction.
Will ECB deliver a series of cuts?
The ECB has signaled that it will start to lower interest rates in June but what happens afterwards is less clear. ECB President Lagarde hasn’t stated what the central bank has planned after June. Some Governing Council members have been more upfront and said they support further cuts before the end of the year. Some members have said they are comfortable with three rate cuts this year but the markets aren’t sure that the ECB will be that aggressive and are no longer fully pricing in three rate cuts this year.
EUR/USD Technical
- There is resistance at 1.0729 and 1.0757
- EUR/USD is testing support at 1.0684. Below, there is support at 1.0656
Euro Gains Against Dollar Amid Mixed Economic Signals
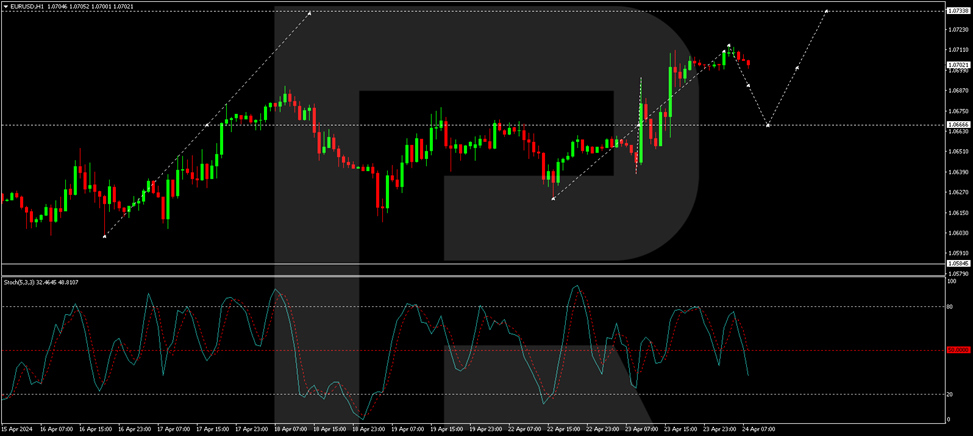
The EUR/USD pair rose to 1.0707 on Wednesday, driven by increased local risk appetite and the belief that the currency was significantly oversold against the US dollar. This resurgence indicates a temporary rebalancing in the currency market.
In the US, newly published statistics provide fodder for economic analysis. Sales of new homes in March showed a robust increase of 8.8% month-on-month, climbing to 693,000 from February’s 637,000, surpassing expectations. The year-on-year comparison also reflected strength with an 8.3% increase. Additionally, the weighted average price of a sold house in the US rose to USD 524.8 thousand from USD 488.6 thousand in February, pointing to a market that is still vibrant despite elevated interest rates.
These indicators are inherently pro-inflationary, suggesting that consumer behaviour has adapted well to elevated interest rates. Continued activity in the housing market is likely to sustain inflationary pressures in the US for an extended period. If interest rates were to be lowered, the attractiveness of buying property would increase further, prompting the Federal Reserve to keep higher rates to temper economic overheating.
Despite substantial efforts by the Fed to stabilise price pressures, the US economy shows a high degree of resilience to changed conditions. This adaptability is a mixed blessing, maintaining economic vitality but complicating inflation management.
As long as the Fed keeps interest rates at the current peak of 5.5% per annum, the US dollar will likely retain its strength. Any current weakening of the dollar is seen as a temporary adjustment rather than a trend reversal.
EUR/USD technical analysis
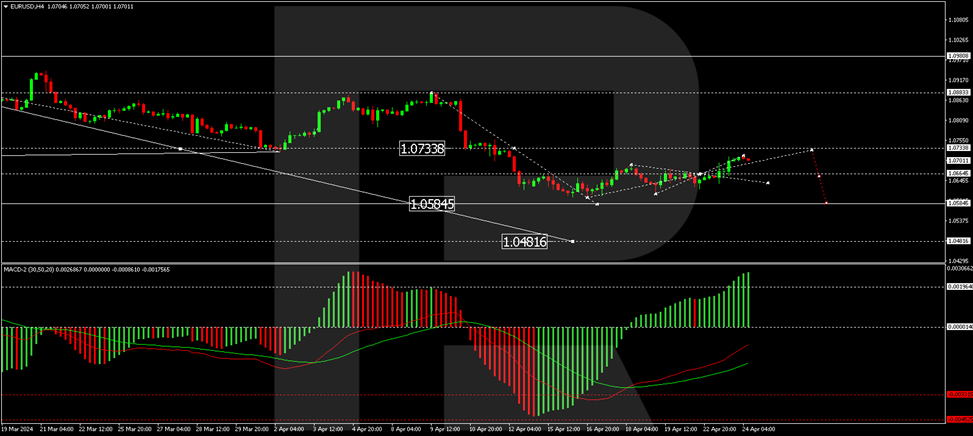
On the H4 chart, the EUR/USD pair formed a consolidation range around 1.0666. A correction to 1.0713 occurred after the market exited the range on the upside. The pair is expected to decline to 1.0660 for a retest from above before potentially developing another growth structure towards 1.0733. The movement from 1.0601 is considered a correction of the last decline wave. After completing this corrective phase, a new downward wave to 1.0585 may begin. This outlook is supported by the MACD indicator, where the signal line is below zero but ascending, while the histograms are at maximums, poised for a decline.
On the H1 chart, after fulfilling the local correction target at 1.0713, a decline to 1.0660 is anticipated. Subsequently, the development of a growth wave to 1.0733, the main correction target, may occur. The Stochastic oscillator, currently below 50, is expected to drop to 20, supporting the potential for further adjustments before any upward movements.
Dollar Pullback from Overbought Territory Boosts Appeal
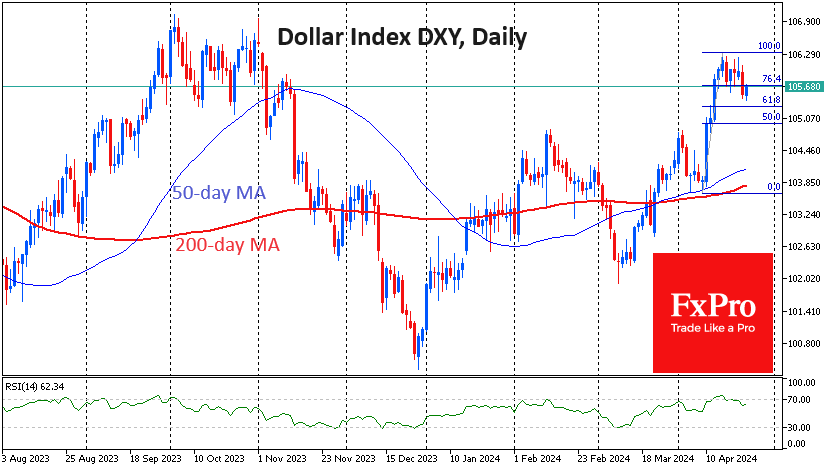
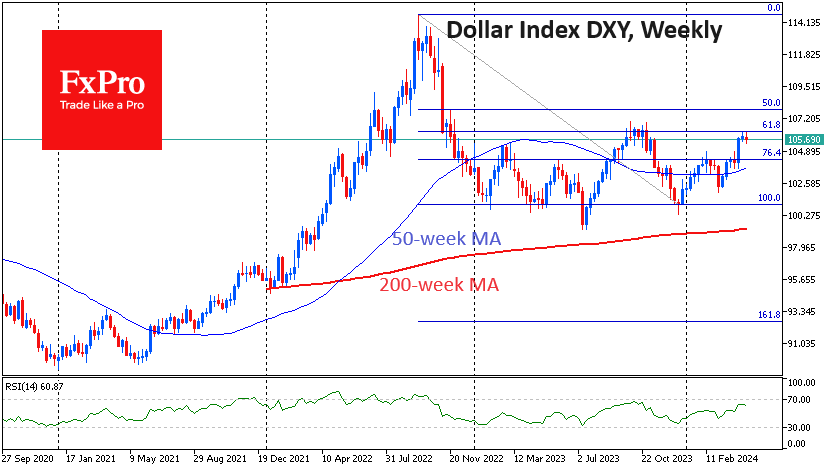
The US dollar’s gains stalled last week, and on Tuesday, it lost a third of a cent against a basket of major currencies to 105.4 from a peak of 106.3 the week before.
Yesterday’s pullback more closely resembles the start of broader profit-taking than a reversal of the dollar’s upward trend since early March.
The dollar was somewhat overheated after the 10-12 April spike. In addition, earlier this month, the DXY entered the turning area of last October. As it often happens, the ascent to the previous extremums is fast, but their overcoming indicates a change of the market regime, which happens only after a significant shakeout.
The formal reason for the weakening of the dollar on Tuesday was the positive dynamics of stock indices and the strengthening of the pound, with less certainty for a soon rate cut from BoE.
Now, there are higher chances for deepening the DXY correction with the potential to go down to 105.3 or even to the area of 104.8-105.0, where many turning points are concentrated. Such a plunge would increase the appeal of buying the dollar against major currencies, removing the technical overheating.
The ability to rise from current levels opens a fast road to the April highs near 106.3, with the finale of this journey near 108.0. The bearish scenario for the dollar, in our view, will be activated in the event of a failure under 104.8, forcing a search for support in the 103.80-104.0 area.
WTI Futures Tick Up After Bouncing Off 50-SMA
- WTI futures develop within a bullish channel since December
- Price retreats from a 6-month high but finds support at 50-day SMA
- Oscillators suggest intensifying positive momentum
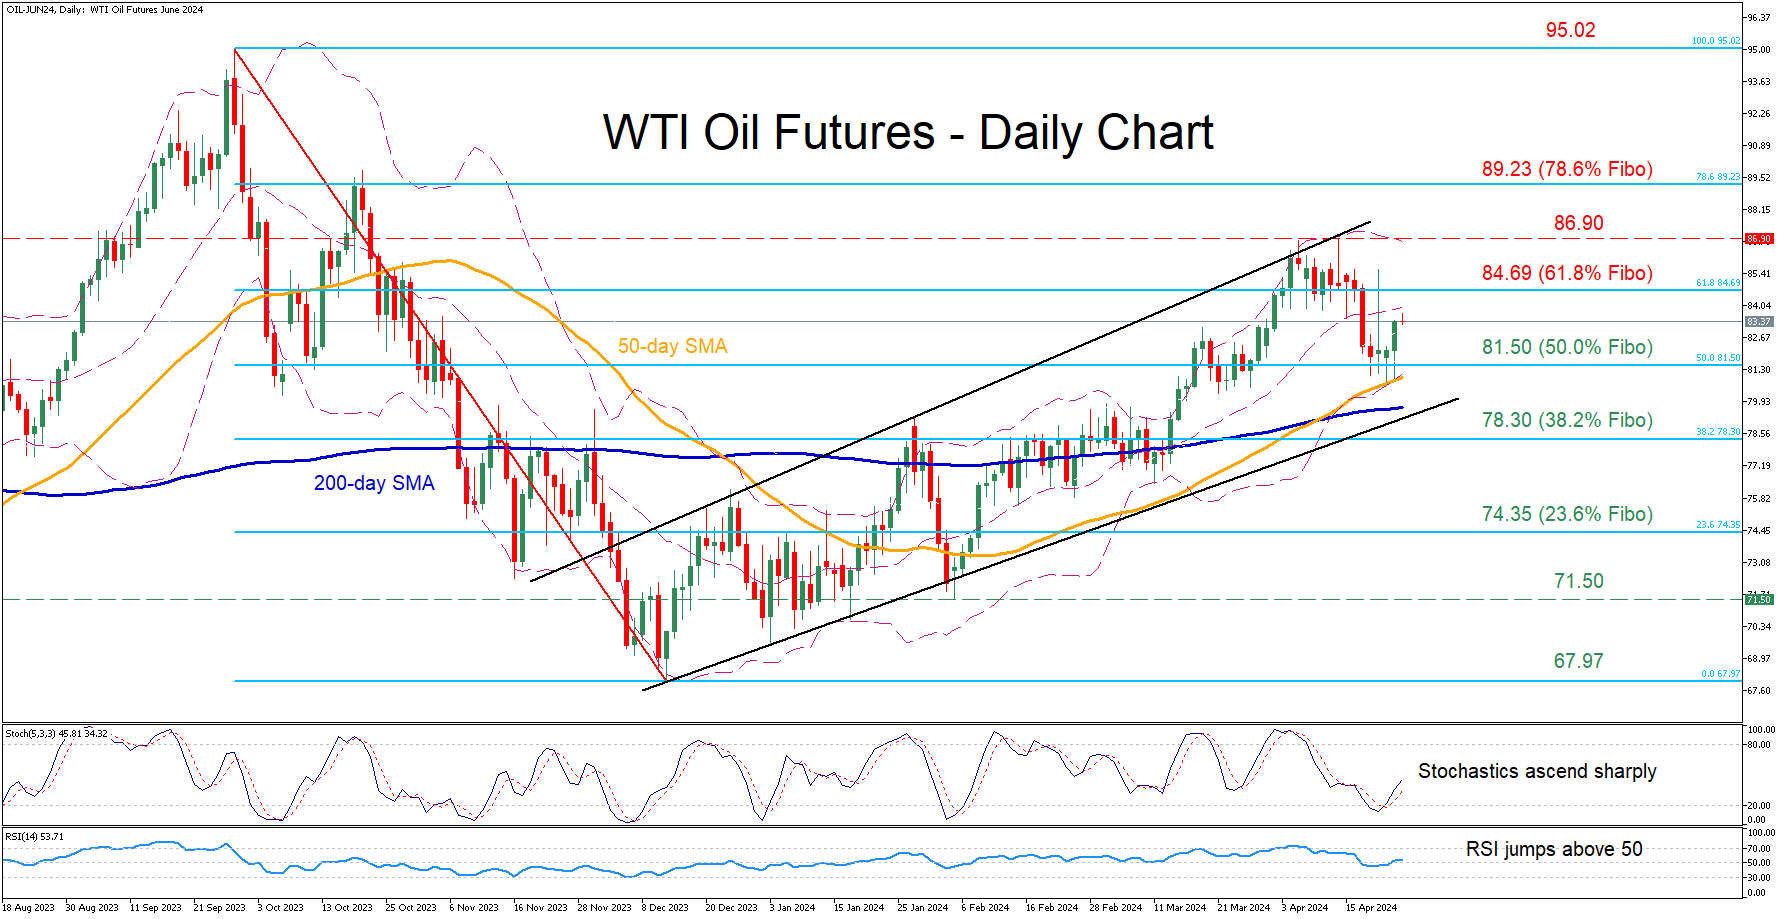
WTI oil futures (June delivery) have been in a constant uptrend since bottoming out at 69.97 in December, posting a fresh six-month peak of 86.90 on April 12. Despite experiencing a pullback from its highs, the price managed to find its feet at the 50-day simple moving average (SMA) and recoup some losses.
Should the rebound resume, immediate resistance could be found at 84.69, which is the 61.8% Fibonacci retracement of the 95.02-67.97 downleg. Jumping above that zone, the price may challenge the recent six-month peak of 86.90. Even higher, the 78.6% Fibo of 89.23 could prevent further upside attempts.
Alternatively, bearish actions could send the price lower to test the 50.0% Fibo of 81.50, a region that the price has repeatedly violated in the past few sessions but has failed to close below it. Further retreats could then cease at the 38.2% Fibo of 78.30. Failing to halt there, the price may descend towards the 23.6% Fibo of 74.35.
In brief, although WTI futures underwent a setback, they quickly regained traction following the deflection at the 50-day SMA. Hence, a resumption of the recent rebound remains the most likely scenario as the momentum indicators are tilted to the upside.
Altcoins Upbeat, Bitcoin Hesitant to Breakout
Market picture
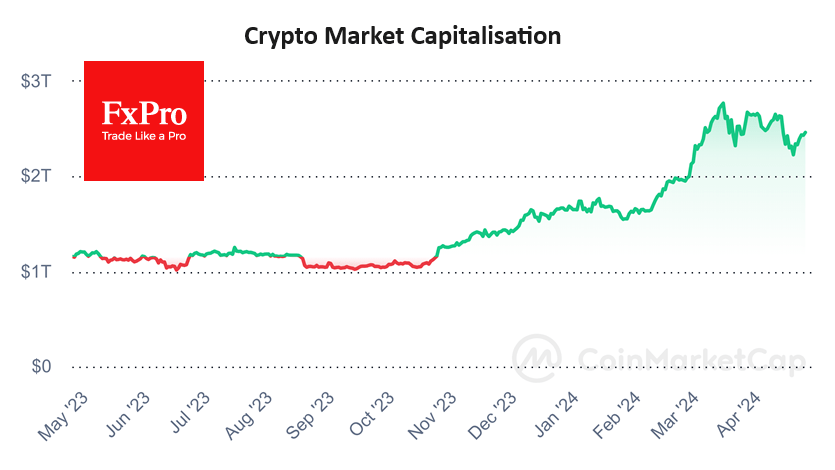
The crypto market added 0.5% in 24 hours to $2.46 trillion as a rebound in risk appetite in stocks helped altcoins attract buying interest. The Crypto Fear & Greed Index added 1 point to 72 (Greed).
Bitcoin is avoiding sharp swings and is trading at $66.75K on Wednesday morning, adding 0.3% in 24 hours but remaining inside the previous day’s range. It looks like a very cautious testing of the 50-day moving average (now at $67.3K), but just shy of surpassing it for the third day in a row.
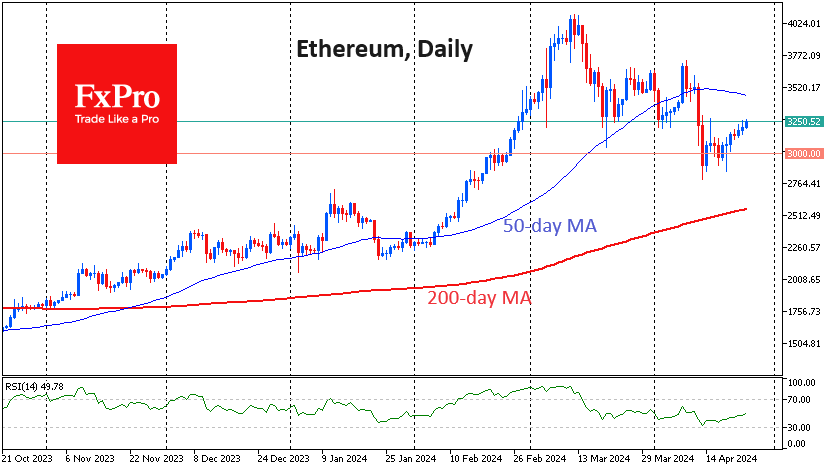
Ethereum appears more upbeat, adding 2.3% in 24 hours to $3250, once again near the highs since 13 April. However, Ethereum’s decline has been deeper, pulling the price back below the support area of March and the first few days of April. Right now, the price is 6% below the 50-day MA that Bitcoin is nearing.
News background
Thanks to Bitcoin’s halving, crypto assets are recovering from losses caused by geopolitical tensions, ETC Group noted. The positive effects of the halving are not expected to begin to manifest themselves until about 100 days after the event – in August.
The US SEC has extended the review period for Franklin Templeton’s application to launch an Ethereum-based spot ETF. The next deadline is 11 June. After that date, the SEC will have to either give the green light or reject the application to launch the new product.
Bitcoin is entering a “DeFi summer” similar to Ethereum in 2020 thanks to record fees, Bernstein noted. Activity on the network is largely due to the launch of the Runes protocol.
According to The Block Data Dashboard, the combined market value of USD-linked stablecoins has risen to $165.2bn, the highest since June 2022, with 70% of this market share in USDT.
A class action lawsuit has been filed against Binance in Canada. A group of investors claim that the exchange violated local securities laws. Binance announced that it would cease operations in Canada back in May 2023.
AUD/USD Rises Sharply on Inflation News
The Consumer Price Index for Australia was released this morning. According to ForexFactory:
→ CPI in quarterly terms: actual = 1.0%, expected = 0.8%, previous value = 0.6%;
→ CPI in annual terms: actual = 3.5%, expected = 3.4%, previous value = 3.4%.
Rising inflation figures suggest that the Reserve Bank of Australia's tight monetary policy may continue beyond expectations - which is why the Australian dollar has jumped higher relative to other currencies.
Thus, from the minimum of the year against the US dollar, recorded on April 19, the Ausssie rose in price by more than 2%.
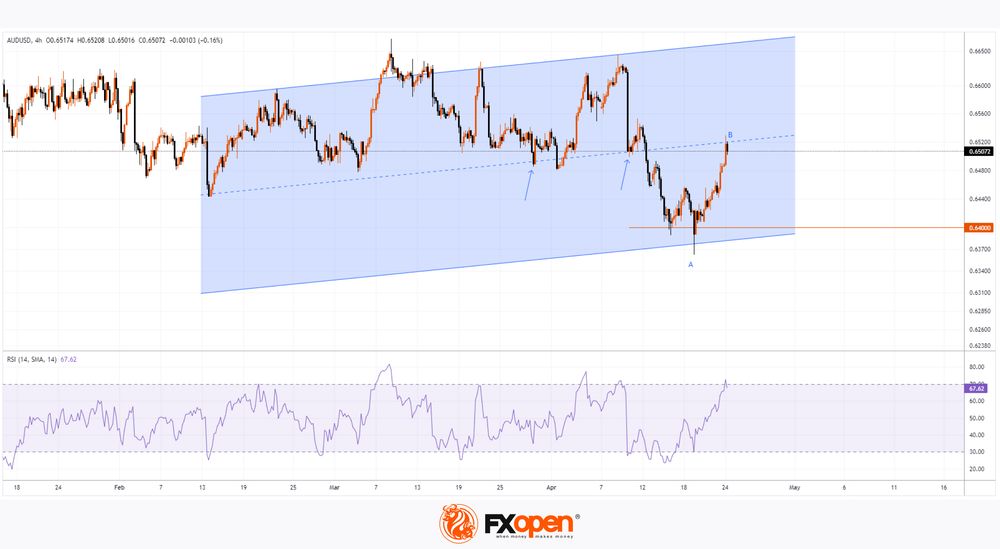
Technical analysis of the AUD/USD chart today shows that:
→ the price has reached the median of the ascending channel. Previously, this line served as support (as shown by the arrows), so there is reason to believe that it will provide resistance after rapid growth;
→ at the same time, the key support appears to be the level of 0.64, where the lower border of the channel lies;
→ the RSI indicator is in the overbought zone.
It is possible that in the short term there will be a correction after a sharp increase in the price of AUD/USD — for example, by 50% of the A→B impulse.
And to assess the long-term outlook, the upcoming release of important data for the United States will provide valuable information:
→ US GDP, tomorrow at 15:30 GMT+3
→ Personal Consumption Expenditures (PCE) USA, on Friday at 15:30 GMT+3.
Trade over 50 forex markets 24 hours a day with FXOpen. Take advantage of low commissions, deep liquidity, and spreads from 0.0 pips. Open your FXOpen account now or learn more about trading forex with FXOpen.
This article represents the opinion of the Companies operating under the FXOpen brand only. It is not to be construed as an offer, solicitation, or recommendation with respect to products and services provided by the Companies operating under the FXOpen brand, nor is it to be considered financial advice.
Gold Price Corrects Gains While Oil Price Regains Strength
Gold price rallied above $2,400 before correcting lower. Crude oil price is rising and it could climb further higher toward the $85.50 resistance.
Important Takeaways for Gold and Oil Prices Analysis Today
- Gold price rallied significantly above $2,400 and recently corrected lower against the US Dollar.
- It cleared a key bearish trend line with resistance at $2,310 on the hourly chart of gold at FXOpen.
- Crude oil prices are moving higher above the $82.00 resistance zone.
- There was a break above a connecting bearish trend line with resistance at $82.00 on the hourly chart of XTI/USD at FXOpen.
Gold Price Technical Analysis
On the hourly chart of Gold at FXOpen, the price was able to climb above the $2,350 resistance, as mentioned in the previous analysis. The price even broke the $2,400 level before the bears appeared.
The price traded close to the $2,420 zone before there was a downside correction. There was a move below the $2,355 pivot zone. The price settled below the 50-hour simple moving average and RSI dipped below 50. Finally, it tested the $2,290 zone.
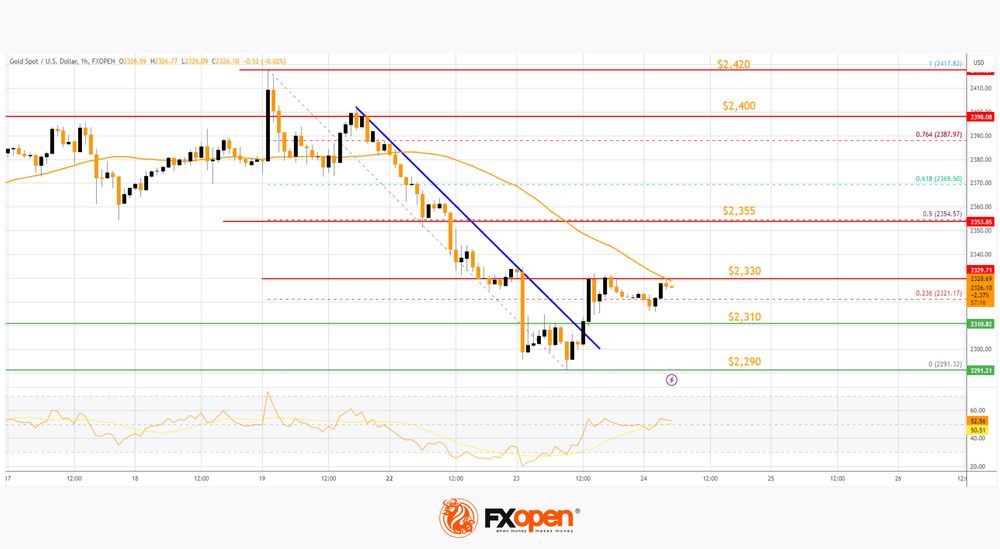
The price is now correcting losses above the 23.6% Fib retracement level of the downward move from the $2,417 swing high to the $2,291 low. It surpassed a key bearish trend line with resistance at $2,310.
Immediate resistance on the upside is near the 50-hour simple moving average and $2,330. The next major resistance is near the 50% Fib retracement level of the downward move from the $2,417 swing high to the $2,291 low at $2,355.
An upside break above the $2,355 resistance could send Gold price toward $2,400. Any more gains may perhaps set the pace for an increase toward the $2,420 level. If there is no fresh increase, the price could continue to move down.
Initial support on the downside is near the $2,310 level. The first major support is $2,290. If there is a downside break below the $2,290 support, the price might decline further. In the stated case, the price might drop toward the $2,265 support.
Oil Price Technical Analysis
On the hourly chart of WTI Crude Oil at FXOpen, the price started a decent increase against the US Dollar. The price gained bullish momentum after it broke the $81.10 resistance.
There was a break above a connecting bearish trend line with resistance at $82.00. The bulls pushed the price above the 50-hour simple moving average and the RSI climbed toward 65. There was a clear move above the 50% Fib retracement level of the downward move from the $85.48 swing high to the $80.59 low.
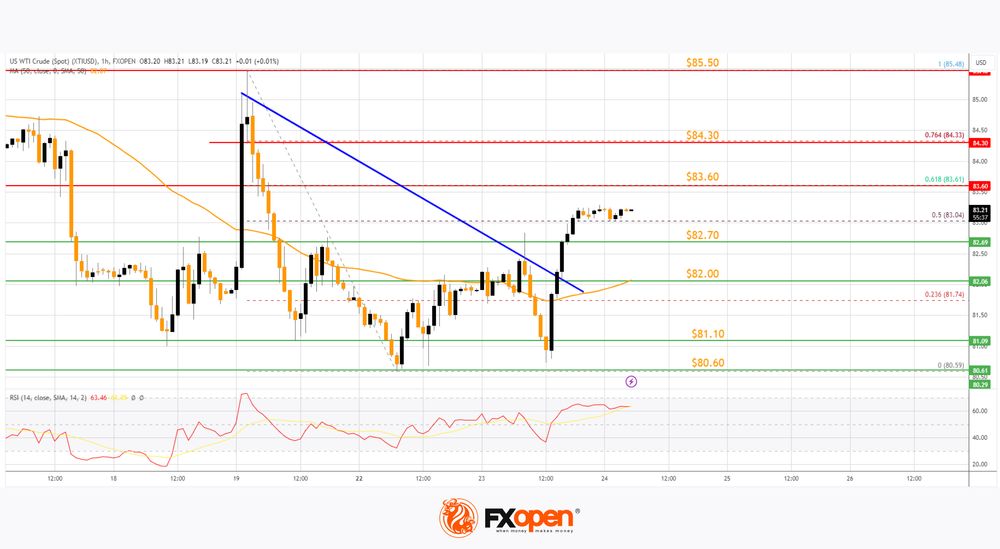
Immediate resistance is near the $83.60 level. It is close to the 61.8% Fib retracement level of the downward move from the $85.48 swing high to the $80.59 low.
If the price climbs further higher, it could face resistance near $84.30. The next major resistance is near the $85.50 level. Any more gains might send the price toward the $87.00 level.
Conversely, the price might correct gains and test the $82.70 support. The next major support on the WTI crude oil chart is near the 50-hour simple moving average at $82.00. If there is a downside break, the price might decline toward $81.10. Any more losses may perhaps open the doors for a move toward the $80.00 support zone.
This article represents the opinion of the Companies operating under the FXOpen brand only. It is not to be construed as an offer, solicitation, or recommendation with respect to products and services provided by the Companies operating under the FXOpen brand, nor is it to be considered financial advice.