Sample Category Title
USD/JPY Daily Outlook
Daily Pivots: (S1) 149.58; (P) 150.27; (R1) 151.55; More...
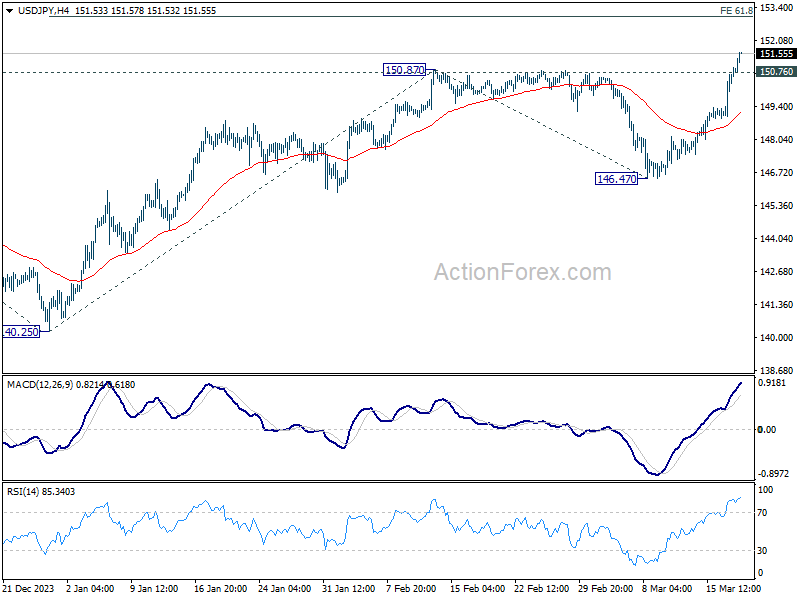
USD/JPY surges past 150.87 resistance to resume the rally from 140.25. Intraday bias stays on the upside for next key resistance at 151.93. Decisive break there will confirm long term up trend resumption. Next near term target will be 61.8% projection of 140.25 to 150.87 from 146.47 at 153.03. On the downside, below 150.76 minor support will turn intraday bias neutral and bring consolidations first. But outlook will stay bullish as long as 55 4H EMA (now at 149.09) holds.
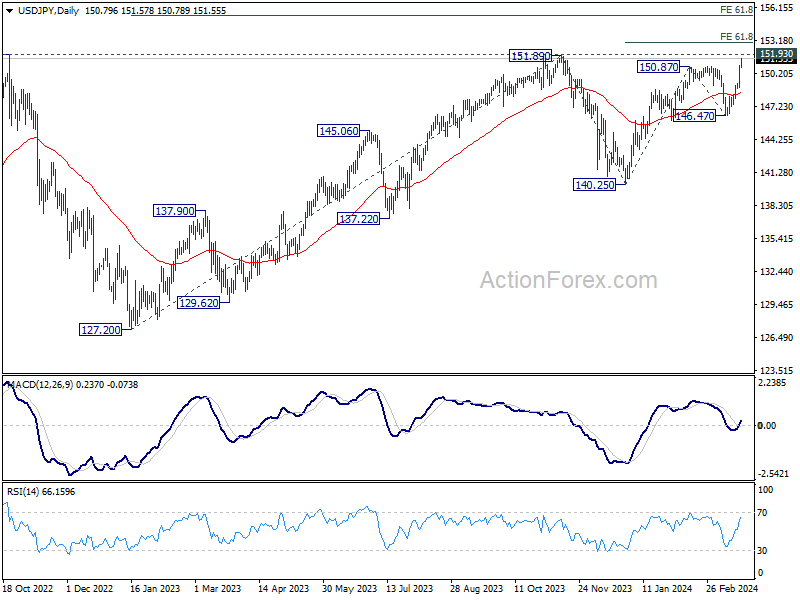
In the bigger picture, correction from 151.87 (2023) high could have completed at 140.25 already. Rise from 127.20 (2023 low), as part of the long term up trend, is probably ready to resume. Decisive break of 151.93 resistance (2022 high) will confirm this bullish case. Next medium term target will be 61.8% projection of 127.20 to 151.89 from 140.25 at 155.20. This will remain the favored case as long as 146.47 support holds, in case of another pullback.
Yen Selloff Intensifies, Attention Shifts to UK CPI and FOMC
Japanese Yen's decline intensified today and it's on the verge of breaking to new historical low against the greenback. Japan's stock markets are on holiday today, but the strong rally in Nikkei yesterday, which surged 40k psychological mark again, was significant. The robust risk-on sentiment within Japan and its weakening currency are clearly reinforcing each other.
BoJ's rate hike yesterday, while historic in setting the stage for a new monetary era, does not herald the beginning of a tightening cycle, not yet. The yield gap between Japan and other major economies is set to remain significant, even with anticipated policy loosening by Fed, ECB and other major central banks this year. The escalating Yen selloff raises questions about reactions from Japanese officials, including the likelihood of verbal or direct market interventions to stabilize the currency.
Meanwhile, Dollar maintains its position as the strongest currency of the week, with all eyes now on Fed's upcoming rate decision and economic projections. The key query is whether Fed will project three rate cuts for this year or lower the forecast to two. Sterling stands as the second strongest, awaiting the release of UK's CPI data, with Euro not far behind in third place.
Conversely, Kiwi trails as the week's second weakest currency after Yen, influenced by bets on an earlier rate cut by RBNZ following economic warnings from the Finance Minister last week. Swiss Franc, though currently the third weakest, faces downside risks, especially if SNB signals a rate cut in the second quarter or even surprises markets with a cut at its upcoming meeting.
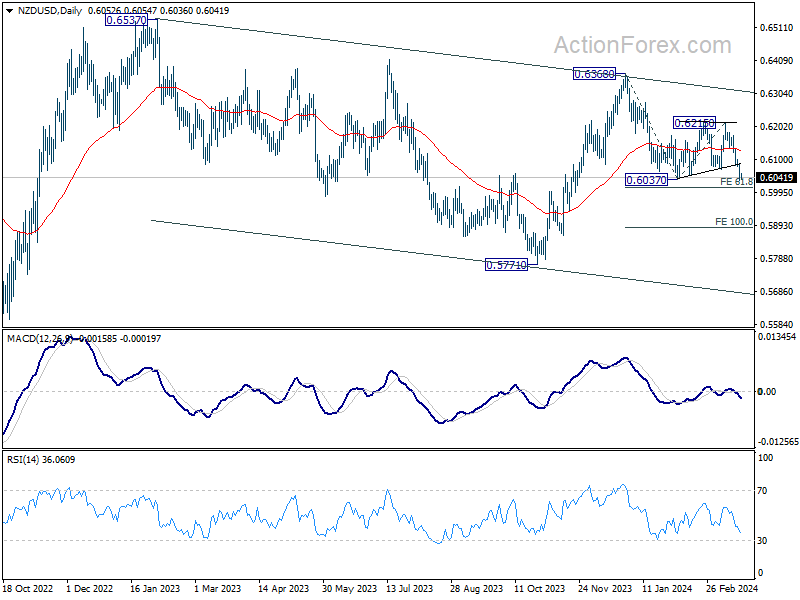
Technically, NZD/USD's breach of 0.6037 indicates that fall from 0.6368 is resuming. Next target is 61.8% projection of 0.6368 to 0.6037 from 0.6125 at 0.6010. Firm break there could prompt downside acceleration to 100% projection at 0.5884 next. In any case, outlook will stay bearish as long as 55 D EMA (now at 0.6124 holds).
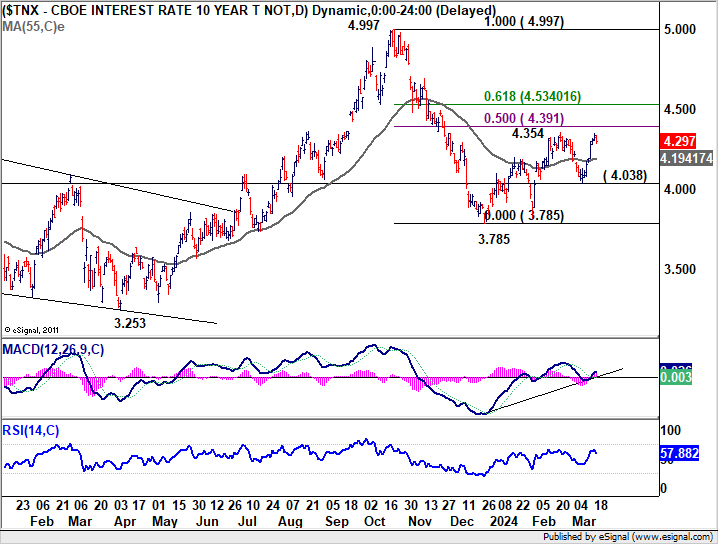
In Asia, at the time of writing, Hong Kong HSI is up 0.15%. China Shanghai SSE is up 0.45%. Singapore Strait Times is up 0.25%. Japan is on holiday. Overnight, DOW rose 0.83%. S&P 500 rose 0.56%. NASDAQ rose 0.39%. 10-year yield fell -0.043 to 4.297.
Fed's dot plot: Three or just two rate cuts this year?
Fed is widely expected to hold interest rates steady at the current range of 5.25-5.50% today. The focal point of today's announcement, however, lies beyond the immediate rate decision; all eyes are on Fed's updated economic projections and dot plot for insights into the path of monetary easing this year.
The crux of the matter hinges on whether Fed's new projections will continue to forecast three rate cuts within the year, and thus making June the likely month to commence.
Alternatively, amidst recent data revealing the stubborn persistence of inflation, Fed might adjust its outlook to envision just two cuts for the year, which would likely postpone the initial reduction to the third quarter.
The December dot plot presented a 8-11 split among Fed members, with 8 anticipating the federal funds rate to exceed 4.75% by year-end, while 11 predicted it would fall below this mark. A subtle but pivotal shift of just two dots would sway the balance to 10-9, leaning towards the scenario of only two rate cuts.
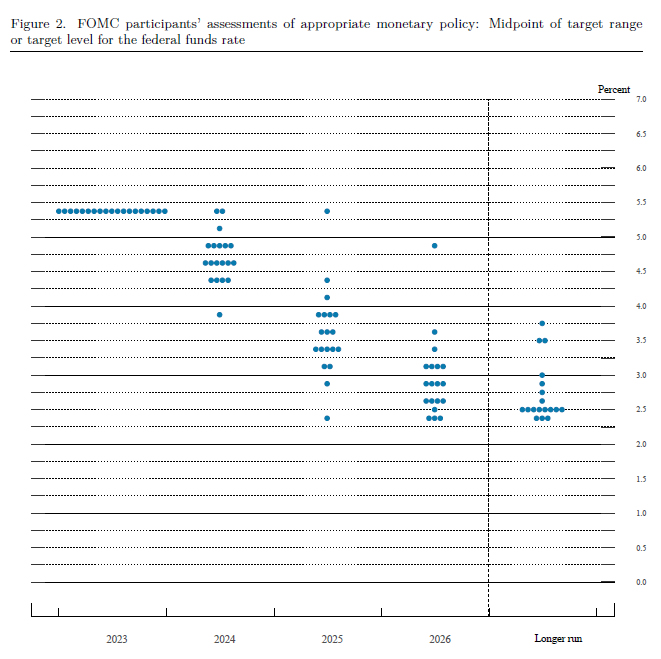
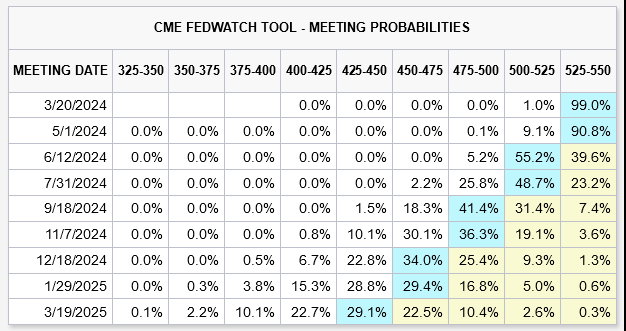
Market expectations, as reflected in Fed fund futures, currently assign slightly over 60% probability to a June rate cut. By December's end, there's a 64% likelihood of the federal funds rate adjusting down to 4.50-4.75%.
10-year yield retreated mildly overnight to close at 4.297, but there is no clear sign of topping yet. A hawkish FOMC result today, signalling fewer rate cut this year, could give TNX another push through 4.354 resistance, and thus pulling Dollar higher along. Yet, strong resistance is expected between 4.391 and 4.534 (50% and 61.8% retracement of 4.997 to 3.785) to limit upside, to complete the corrective rebound from 3.785.
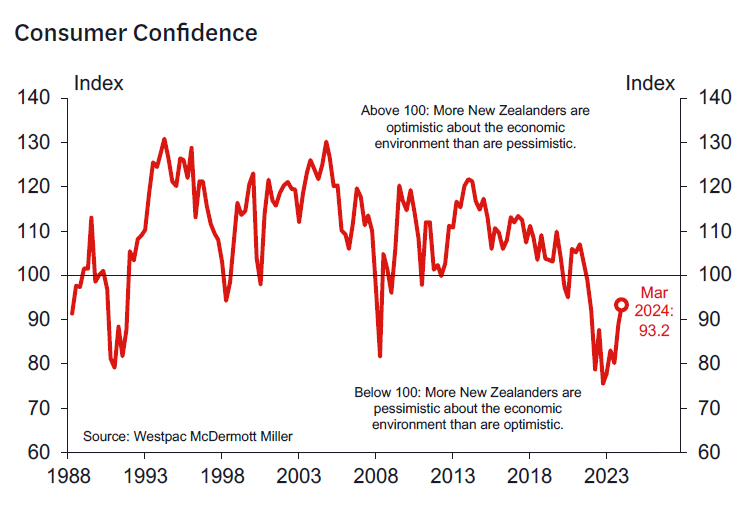
New Zealand Westpac consumer confidence rises to 93.2 in Q1, yet pessimism lingers
New Zealand Westpac Consumer Confidence rose from 88.9 to 93.2 in Q1, marking its highest level in over two years. Despite this rise, the index continues to hover below the pivotal 100 mark, indicating prevailing sense of pessimism among New Zealanders regarding economic conditions. Present Conditions Index saw significant uplift from 77.1 to 85.1, while Expected Conditions Index advanced modestly from 96.7 to 98.6.
Westpac's analysis highlights that households are gradually feeling more optimistic about their financial situations, which has subsequently spurred an increase in "spending appetites". This positive shift in consumer sentiment is observed across all income brackets, with "middle-income households exhibiting" the most marked improvement.
Looking ahead
UK CPI and PPI are the main focuses in European session, while Eurozone consumer confidence will also be featured. Later in the day, BoC will release summary of deliberations before FOMC rate decision and press conference.
USD/JPY Daily Outlook
Daily Pivots: (S1) 149.58; (P) 150.27; (R1) 151.55; More...
USD/JPY surges past 150.87 resistance to resume the rally from 140.25. Intraday bias stays on the upside for next key resistance at 151.93. Decisive break there will confirm long term up trend resumption. Next near term target will be 61.8% projection of 140.25 to 150.87 from 146.47 at 153.03. On the downside, below 150.76 minor support will turn intraday bias neutral and bring consolidations first. But outlook will stay bullish as long as 55 4H EMA (now at 149.09) holds.
In the bigger picture, correction from 151.87 (2023) high could have completed at 140.25 already. Rise from 127.20 (2023 low), as part of the long term up trend, is probably ready to resume. Decisive break of 151.93 resistance (2022 high) will confirm this bullish case. Next medium term target will be 61.8% projection of 127.20 to 151.89 from 140.25 at 155.20. This will remain the favored case as long as 146.47 support holds, in case of another pullback.
Economic Indicators Update
| GMT | Ccy | Events | Actual | Forecast | Previous | Revised |
|---|---|---|---|---|---|---|
| 20:00 | NZD | Westpac Consumer Survey Q1 | 93.2 | 88.9 | ||
| 21:45 | NZD | Current Account (NZD) Q4 | -7.84B | -7.80B | -11.47B | -10.97B |
| 07:00 | EUR | Germany PPI M/M Feb | -0.20% | 0.20% | ||
| 07:00 | EUR | Germany PPI Y/Y Feb | -3.80% | -4.40% | ||
| 07:00 | GBP | CPI M/M Feb | 0.70% | -0.60% | ||
| 07:00 | GBP | CPI Y/Y Feb | 3.50% | 4.00% | ||
| 07:00 | GBP | Core CPI Y/Y Feb | 4.60% | 5.10% | ||
| 07:00 | GBP | RPI M/M Feb | 0.80% | -0.30% | ||
| 07:00 | GBP | RPI Y/Y Feb | 4.50% | 4.90% | ||
| 07:00 | GBP | PPI Input M/M Feb | 0.20% | -0.80% | ||
| 07:00 | GBP | PPI Input Y/Y Feb | -2.70% | -3.30% | ||
| 07:00 | GBP | PPI Output M/M Feb | 0.10% | -0.20% | ||
| 07:00 | GBP | PPI Output Y/Y Feb | -0.10% | -0.60% | ||
| 07:00 | GBP | PPI Core Output Y/Y Feb | -0.40% | |||
| 07:00 | GBP | PPI Core Output M/M Feb | 0.20% | |||
| 09:00 | EUR | Italy Industrial Output M/M Jan | 0.10% | 1.10% | ||
| 14:30 | USD | Crude Oil Inventories | -0.9M | -1.5M | ||
| 15:00 | EUR | Eurozone Consumer Confidence Mar P | -15 | -16 | ||
| 17:30 | CAD | BoC Summary of Deliberations | ||||
| 18:00 | USD | Fed Interest Rate Decision | 5.50% | 5.50% | ||
| 18:30 | USD | FOMC Press Conference |
Fed’s dot plot: Three or just two rate cuts this year?
Fed is widely expected to hold interest rates steady at the current range of 5.25-5.50% today. The focal point of today's announcement, however, lies beyond the immediate rate decision; all eyes are on Fed's updated economic projections and dot plot for insights into the path of monetary easing this year.
The crux of the matter hinges on whether Fed's new projections will continue to forecast three rate cuts within the year, and thus making June the likely month to commence.
Alternatively, amidst recent data revealing the stubborn persistence of inflation, Fed might adjust its outlook to envision just two cuts for the year, which would likely postpone the initial reduction to the third quarter.
The December dot plot presented a 8-11 split among Fed members, with 8 anticipating the federal funds rate to exceed 4.75% by year-end, while 11 predicted it would fall below this mark. A subtle but pivotal shift of just two dots would sway the balance to 10-9, leaning towards the scenario of only two rate cuts.
Market expectations, as reflected in Fed fund futures, currently assign slightly over 60% probability to a June rate cut. By December's end, there's a 64% likelihood of the federal funds rate adjusting down to 4.50-4.75%.
10-year yield retreated mildly overnight to close at 4.297, but there is no clear sign of topping yet. A hawkish FOMC result today, signalling fewer rate cut this year, could give TNX another push through 4.354 resistance, and thus pulling Dollar higher along. Yet, strong resistance is expected between 4.391 and 4.534 (50% and 61.8% retracement of 4.997 to 3.785) to limit upside, to complete the corrective rebound from 3.785.
A New World Imagined by BoJ, But Not Yet Realised
Strong wage outcomes saw the Bank of Japan end its negative interest rate policy but further moves are still a world away.
At their March meeting, the Bank of Japan raised its policy rate to the range of 0% – 0.1% having “assessed the virtuous cycle between wages and prices” and judged “that the price stability target of 2 percent would be achieved in a sustainable and stable manner toward the end of the projection period”. The BoJ continues to view their stance as accommodative.
A strong RENGO wage outcome, emerging strength in services inflation and anecdotes of future wage increases allowed the BoJ to feel comfortable negative rates were no longer necessary. The BoJ also scrapped its YCC target and ceased purchases of ETFs and J-REITs; however, bond purchases will continue broadly at the same pace as before, and the BoJ made clear it will guard against a rapid rise in long-term interest rates.
The 2024 RENGO wage outcome was certainly constructive. The result reflects solid profitability and support from the government for businesses seeking to raise wages. Total pay is poised to increase 5.28% versus a demand of 5.85%. RENGO has not been this successful with their demands since 2013, and headline wages have not grown this fast since 1991. The trade confederation chalked the result up to the higher costs of living, labour shortages and their ‘investment in people’ campaign.
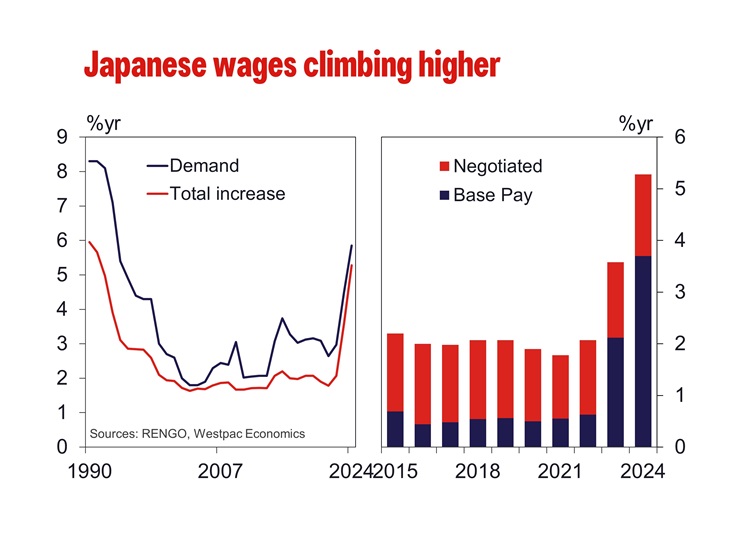
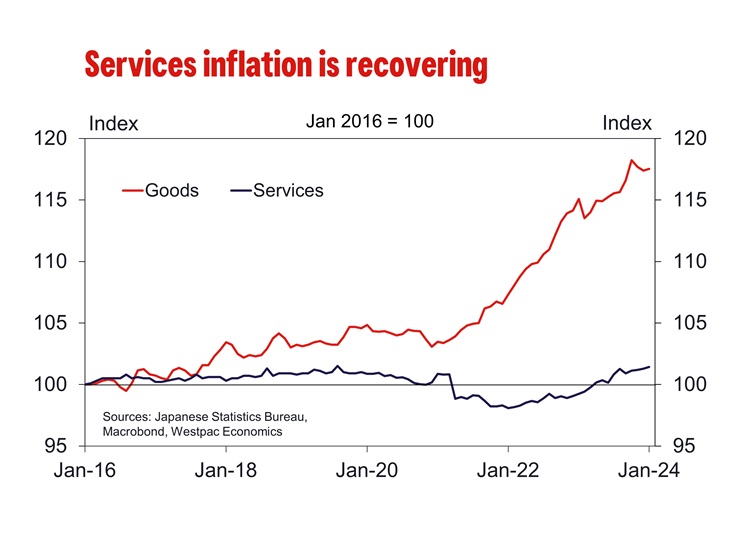
According to the BoJ, a 3% base pay increase is necessary for consumer prices to sustainably grow at 2%. For the latter to eventuate however, consumers must feel confident these wage increases will persist and respond with stronger consumption, particularly services spending. Services contribution to annual inflation is rising and annual growth is stronger than it has been since the late 1990s, but this is at least in part due to strong growth in international tourist arrivals. For this momentum in services inflation to be maintained, domestic household spending must see sustained growth. This is not currently the case, with quarterly household consumption growth negative Q2 to Q4 2023 despite considerable support from 2023’s robust wage outcomes and a tight labour market.
The message from the data is clear – policy must remain extraordinarily accommodative to sustain wage growth and let it feed through to domestic consumption and inflation. Until the BoJ’s hope of achieving its target is fulfilled, there will be little justification for the policy rate to be moved materially above zero or an end to bond purchases. We believe many months of constructive data for consumption and inflation are necessary to build the case for such a move.
Technical Outlook and Review
DXY:
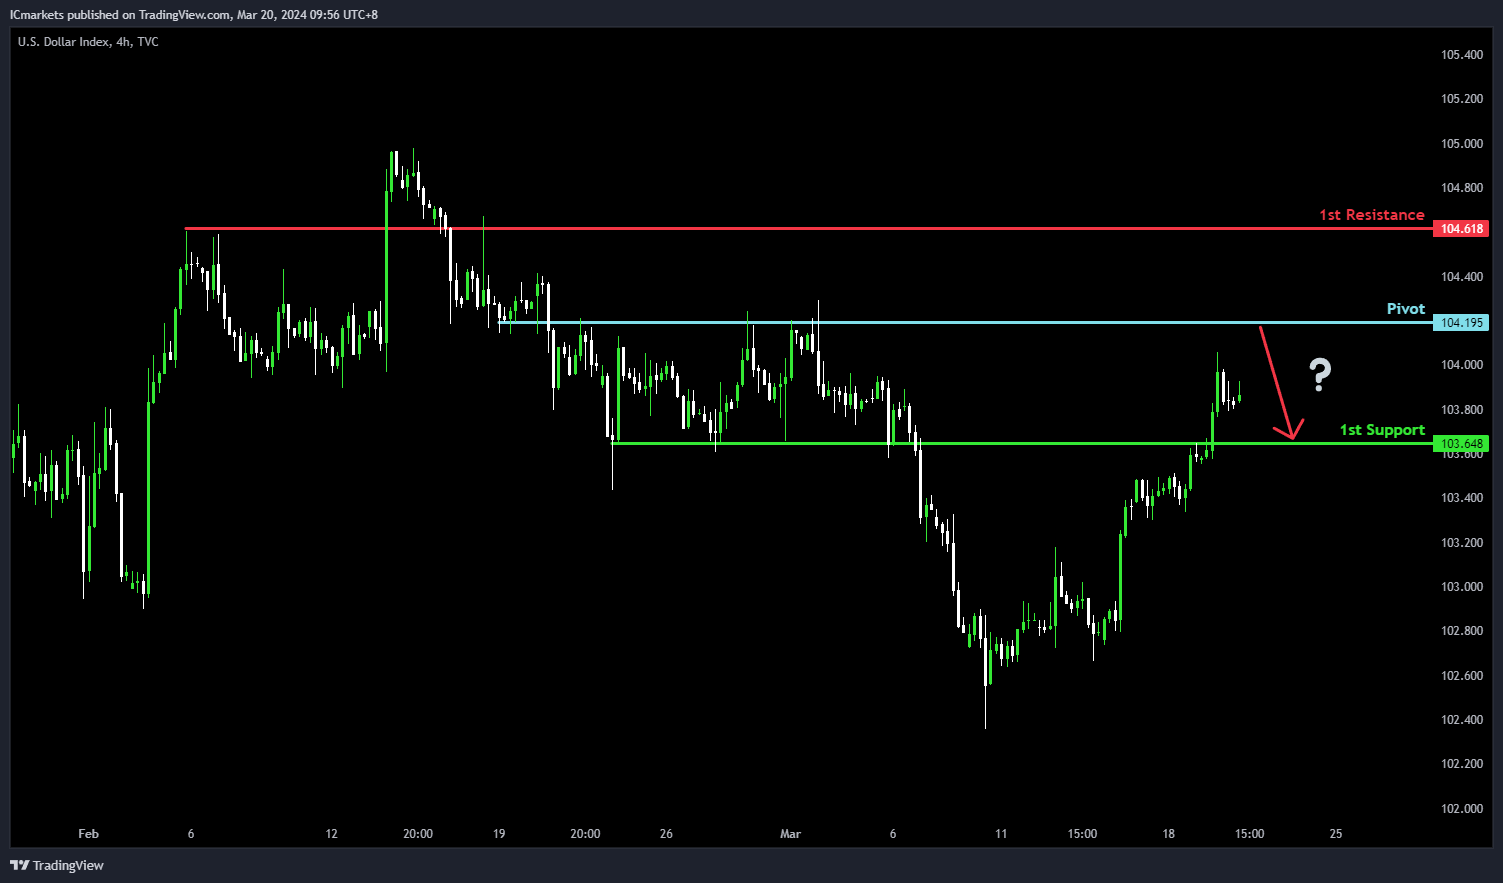
For DXY, aligning with the overall bullish momentum, there’s potential for a bearish reaction from the pivot level, possibly leading to a drop towards the 1st support.
The pivot at 104.19 acts as an overlap resistance, suggesting a pivotal level where selling pressure may arise, supported by its historical significance. Additionally, the 1st support at 103.64 serves as pullback support, reinforcing its importance as a level where buyers have intervened.
On the resistance side, the 1st resistance at 104.61 presents another overlap resistance, potentially capping further upward movement.
EUR/USD:
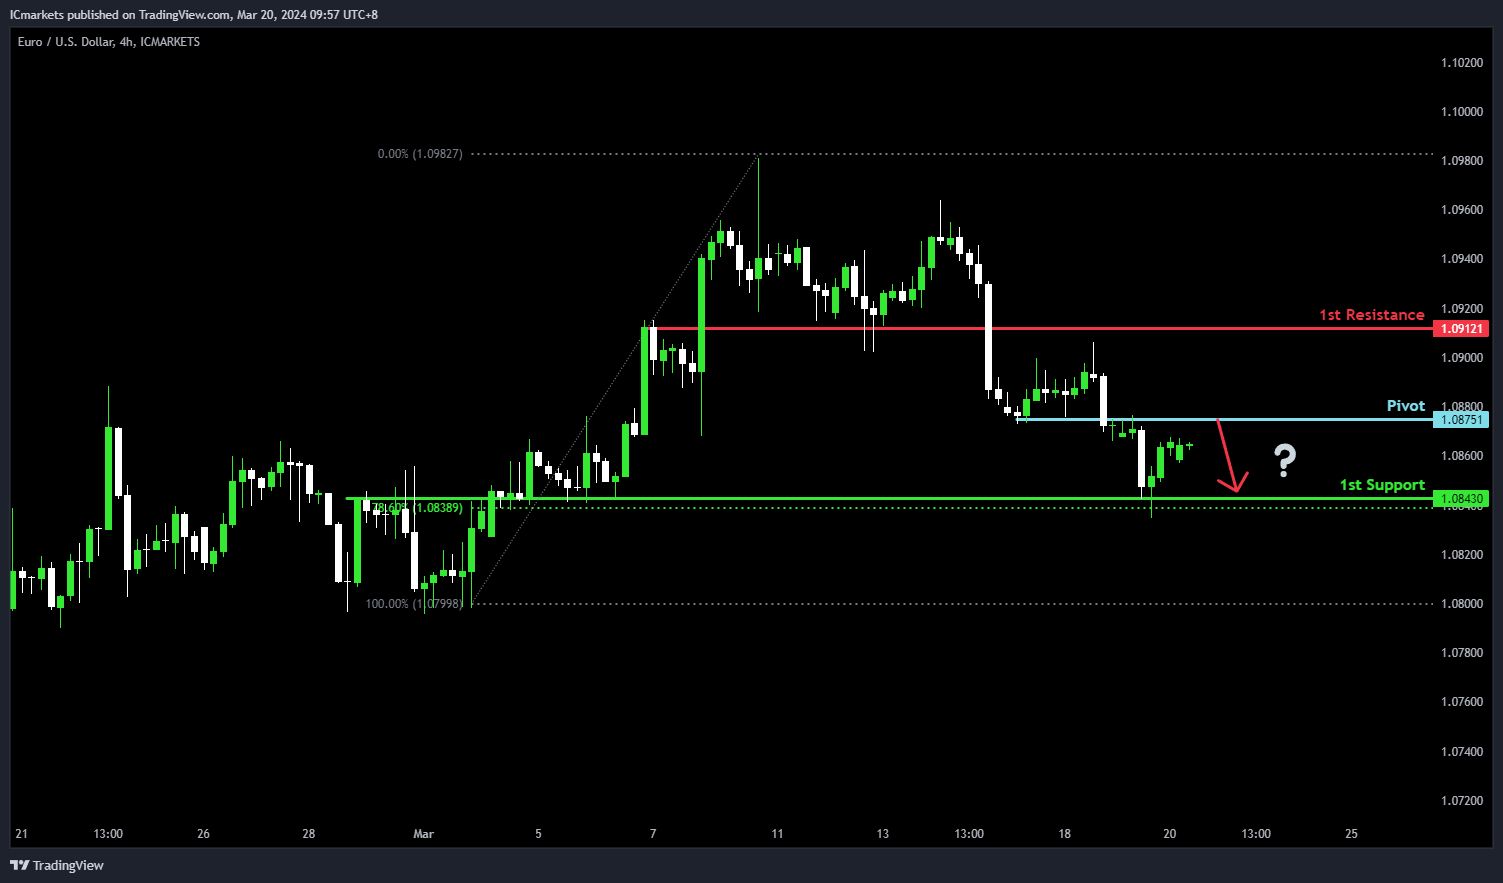
For EUR/USD, aligning with the overall bearish momentum, there’s a potential scenario indicating a bearish reaction from the pivot level, possibly leading to a drop towards the 1st support.
The pivot at 1.0875 acts as an overlap resistance, indicating a significant level where selling pressure might intensify. Additionally, the 1st support at 1.0843 serves as an overlap support, reinforced by the 78.60% Fibonacci Retracement, suggesting a level where buying interest could emerge.
On the resistance side, the 1st resistance at 1.0912 is noted as pullback resistance, potentially limiting further upward movement.
EUR/JPY:
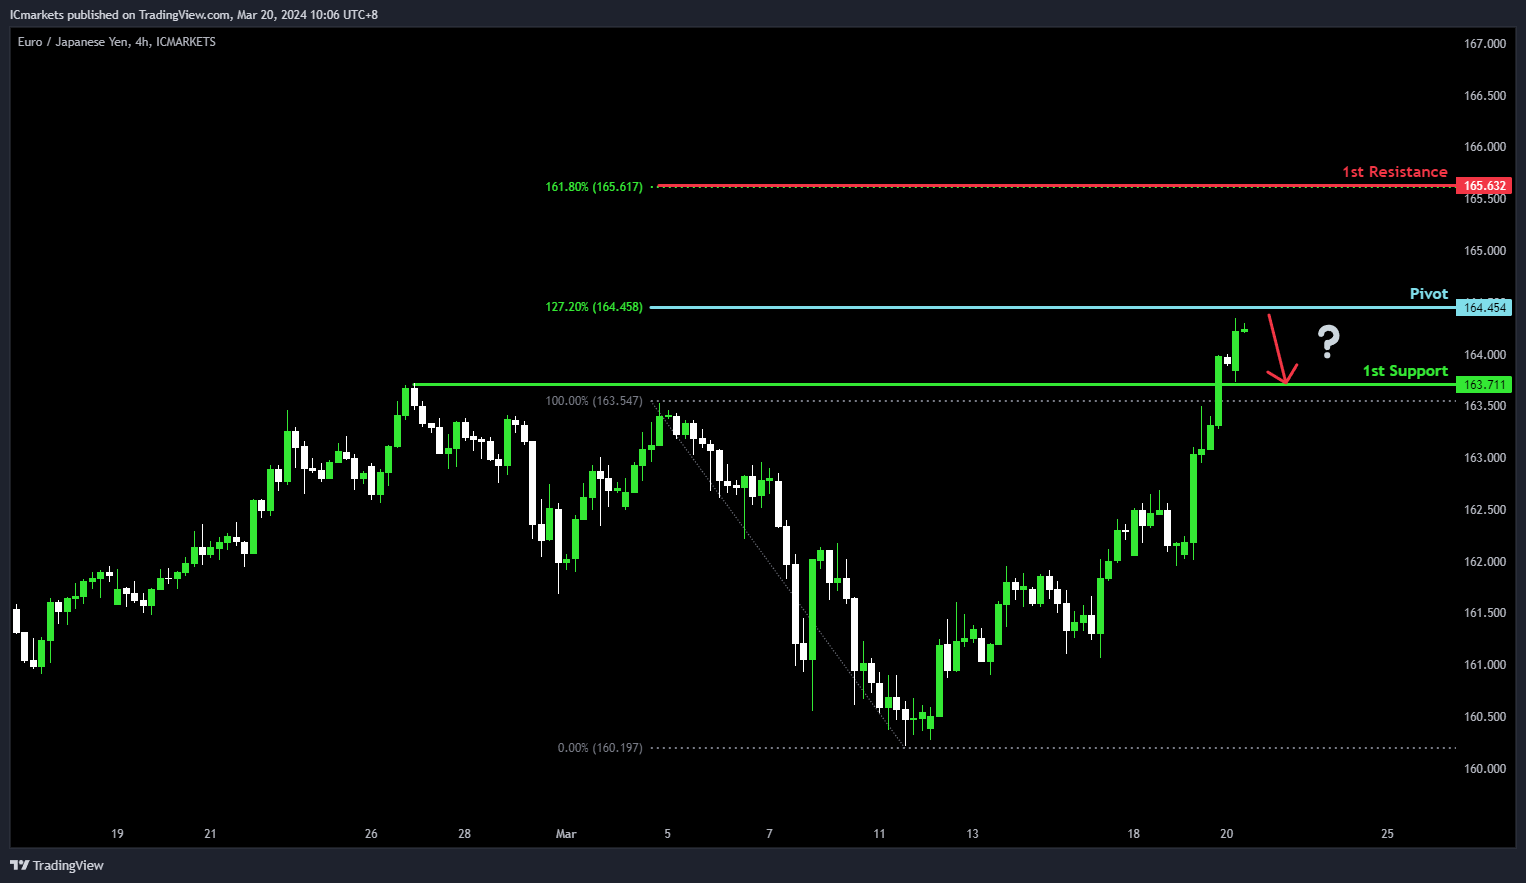
For EUR/JPY, although the overall momentum of the chart remains bullish, there’s a potential for a bearish reaction off the pivot level, suggesting a move towards the 1st support.
The pivot at 164.45 aligns with the 127.20% Fibonacci Extension level, indicating a significant resistance area where selling pressure might increase. This suggests a potential reversal point for the bullish trend.
On the support side, the 1st support at 163.71 acts as an overlap support, historically significant as a level where buyers have intervened before, potentially providing a floor for the price decline.
On the resistance side, the 1st resistance at 165.63 coincides with the 161.80% Fibonacci Extension, forming a barrier to further upward movement and reinforcing the potential bearish sentiment.
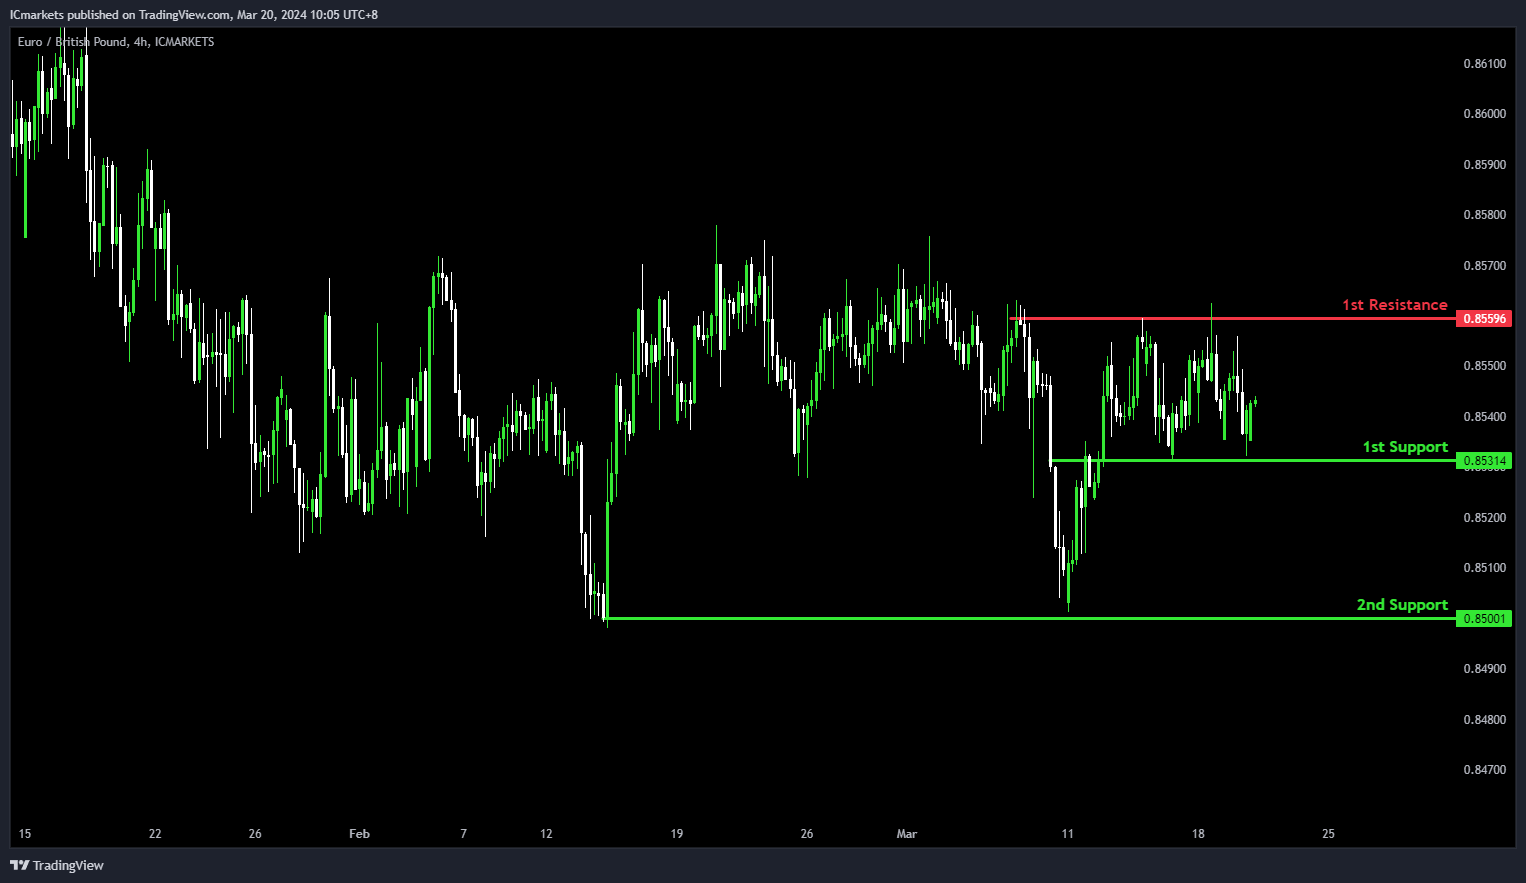
EUR/GBP:
For EUR/GBP, with a neutral outlook and momentum, there’s a likelihood of price oscillating between the 1st resistance and 1st support levels.
The 1st support at 0.8531 is marked by an overlap support, indicating historical significance where buying interest has emerged previously. Additionally, the 2nd support at 0.8500 serves as a swing low support, potentially reinforcing the level where buyers might intervene.
On the resistance side, the 1st resistance at 0.8559 presents a barrier to upward movement, supported by multi-swing high resistance.
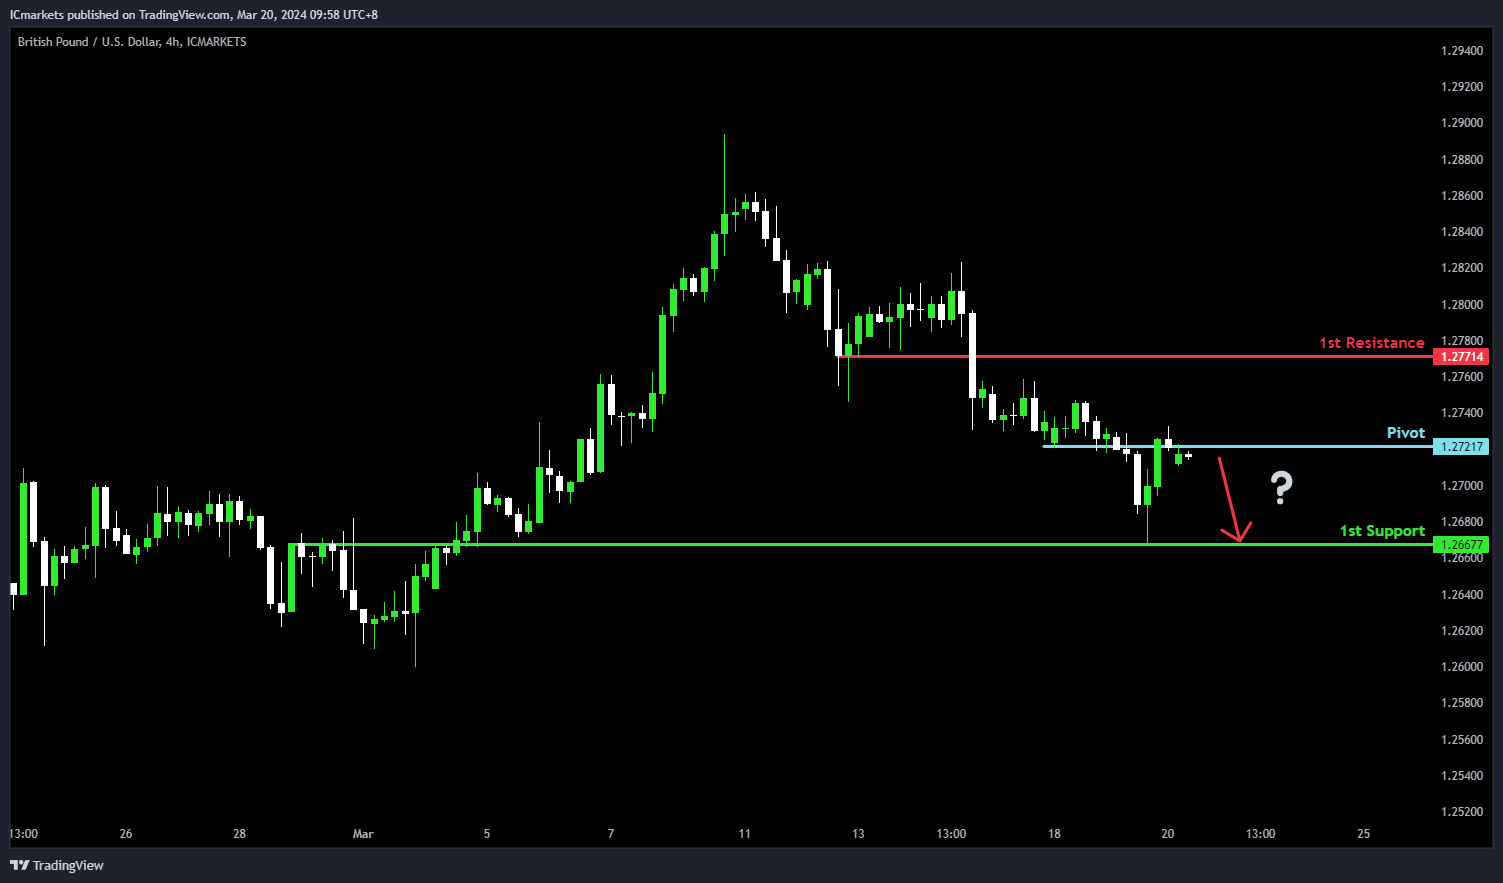
GBP/USD:
For GBP/USD, reflecting the prevailing bearish momentum, there’s a potential for a bearish reaction from the pivot level, possibly leading to a decline towards the 1st support.
The pivot at 1.2721 serves as an overlap resistance, indicating a significant level where selling pressure might intensify. Conversely, the 1st support at 1.2667 acts as an overlap support, historically significant for attracting buying interest.
On the resistance side, the 1st resistance at 1.2771 is identified as pullback resistance, potentially limiting further upward movement.
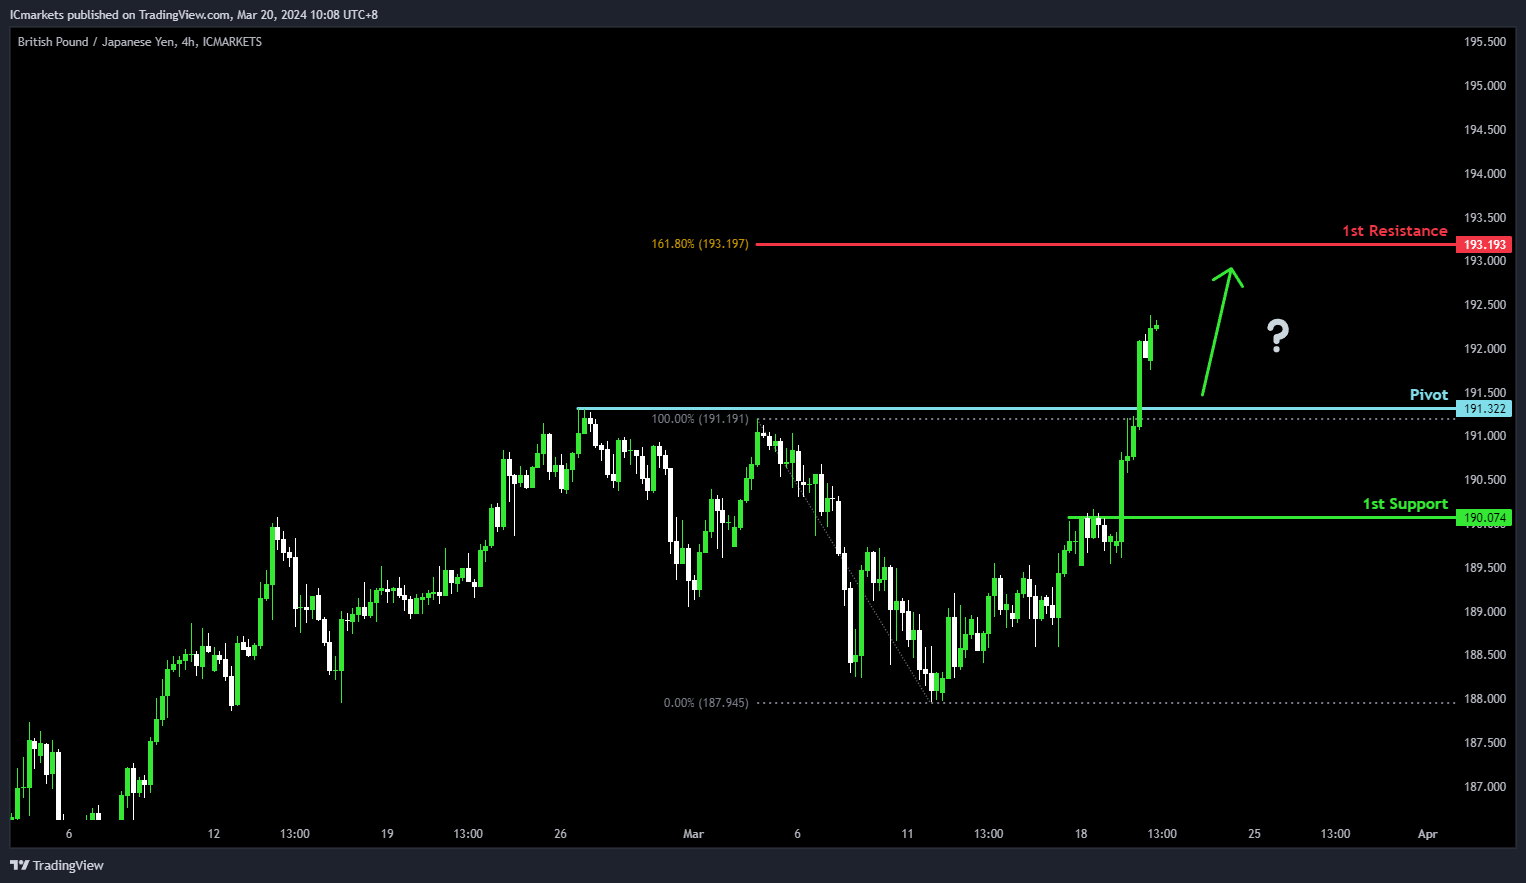
GBP/JPY:
For GBP/JPY, in line with the bullish momentum of the chart, there’s a potential for bullish continuation towards the 1st resistance.
The pivot at 191.32 serves as a significant pullback support, indicating a level where buying interest may emerge, potentially fueling upward momentum.
The 1st support at 190.07 reinforces this sentiment, acting as another level of pullback support, suggesting historical significance as a point where buyers have intervened previously.
On the upside, the 1st resistance at 193.19 aligns with the 161.80% Fibonacci Extension, forming a potential barrier to further upward movement. However, if breached, it could signal continued bullish momentum, potentially leading to further upside targets.
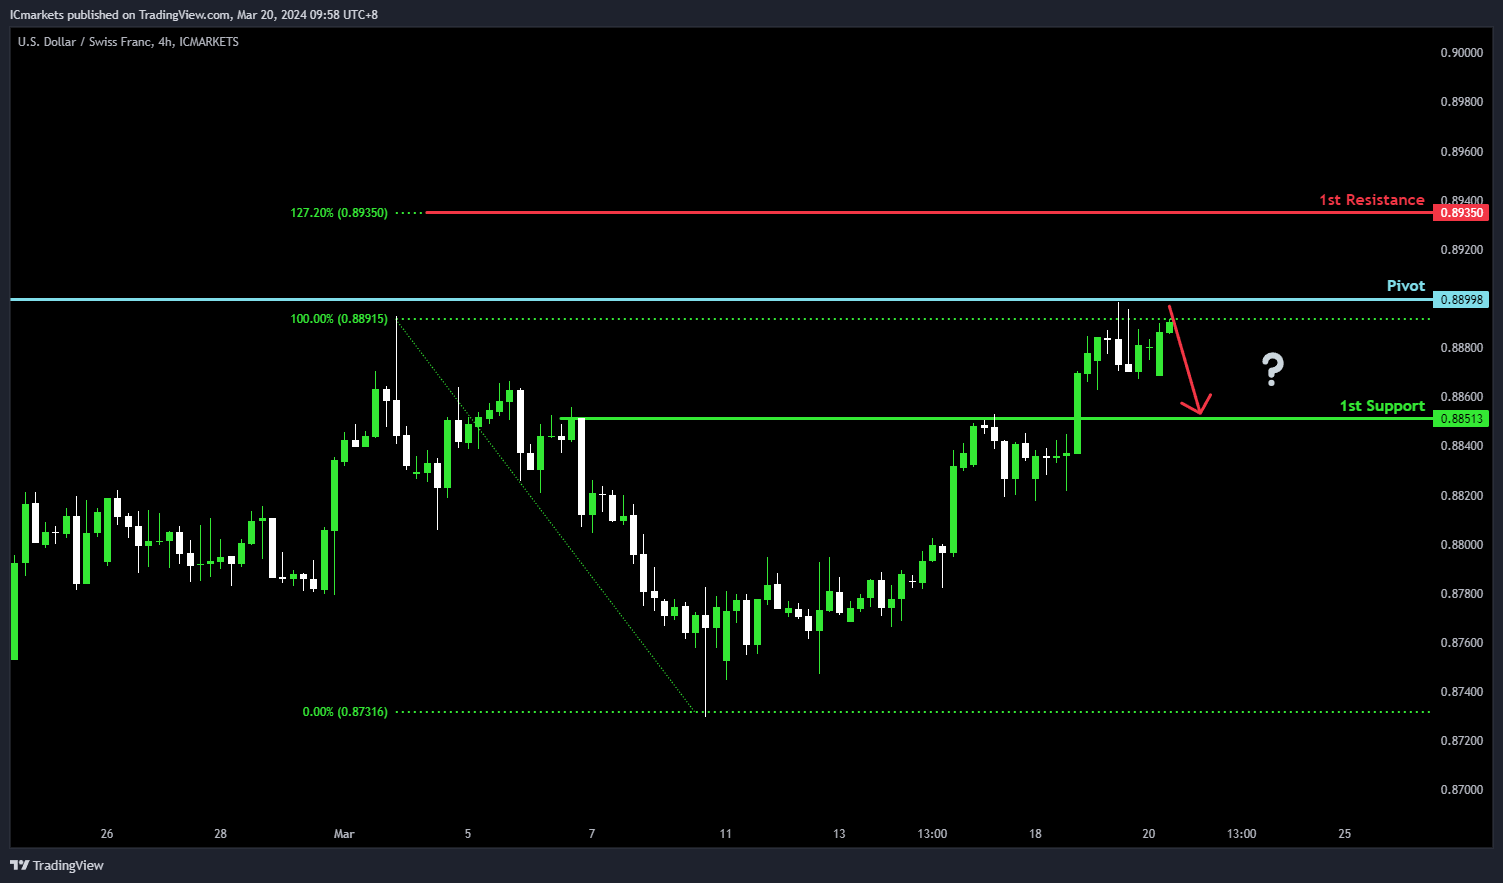
USD/CHF:
For USD/CHF, in alignment with the prevailing bearish momentum, there’s a potential for a bearish reaction from the pivot level, signaling a decline towards the 1st support.
The pivot at 0.8899 is significant, acting as an overlap resistance, suggesting a level where selling pressure might intensify. Conversely, the 1st support at 0.8851 serves as pullback support, indicating a historical level where buyers have intervened.
On the resistance side, the 1st resistance at 0.8935 is reinforced by the 127.20% Fibonacci Extension, potentially acting as a barrier to upward movement.
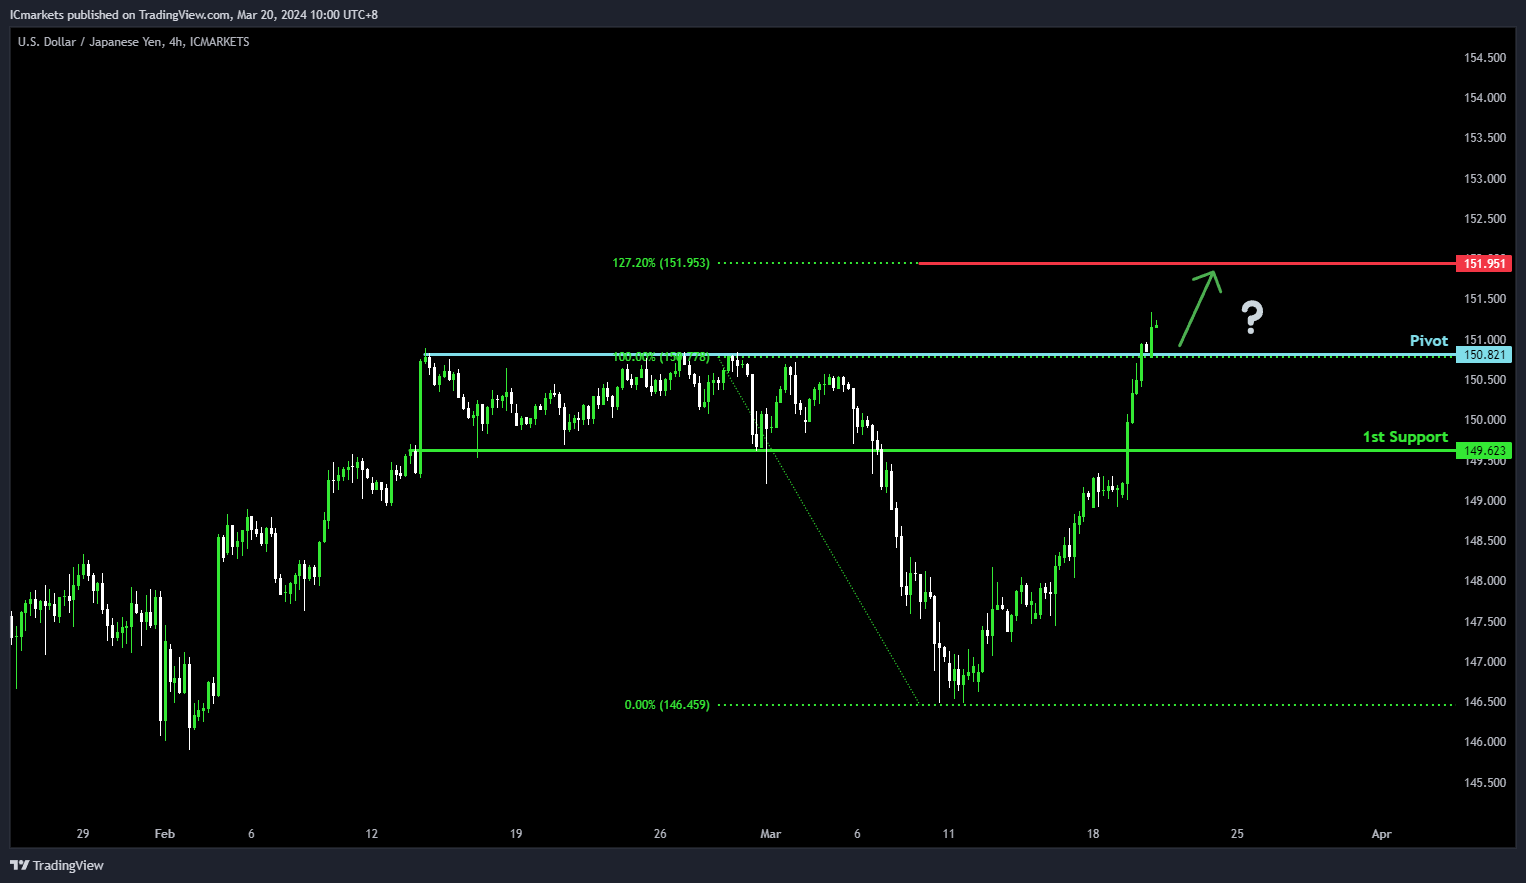
USD/JPY:
FFor USD/JPY, with the overall bullish momentum intact, there’s potential for a bullish bounce from the pivot towards the 1st resistance.
The pivot at 150.82 acts as pullback support, indicating a level where buying interest may emerge. Additionally, the 1st support at 149.62 reinforces this notion, serving as another level where buyers could intervene, supported by historical data.
On the upside, the 1st resistance at 151.95 is significant, backed by the 127.20% Fibonacci Extension, suggesting a potential barrier to further upward movement.
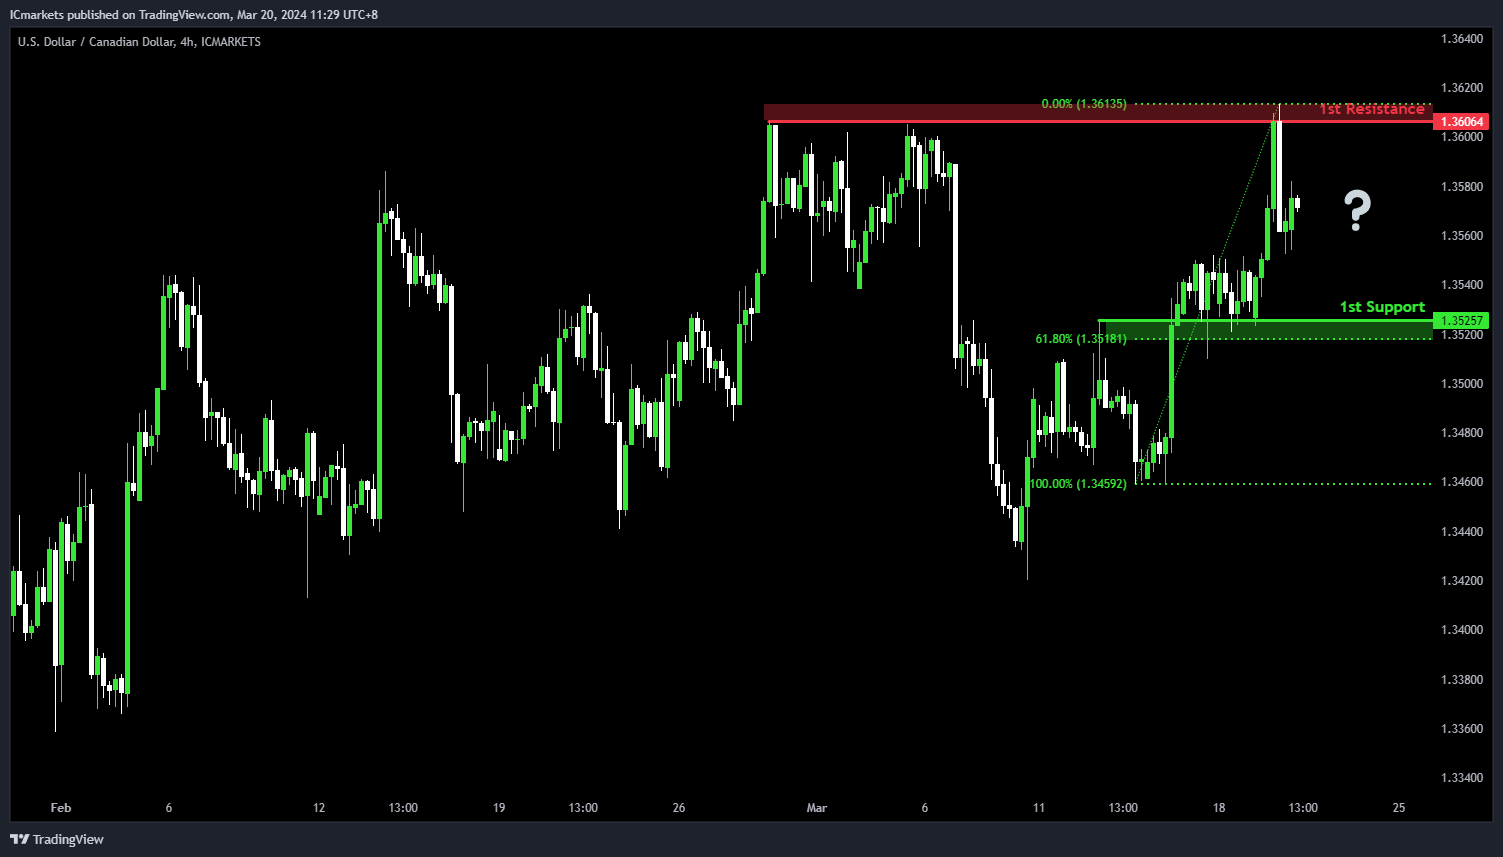
USD/CAD:
The USD/CAD chart currently demonstrates an overall bullish momentum. However, there is a potential scenario for price to fluctuate between the 1st support and the 1st resistance.
The 1st support level at 1.3525 is identified as an overlap support that aligns close to the 61.80% Fibonacci Retracement level, reinforcing its significance as a key support level. Meanwhile the 1st resistance level at 1.3606 is noted as a pullback resistance, further highlighting its importance as a potential resistance zone.
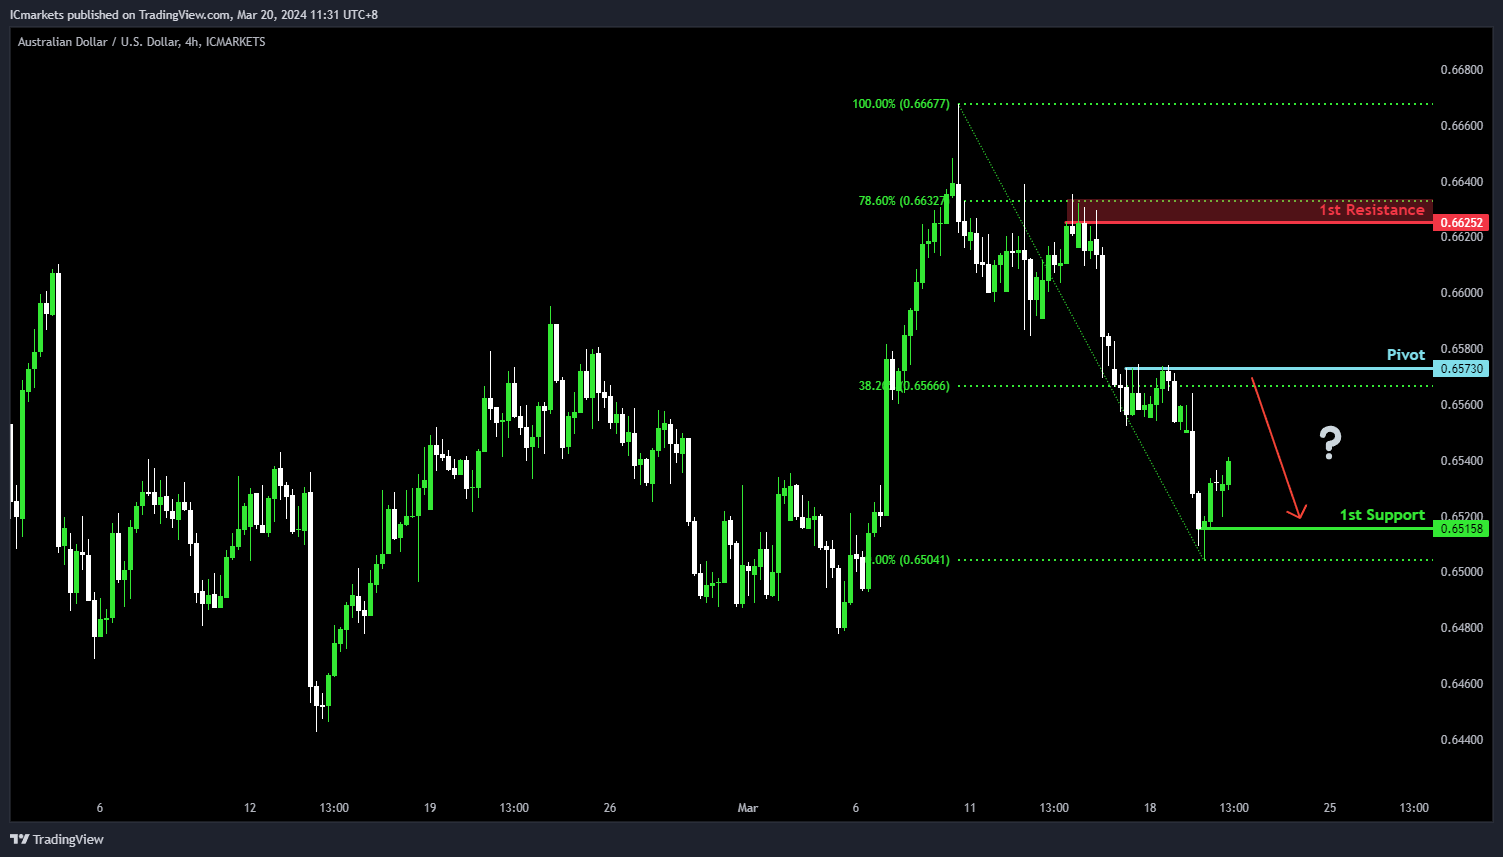
AUD/USD:
The AUD/USD chart currently demonstrates an overall bearish momentum. However, there is a potential scenario for price to rise towards the pivot before potentially resuming the downtrend.
The pivot level at 0.6573 is identified as a pullback resistance that aligns close to the 38.20% Fibonacci Retracement level where price could potentially reverse from to drop lower. The 1st support level at 0.6515 is marked as a pullback support, reinforcing its significance as a key support level.
On the resistance side, the 1st resistance level at 0.6625 is noted as a pullback resistance that aligns close to the 78.60% Fibonacci Retracement level, potentially limiting any further upward movement.
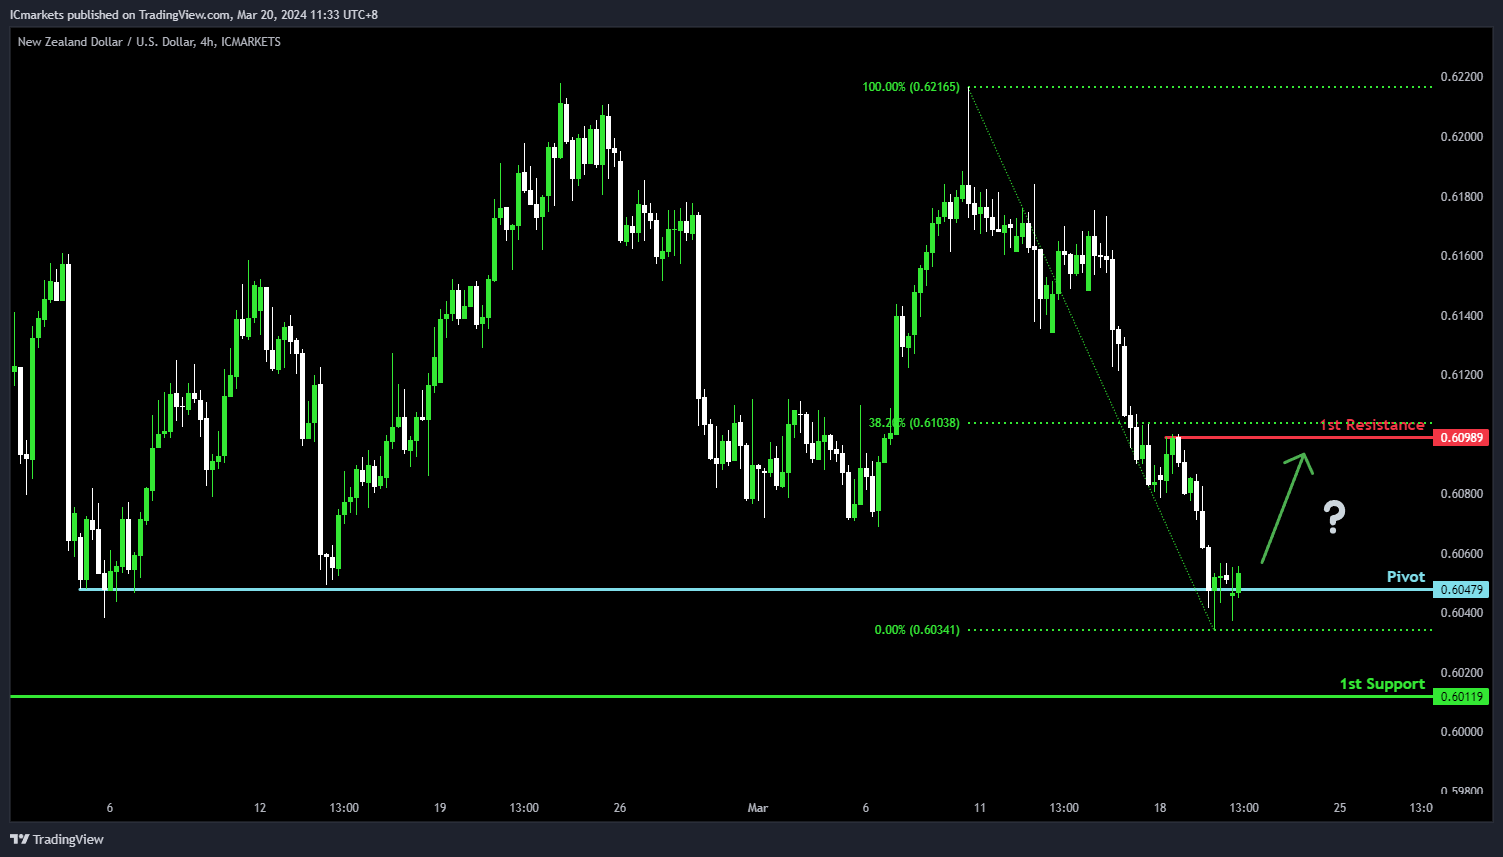
NZD/USD
The NZD/USD chart currently demonstrates an overall bearish momentum. However, there is a potential scenario for price to bounce off the pivot and rise towards the 1st resistance.
The pivot level at 0.6047 is identified as a multi-swing-low support where price could potentially bounce off to climb higher. The 1st resistance level at 0.6098 is noted as a pullback resistance that aligns close to the 38.20% Fibonacci Retracement level, potentially limiting any further upward movement.
On the support side, the 1st support level at 0.6011 is marked as a pullback support, reinforcing its significance as a key support level.
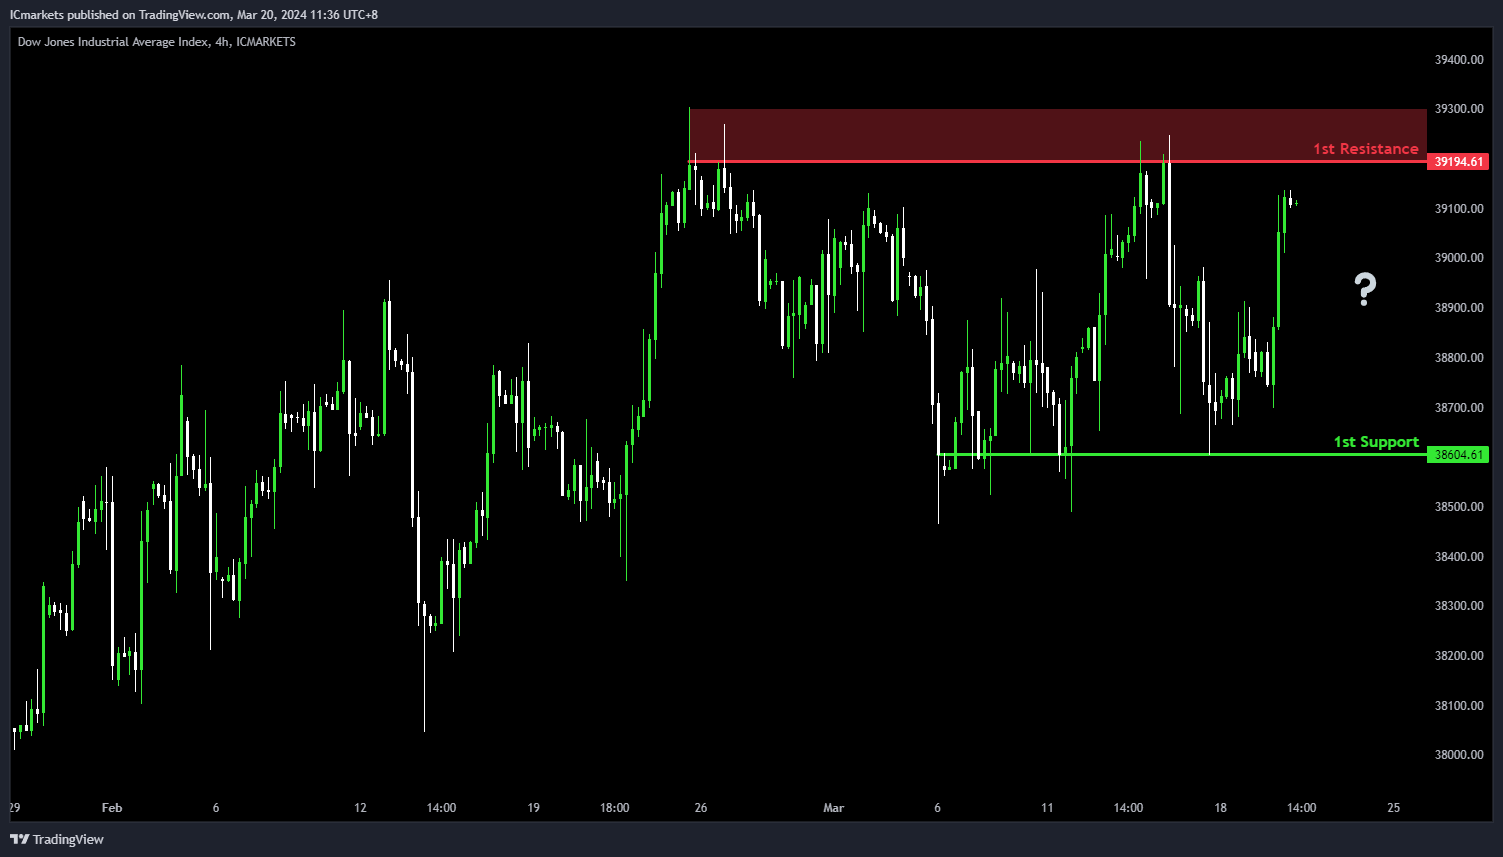
DJ30:
The Dow Jones chart (DJ30) currently exhibits a neutral bias. In this context, there is a potential scenario for price to fluctuate between the 1st support and the 1st resistance.
The 1st resistance level at 39,194.61 is identified as a pullback resistance, potentially impeding any further bullish movement. Meanwhile, the 1st support level at 38,604.61 is noted as a pullback support, reinforcing its significance as a key support level.
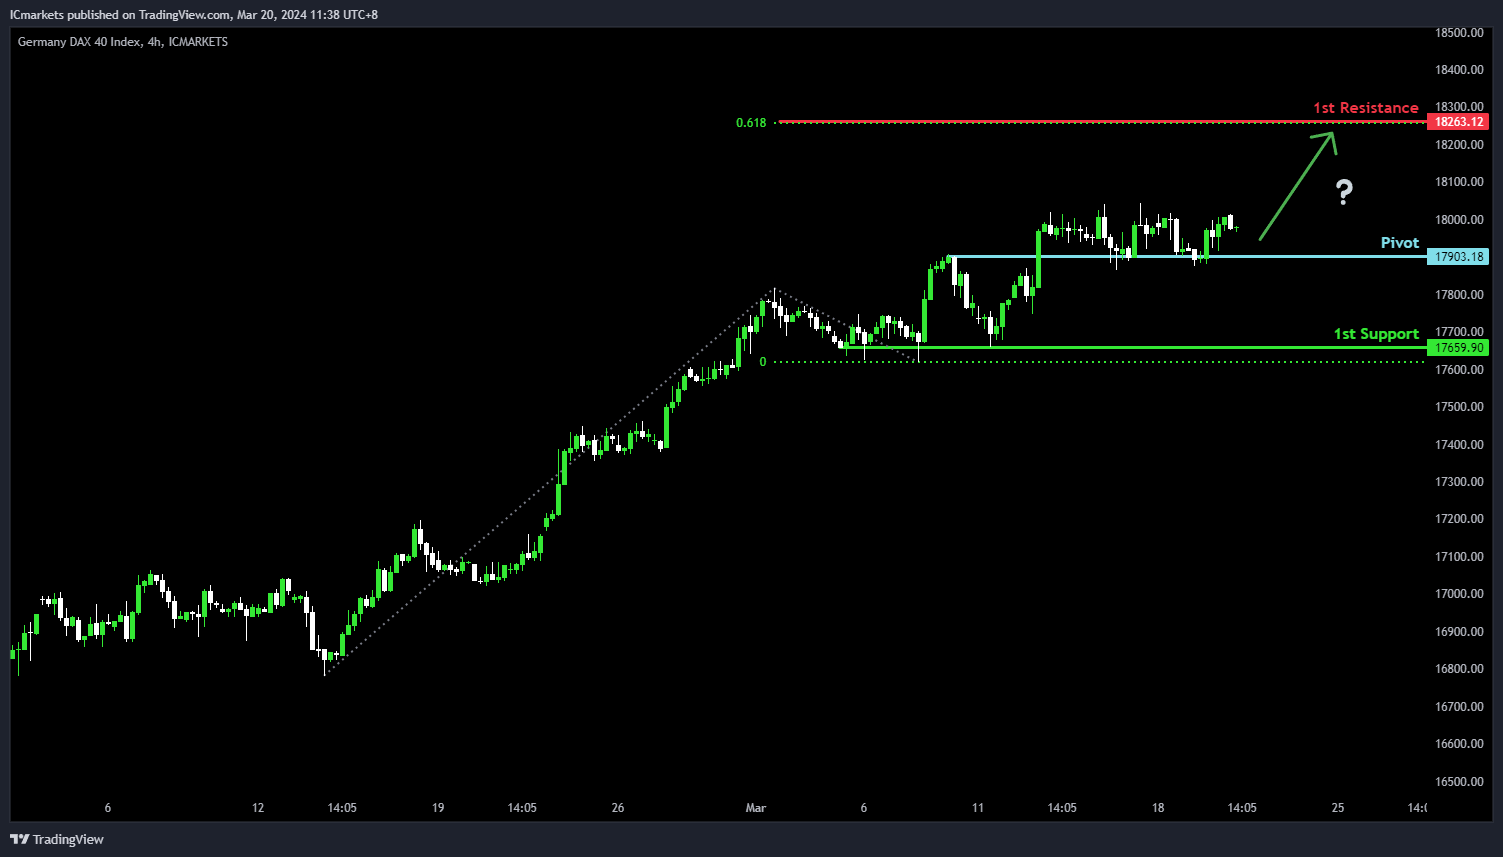
GER40:
The DAX chart (GER40) currently exhibits an overall bullish momentum. In this context, there is a potential scenario for price to bounce off the pivot and rise towards the 1st resistance.
The pivot level at 17,903.18 is identified as an overlap support where price could potentially bounce off to climb higher. The 1st resistance level at 18,263.12 is noted as a resistance level that aligns with the 61.80% Fibonacci Projection level, potentially limiting any further upward movement.
On the support side, the 1st support level at 17,659.90 is marked as a pullback support, reinforcing its significance as a key support level.
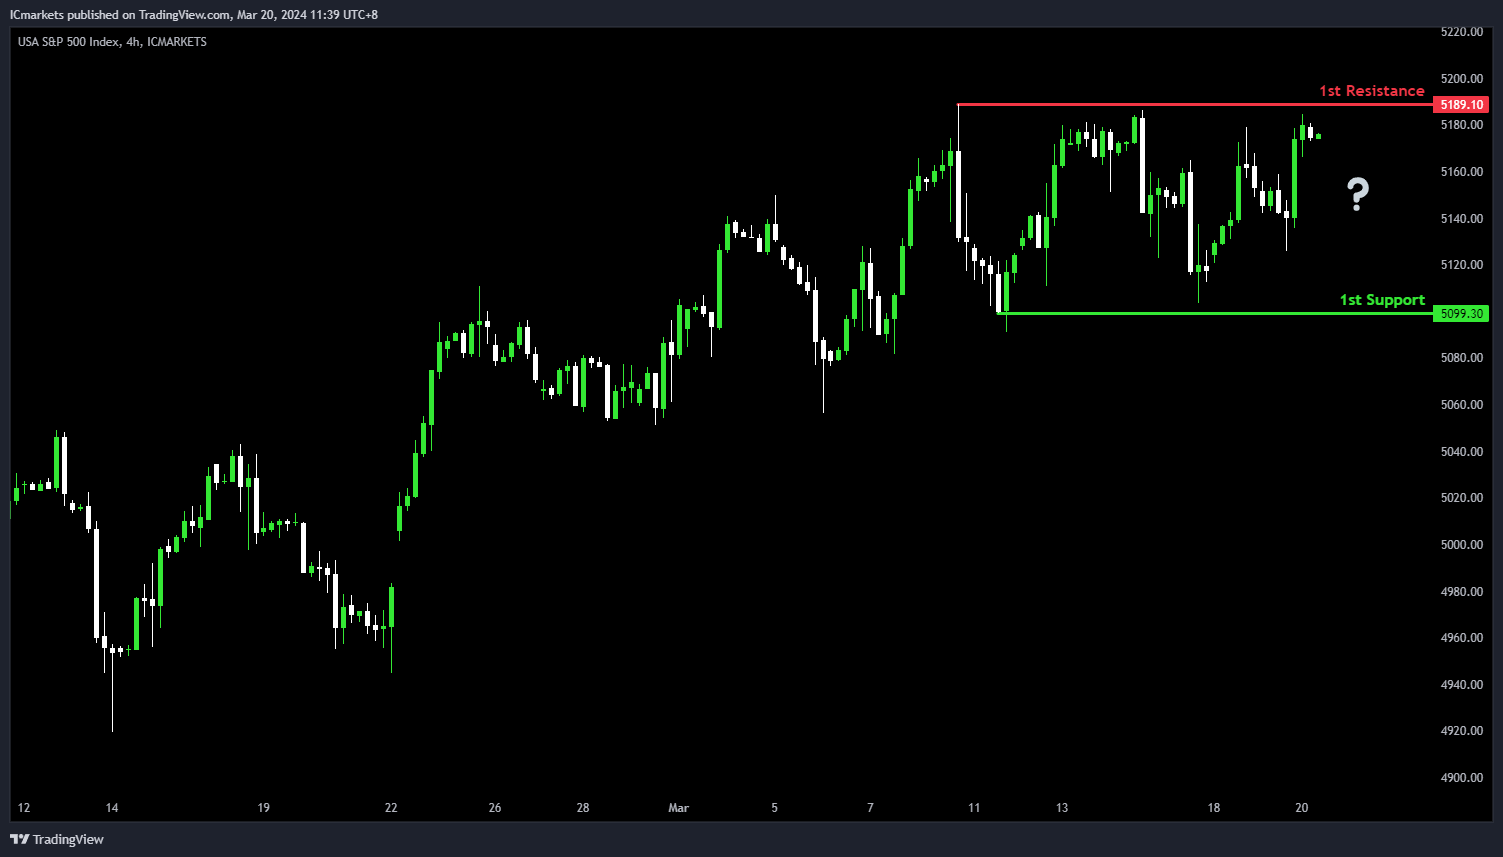
US500:
The S&P 500 chart (US500) currently exhibits a neutral bias. In this context, there is a potential scenario for price to fluctuate between the 1st support and the 1st resistance.
The 1st resistance level at 5,189.10 is identified as a pullback resistance, potentially impeding any further bullish movement. Meanwhile, the 1st support level at 5,099.30 is noted as a pullback support, reinforcing its significance as a key support level.
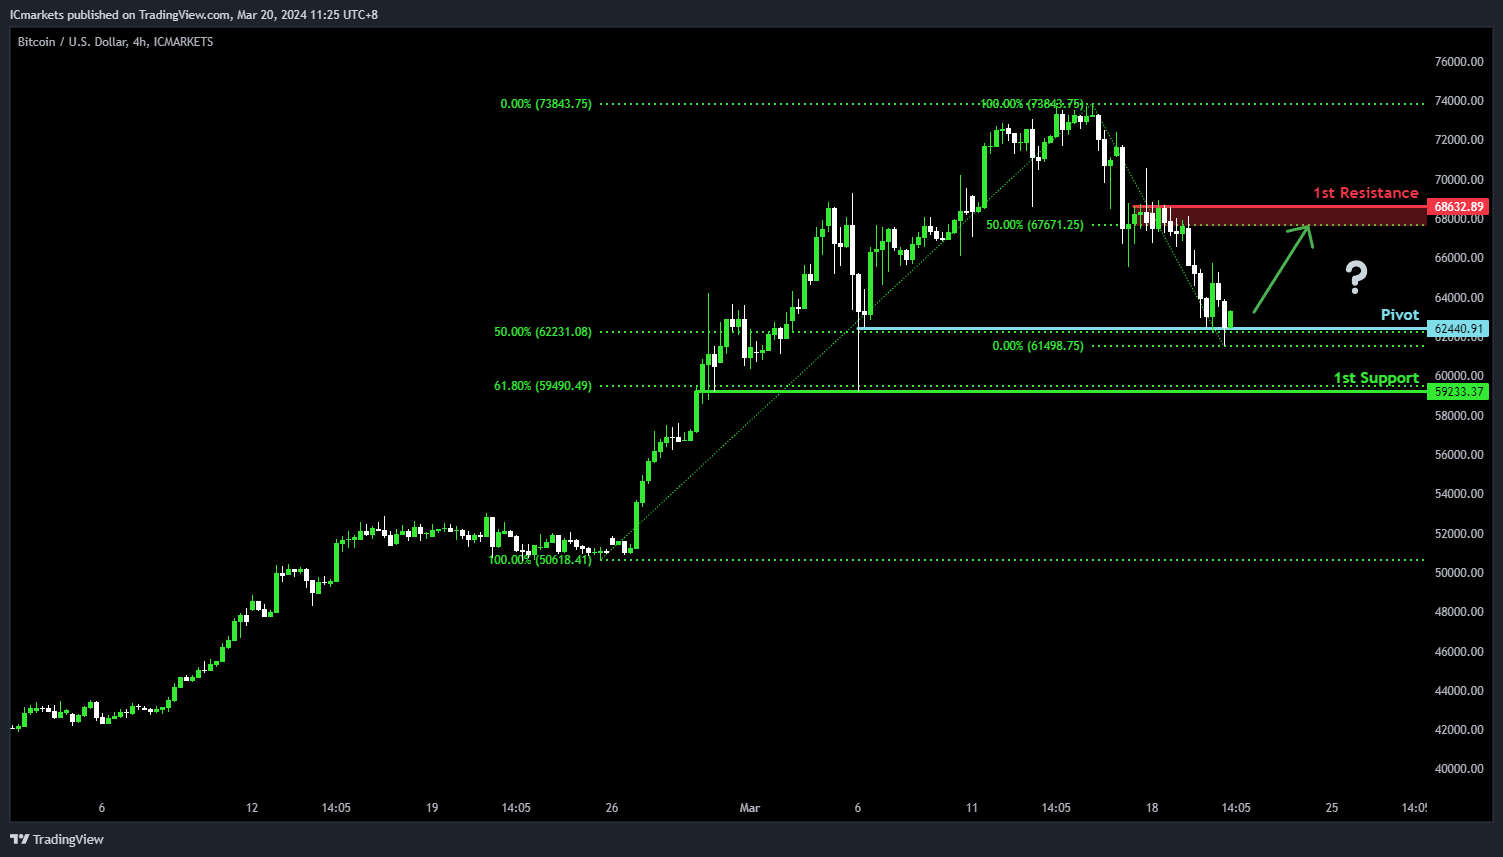
BTC/USD:
The Bitcoin chart (BTC/USD) currently demonstrates an overall bearish momentum. However, there is a potential scenario for price to bounce off the pivot and rise towards the 1st resistance.
The pivot level at 62,440.91 is identified as a pullback support that aligns with the 50.00% Fibonacci Retracement level where price could potentially make a bullish bounce. The 1st resistance level at 68,632.89 is noted as a pullback resistance that aligns close to the 50.00% Fibonacci Retracement level, further reinforcing its significance as a potential barrier to further bullish movement.
To the downside, the 1st support level at 59,233.37 is marked as a pullback support that aligns with the 61.80% Fibonacci Retracement level, reinforcing its significance as a key support level.
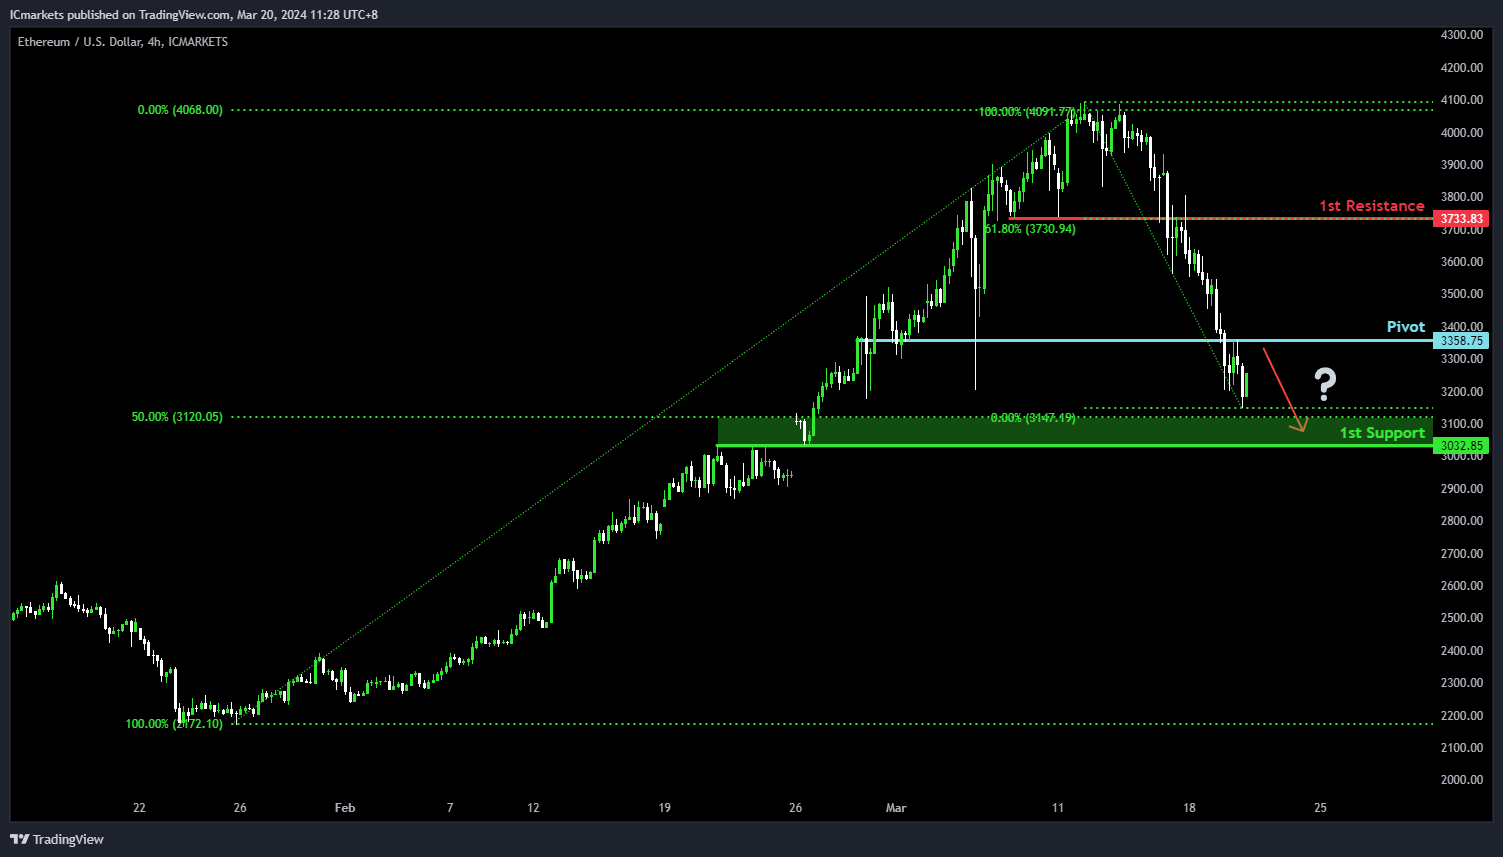
ETH/USD:
The Ethereum chart (ETH/USD) currently demonstrates an overall bearish momentum. However, there is a potential scenario for price to rise towards the pivot before potentially reversing to drop towards the 1st support.
The pivot level at 3,358.75 is identified as an overlap resistance where price could potentially make a bearish reversal. The 1st support level at 3,032.85 is marked as an overlap support that aligns close to the 50.00% Fibonacci Retracement level, reinforcing its significance as a key support level.
To the upside, the 1st resistance level at 3,733.83 is noted as an overlap resistance that aligns with the 61.80% Fibonacci Retracement level, further reinforcing its significance as a potential barrier to further bullish movement.
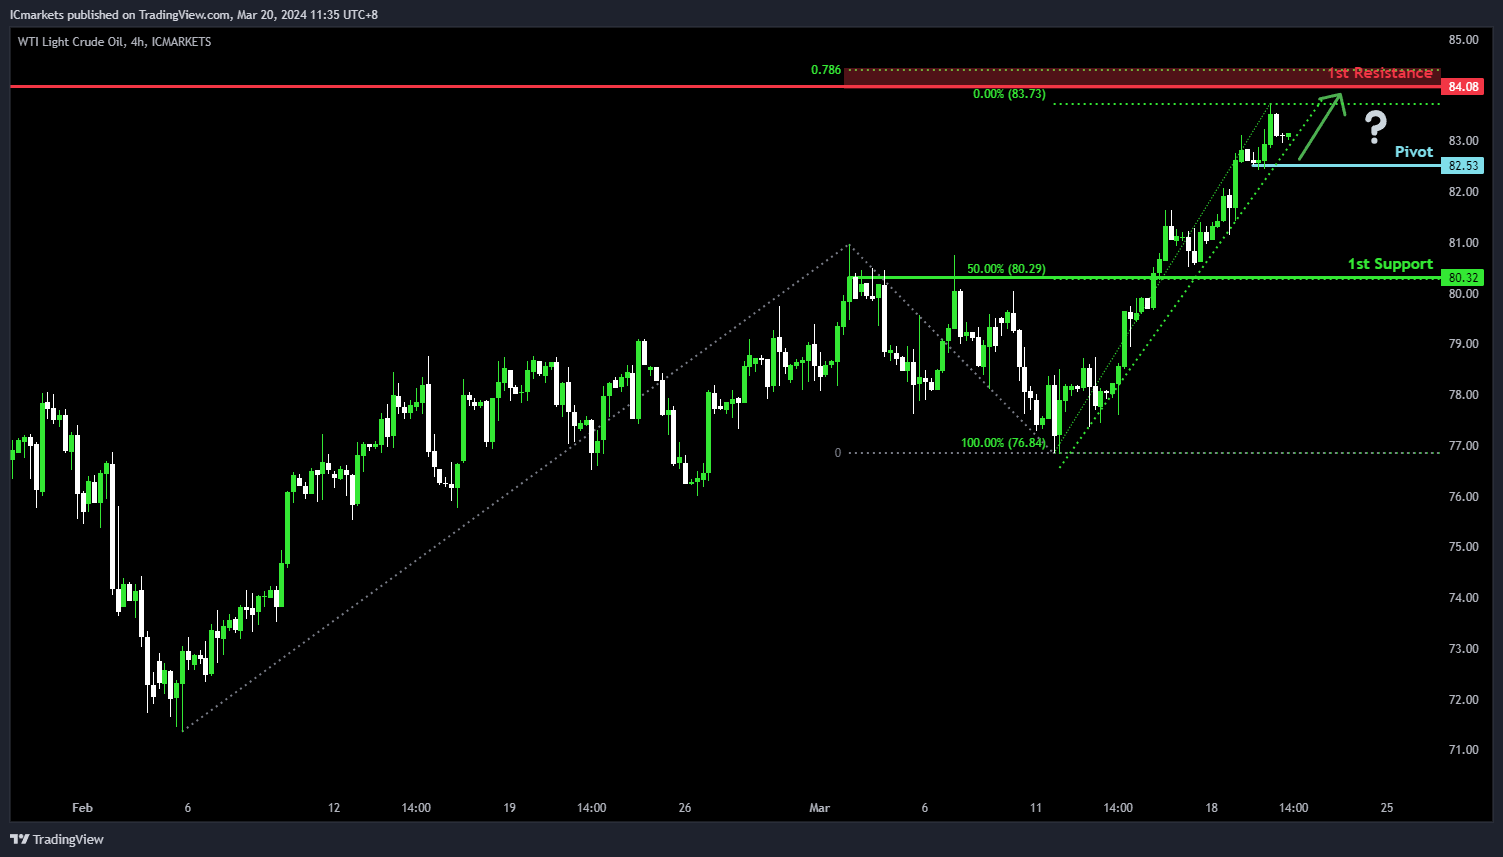
WTI/USD:
The WTI (West Texas Intermediate) oil chart currently demonstrates an overall bullish momentum as supported by the ascending trendline. Howere, there is a potential scenario for price to fall towards the pivot before making a bullish bounce to rise towards the 1st resistance.
The pivot level at 82.53 is identified as a pullback support where price could potentially make a bullish bounce. The 1st resistance level at 84.08 is noted as an overlap resistance that aligns close to the 78.60% Fibonacci Projection level, further reinforcing its significance as a potential barrier to further bullish movement.
To the downside, the 1st support level at 80.32 is marked as a pullback support that aligns with the 50.00% Fibonacci Retracement level, reinforcing its significance as a key support level.
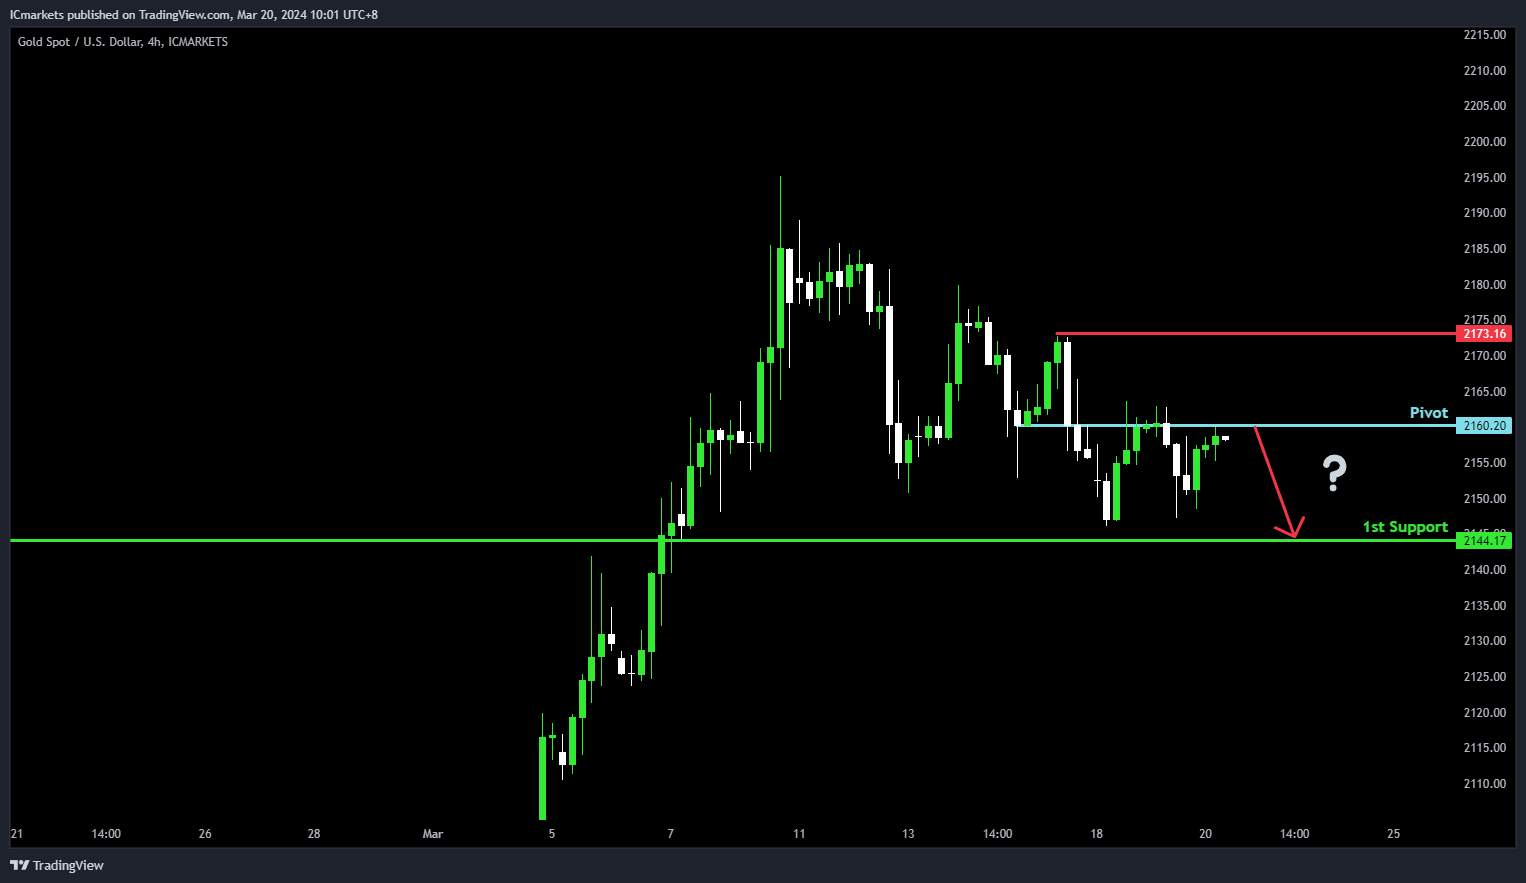
XAU/USD (GOLD):
For XAU/USD, despite the overall bullish momentum, there’s a potential for a bearish reaction from the pivot towards the 1st support.
The pivot at 2160.20 serves as an overlap support, indicating a level where buyers have historically intervened. Additionally, the 1st support at 2144.17 reinforces this notion, acting as a pullback support level where buying interest may increase.
On the other hand, the 1st resistance at 2173.16 forms a significant barrier, backed by swing high resistance, potentially limiting further upward movement.
Bitcoin Price Drops Below $65K, Fed Rate Decision Next
Key Highlights
- Bitcoin price started a downside correction below $70,000 and $68,000.
- A key bearish trend line is forming with resistance at $65,800 on the 4-hour chart.
- USD/JPY rallied following the Bank of Japan's (BoJ) first historic interest rate hike.
- EUR/USD and GBP/USD also saw bearish moves.
Bitcoin Price Technical Analysis
Bitcoin price started a downside correction from the $73,850 zone. BTC traded below the $70,000 and $68,000 support levels to move into a short-term bearish zone.
Looking at the 4-hour chart, the price settled below the $66,500 level, and the 100 simple moving average (red, 4 hours). The price declined below the $65,000 support and tested the 50% Fib retracement level of the upward move from the $50,896 swing low to the $73,858 high.
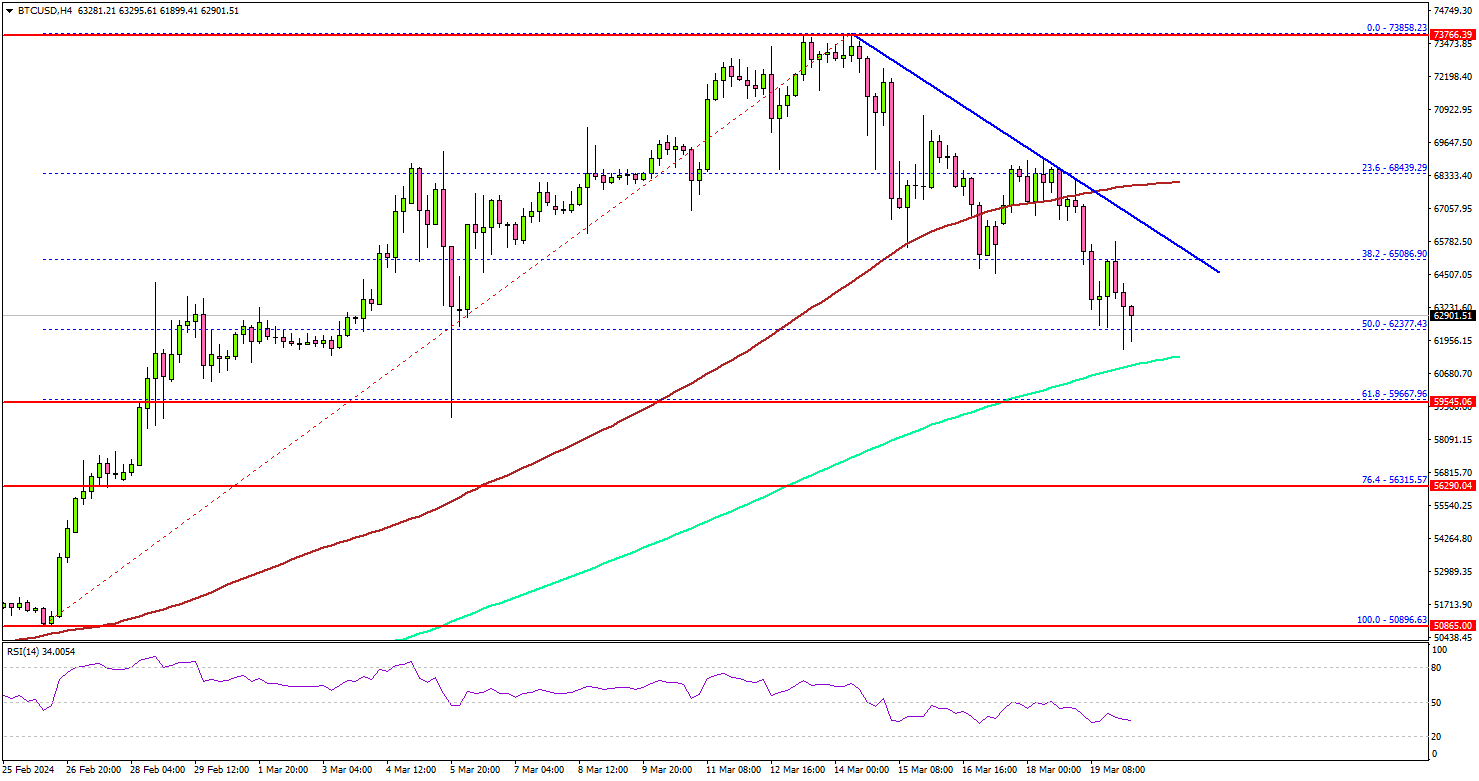
The price is now testing the $62,500 support zone. The next major support is near the 200 simple moving average (green, 4 hours) at $61,500.
Any more losses might send the price toward the $60,000 support zone or the 61.8% Fib retracement level of the upward move from the $50,896 swing low to the $73,858 high.
Immediate resistance is near the $64,500 level. The next resistance is near $66,000. There is also a key bearish trend line forming with resistance at $65,800 on the same chart. The main resistance could be $68,000 and the 100 simple moving average (red, 4 hours).
A successful close above the 100 simple moving average (red, 4 hours) might start another steady increase. In the stated case, the price may perhaps rise toward the $72,000 level.
Economic Releases
- Fed Interest Rate Decision - Forecast 5.5%, versus 5.5% previous.
New Zealand Westpac consumer confidence rises to 93.2 in Q1, yet pessimism lingers
New Zealand Westpac Consumer Confidence rose from 88.9 to 93.2 in Q1, marking its highest level in over two years. Despite this rise, the index continues to hover below the pivotal 100 mark, indicating prevailing sense of pessimism among New Zealanders regarding economic conditions. Present Conditions Index saw significant uplift from 77.1 to 85.1, while Expected Conditions Index advanced modestly from 96.7 to 98.6.
Westpac's analysis highlights that households are gradually feeling more optimistic about their financial situations, which has subsequently spurred an increase in "spending appetites". This positive shift in consumer sentiment is observed across all income brackets, with "middle-income households exhibiting" the most marked improvement.
GBP: Analysts Predict Lower CPI Figures
In its February meeting, the Bank of England kept interest rates unchanged at 5.25%, the highest in 16 years. While one policymaker advocated for a rate cut, the central bank refrained from signaling any imminent changes, citing the need for further evidence on inflation. With inflation stable at 4.0% y/y in January and the economy emerging from recession, policymakers are cautious about premature rate cuts. BoE Governor Andrew Bailey hinted at potential rate cuts but emphasized the importance of sustained progress in key economic indicators. However, uncertainties remain, particularly regarding wage growth and geopolitical risks.
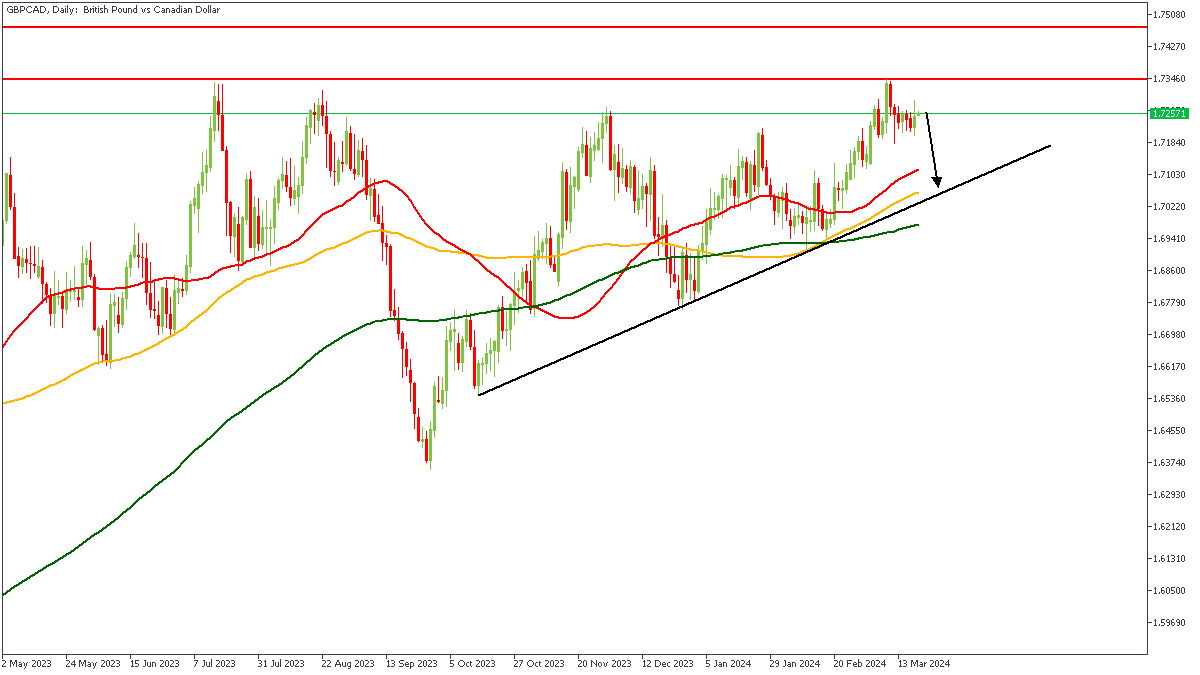
GBPCAD - D1 Timeframe
The horizontal bars on the Daily timeframe of GBPCAD represents the pivot zone on the weekly timeframe. The sketchy movement as price approaches the pivot zone indicates a loss of momentum for the buys, which could be a crucial trigger for bearish pressure. As a result, I expect price to bounce off the weekly pivot and reach for the trendline support.
Analyst’s Expectations:
- Direction: Bearish
- Target: 1.70898
- Invalidation: 1.73567
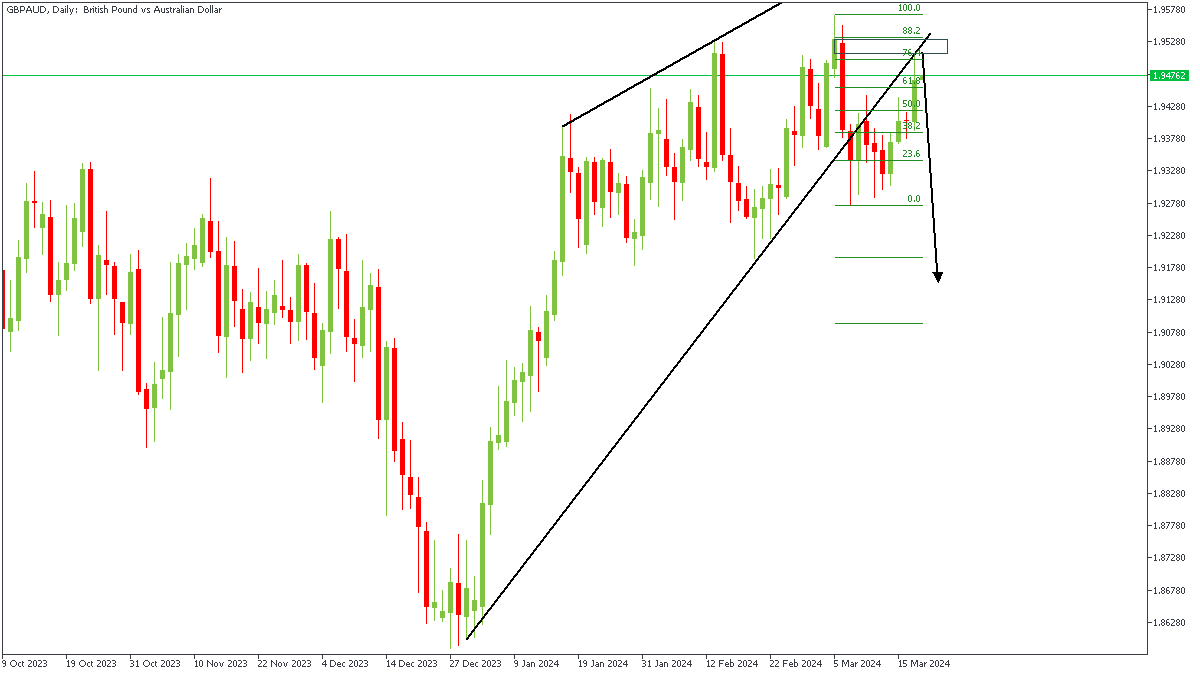
GBPAUD - D1 Timeframe
GBPAUD has recently broken below the trendline support of a wedge pattern; the impulse also breaking below the previous low. Considering the break of structure, I believe that price should react off the rally-base-drop supply zone at the 88% of the Fibonacci retracement zone.
Analyst’s Expectations:
- Direction: Bearish
- Target: 1.93489
- Invalidation: 1.95453
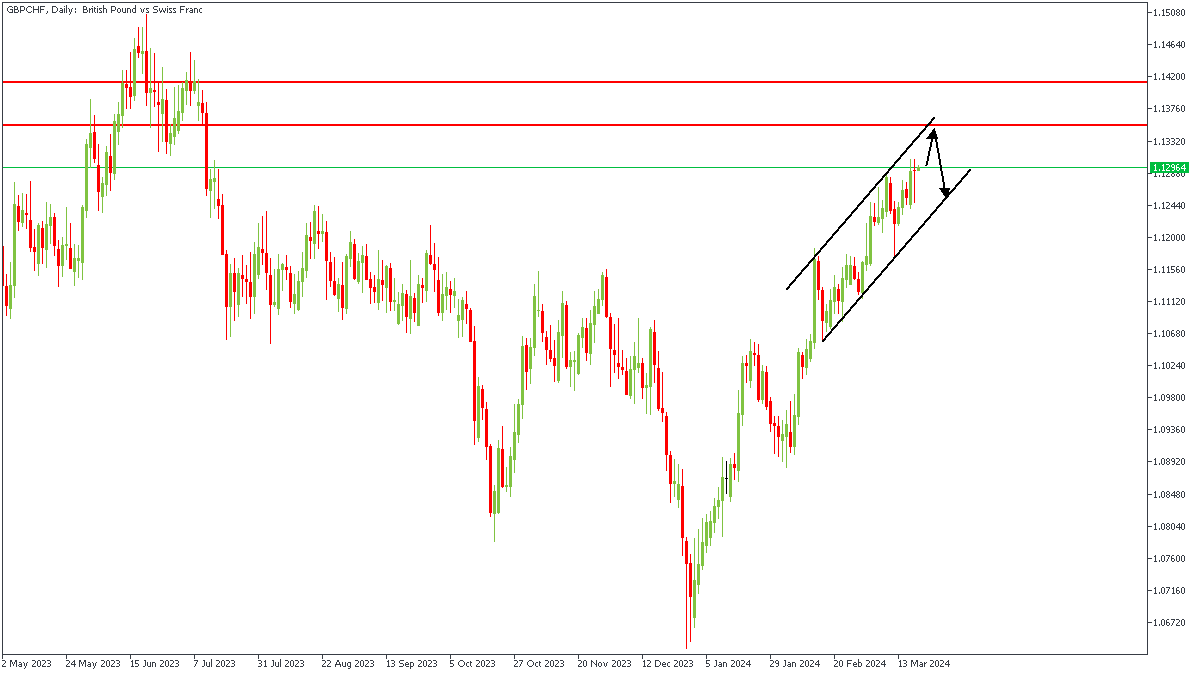
GBPCHF - D1 Timeframe
A basic knowledge of chart patterns informs us that when a pattern is formed close to a crucial support or resistance, we can expect to see a rejection from that particular zone of interest. In the case of GBPCHF as seen on the daily timeframe chart, we can see price currently consolidating in a channel pattern as it approaches the weekly pivot. On this basis, I expect to see a sharp rejection from the pivot once price touches the trendline resistance of the equidistant channel pattern.
Analyst’s Expectations:
- Direction: Bearish
- Target: 1.12621
- Invalidation: 1.13944
CONCLUSION
The trading of CFDs comes at a risk. Thus, to succeed, you have to manage risks properly. To avoid costly mistakes while you look to trade these opportunities, be sure to do your due diligence and manage your risk appropriately.
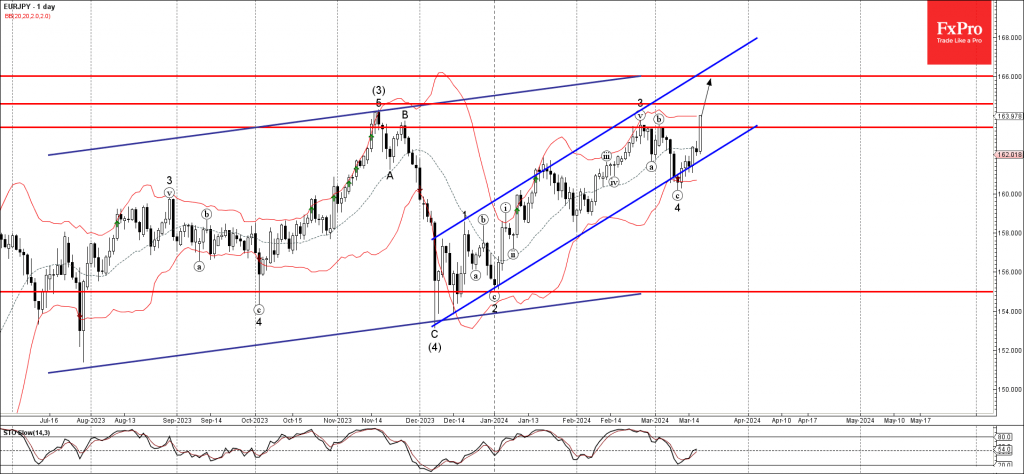
EURJPY Wave Analysis
- EURJPY broke pivotal resistance level 163.40
- Likely to rise to resistance level 164.35
EURJPY today broke above the pivotal resistance level 163.40 (which stopped the previous waves 3 and (b), as can be seen from the daily EURJPY chart below).
The breakout of the resistance level 163.40 continues the active minor impulse wave 5 of the intermediate impulse wave (5) from the start of December.
Given the clear daily uptrend, EURJPY currency pair can be expected to rise further toward the next resistance level 164.35 (top of wave (3) from November) – followed by 166.00.
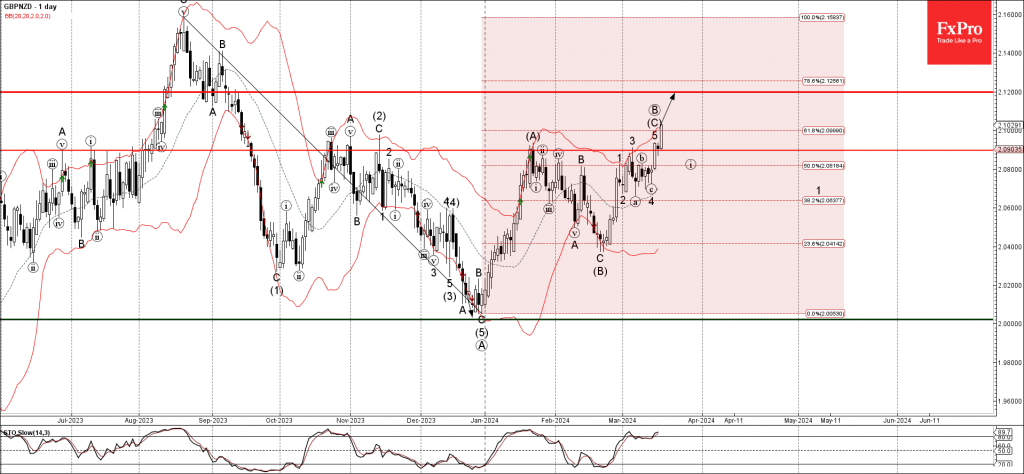
GBPNZD Wave Analysis
- GBPNZD broke resistance level 2.0895
- Likely to rise to resistance level 2.1200
GBPNZD today broke the major resistance level 2.0895 (which has been reversing the price from the end of October, as can be seen from the daily GBPNZD chart below).
The breakout of the resistance level 2.0895 coincided with the breakout of the 50% Fibonacci correction of the previous downtrend from August.
Given the strongly bullish sterling sentiment, GBPNZD currency pair can be expected to rise further toward the next resistance level 2.1200.