
Sample Category Title
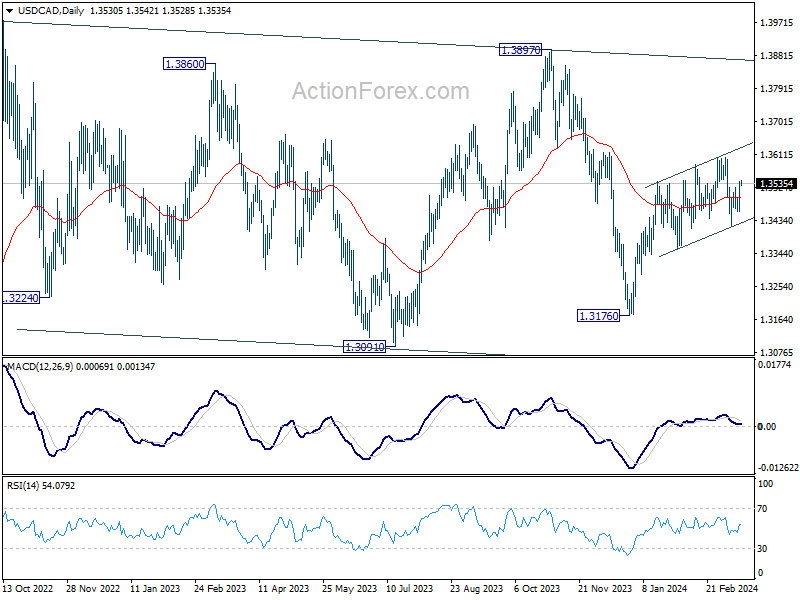
USD/CAD Daily Outlook
Daily Pivots: (S1) 1.3482; (P) 1.3511; (R1) 1.3563; More...
USD/CAD's break of 1.3524 minor resistance suggests that pull back from 1.3605 has completed at 1.3419 already. Also, rise from 1.3176 is in progress. Intraday bias is back on the upside for retesting 1.3605 resistance first. Firm break there will resume whole rally from 1.3176. On the downside, however, break of 1.3458 minor support will turn bias back to the downside or 1.3419 instead.
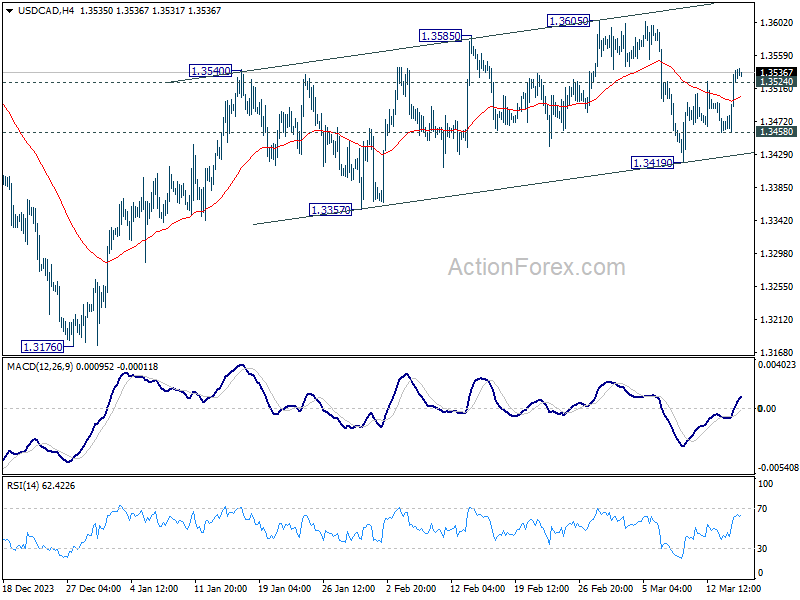
In the bigger picture, price actions from 1.3976 (2022 high) are viewed as a corrective pattern only. In case of another fall, strong support should emerge above 1.2947 resistance turned support to bring rebound. Overall, larger up trend from 1.2005 (2021 low) is still expected to resume through 1.3976 at a later stage.
AUD/USD Daily Report
Daily Pivots: (S1) 0.6557; (P) 0.6594; (R1) 0.6619; More...
AUD/USD's break of 55 4H EMA (now at 0.6585) argues that corrective recovery from 0.6442 has completed with three waves up to 0.6666. Intraday bias is back on the downside for 0.6476 support first. Break there will argue that decline from 0.6870 is ready to resume. On the upside, break of 0.6629 minor resistance will turn bias back to the upside to extend the rebound from 0.6442 instead.
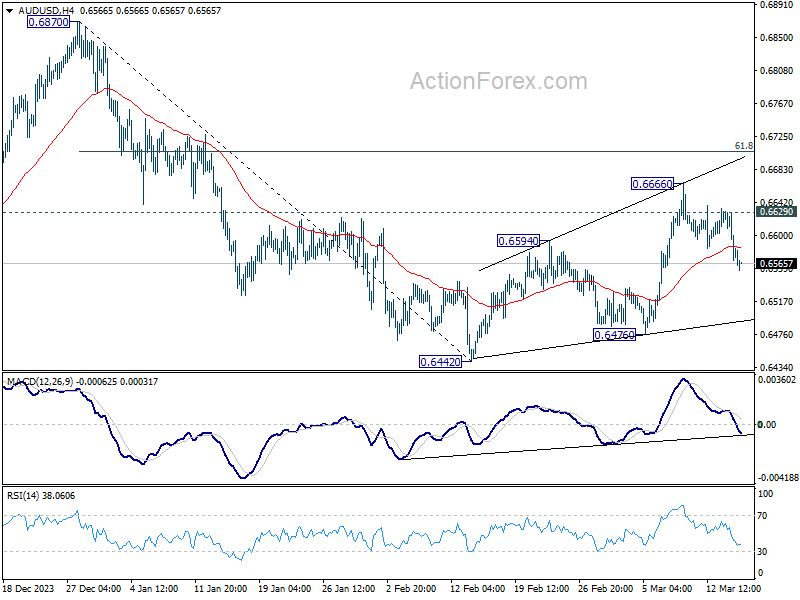
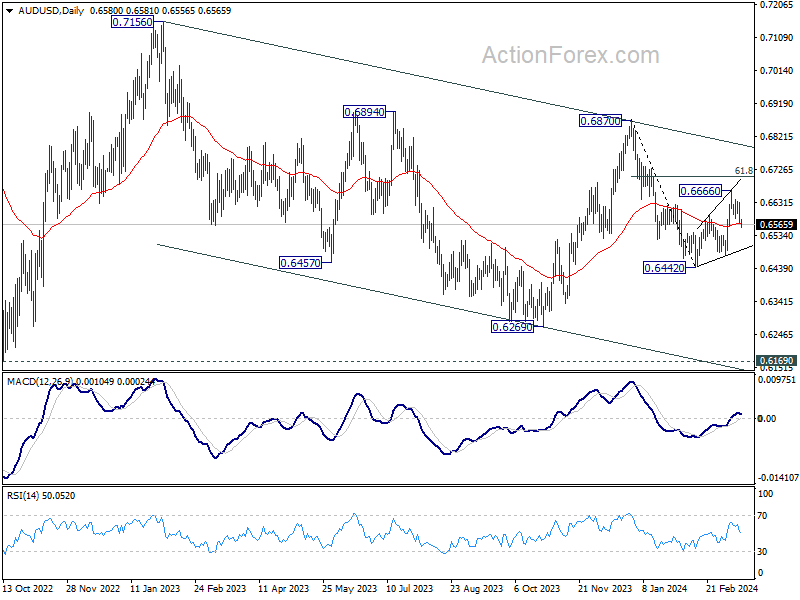
In the bigger picture, price actions from 0.6169 (2022 low) are seen as a medium term corrective pattern to the down trend from 0.8006 (2021 high). Fall from 0.7156 (2023 high) is seen as the second leg, which might still be in progress. Overall, sideway trading could continue in range of 0.6169/7156 for some more time. But as long as 0.7156 holds, an eventual downside breakout would be mildly in favor.
Dollar Strengthens as Treasury Yields Surge, Anticipating a Hawkish Fed Shift?
Dollar rebounded strongly overnight along with rally in treasury yields, and maintained its strength in Asian session. This resurgence is largely attributed to traders recalibrating their expectations for Fed's monetary policy, in light of this week's inflation data that surpassed forecasts. Both CPI and PPI reports for this week have painted a picture of persistent inflationary pressures, prompting speculation of a hawkish shift in FOMC's dot plot at the upcoming meeting next week.
With the inflation narrative gaining momentum, eyes are on University of Michigan's consumer sentiment index and inflation expectations in US session. Any surprises to the upside in these figures could further cement the Dollar's position, propelling it to end the week on a strong note.
In the broader forex markets, the Dollar is currently the best performer of the week, with Canadian Dollar and the trailing behind in strength. New Zealand Dollar is the worst, following the sharp selloff following manufacturing data that, despite showing improvements, continued to highlight the sector's struggles. Sterling and the Yen are also lagging, with Australian Dollar and Swiss Franc mixed in the middle.
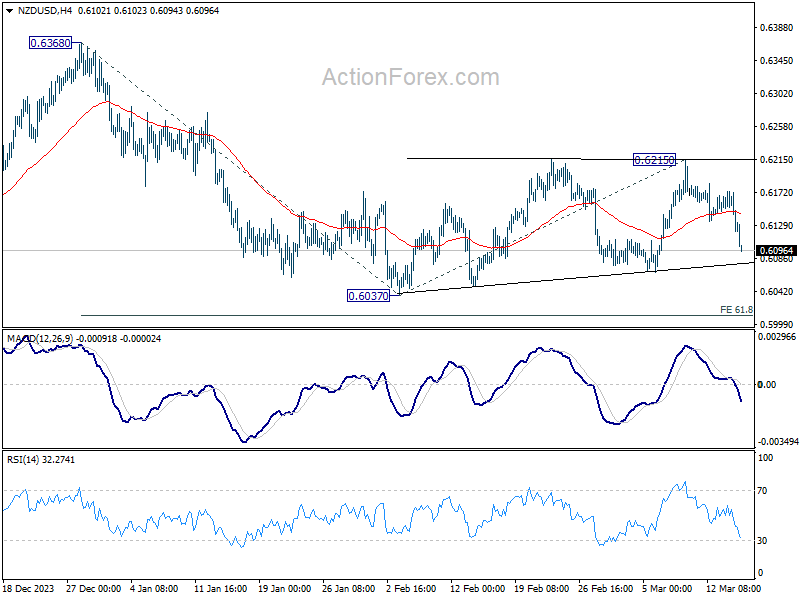
Technically, today's steep decline in NZD/USD affirms the case that consolidation pattern from 0.6037 has completed with three waves to 0.6215. And fall from 0.6368 is ready to resume. Further decline is now expected as long as 55 4H EMA (now at 0.6143) holds. Next targets are 0.6037, and the 61.8% projection of 0.6368 to 0.6037 from 0.6215 at 0.6010, which is close to 0.6 psychological support.
In Asia, at the time of writing, Nikkei is down -0.33%. Hong Kong HSI is down -2.27%. China Shanghai SSE is down -0.31%. Singapore Strait Times is down -0.25%. Japan 10-year JGB yield up 0.0109 at 0.787. Overnight, DOW fell -0.35%. S&P 500 fell -0.29%. NASDAQ fell -0.30%. 10-year yield rose 0.106 to 4.298.
US treasury yields leap as markets question Fed's easing path
US Treasury yields surged overnight and pulled Dollar higher, in reaction to February's stronger than expected PPI data. Despite prevailing expectations for the Fed to initiate rate cuts in June, the persistence of "sticky" inflation has led a reassessment of the loosening path throughout the year.
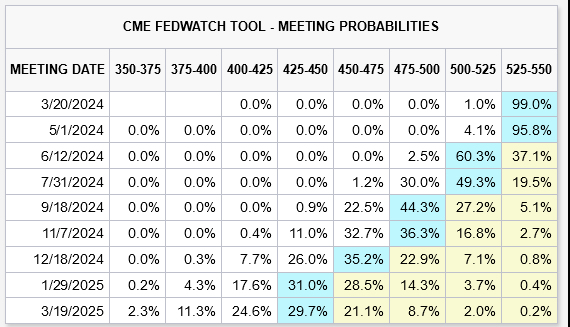
Currently, Fed fund futures reflect diminished confidence, with the likelihood of three rate cuts by year-end, from current 5.25-5.50% down to 4.25-4.50%, falling below 70%. Some market participants appears to be speculating on a less dovish stance in Fed's updated dot plot, set to be unveiled next week.
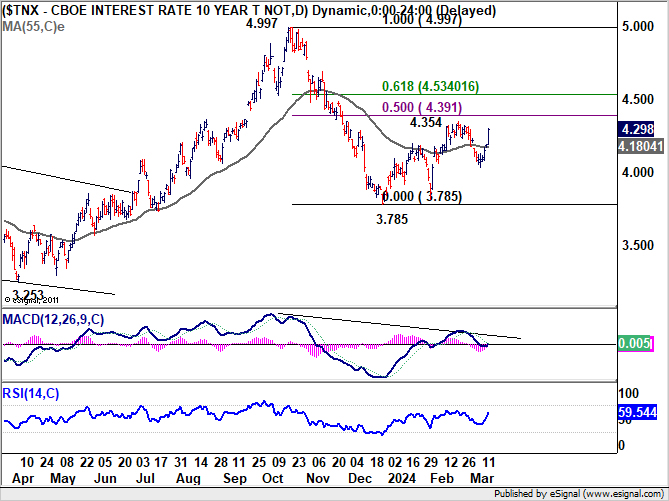
Technically, 10-year yield's strong rise overnight suggests that corrective rebound from 3.785 is still in progress. Break of 4.354 is possible. But for now, strong resistance is expected between 4.391 ad 4.534 (50% and 61.8% retracement of 4.997 to 3.785) to limit upside to complete the rebound.
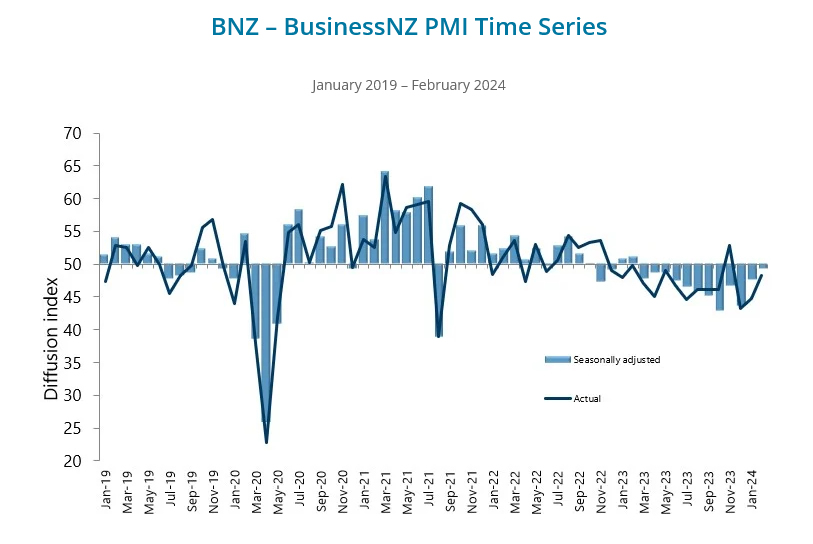
NZ BNZ manufacturing climbs to 49.3, a glimmer of hope in ongoing recession
New Zealand BusinessNZ Performance of Manufacturing Index rose from 47.5 to 49.3 , marking the highest point in a year. However, the sub-50 reading indicates that the sector remains in contraction for the twelfth consecutive month.
A closer examination of the components reveals a mixed bag of progress and setbacks. Production saw a significant leap from 42.9 to 49.1, reaching its peak since January 2023. Contrarily, employment edged down to the breakeven point of 50.0 from 51.3. New orders continued to struggle, remaining unchanged at 47.8 and indicating contraction for the ninth month in a row, reflecting the ongoing difficulty in securing new business. Finished stocks and deliveries both saw improvements, with deliveries crossing into expansion territory at 51.4, the highest since March 2023.
Despite these developments, the sector's sentiment remains cautious, with 62% of comments being negative in February, marginally less pessimistic than January's 63.2% but more so than December's 61%. The primary concerns among respondents were a lack of orders, both domestically and internationally, and a general slowdown in the economy.
Stephen Toplis, BNZ's Head of Research acknowledged that while New Zealand's manufacturing sector "is still in recession", the latest PMI data signals "there is light at the end of the tunnel". The proximity of the PMI to the "breakeven" threshold and the positive differential between new orders and inventory suggest an upcoming increase in production.
Looking ahead
UK consumer inflation and Italy retail sales will be released in European session. Later in the day, Canada will release housing starts and wholesale sales. US will publish Empire State manufacturing, import prices, industrial production, and U of Michigan consumer sentiment.
AUD/USD Daily Report
Daily Pivots: (S1) 0.6557; (P) 0.6594; (R1) 0.6619; More...
AUD/USD's break of 55 4H EMA (now at 0.6585) argues that corrective recovery from 0.6442 has completed with three waves up to 0.6666. Intraday bias is back on the downside for 0.6476 support first. Break there will argue that decline from 0.6870 is ready to resume. On the upside, break of 0.6629 minor resistance will turn bias back to the upside to extend the rebound from 0.6442 instead.
In the bigger picture, price actions from 0.6169 (2022 low) are seen as a medium term corrective pattern to the down trend from 0.8006 (2021 high). Fall from 0.7156 (2023 high) is seen as the second leg, which might still be in progress. Overall, sideway trading could continue in range of 0.6169/7156 for some more time. But as long as 0.7156 holds, an eventual downside breakout would be mildly in favor.
Economic Indicators Update
| GMT | Ccy | Events | Actual | Forecast | Previous | Revised |
|---|---|---|---|---|---|---|
| 21:30 | NZD | Business NZ PMI Feb | 49.3 | 47.3 | 47.5 | |
| 04:30 | JPY | Tertiary Industry Index M/M Jan | 0.30% | 0.10% | 0.70% | |
| 09:30 | GBP | Consumer Inflation Expectations | 3.30% | |||
| 10:00 | EUR | Italy Retail Sales M/M Jan | 0.20% | -0.10% | ||
| 12:15 | CAD | Housing Starts Y/Y Feb | 227K | 224K | ||
| 12:30 | CAD | Wholesale Sales M/M Jan | -0.60% | 0.30% | ||
| 12:30 | USD | NY Empire State Manufacturing Index Mar | -6.5 | -2.4 | ||
| 12:30 | USD | Import Price Index M/M Feb | 0.20% | 0.80% | ||
| 13:15 | USD | Industrial Production M/M Feb | 0.00% | -0.10% | ||
| 14:00 | USD | Michigan Consumer Sentiment Index Mar P | 77.3 | 76.9 |
DAX Short Term Should Stay Supported
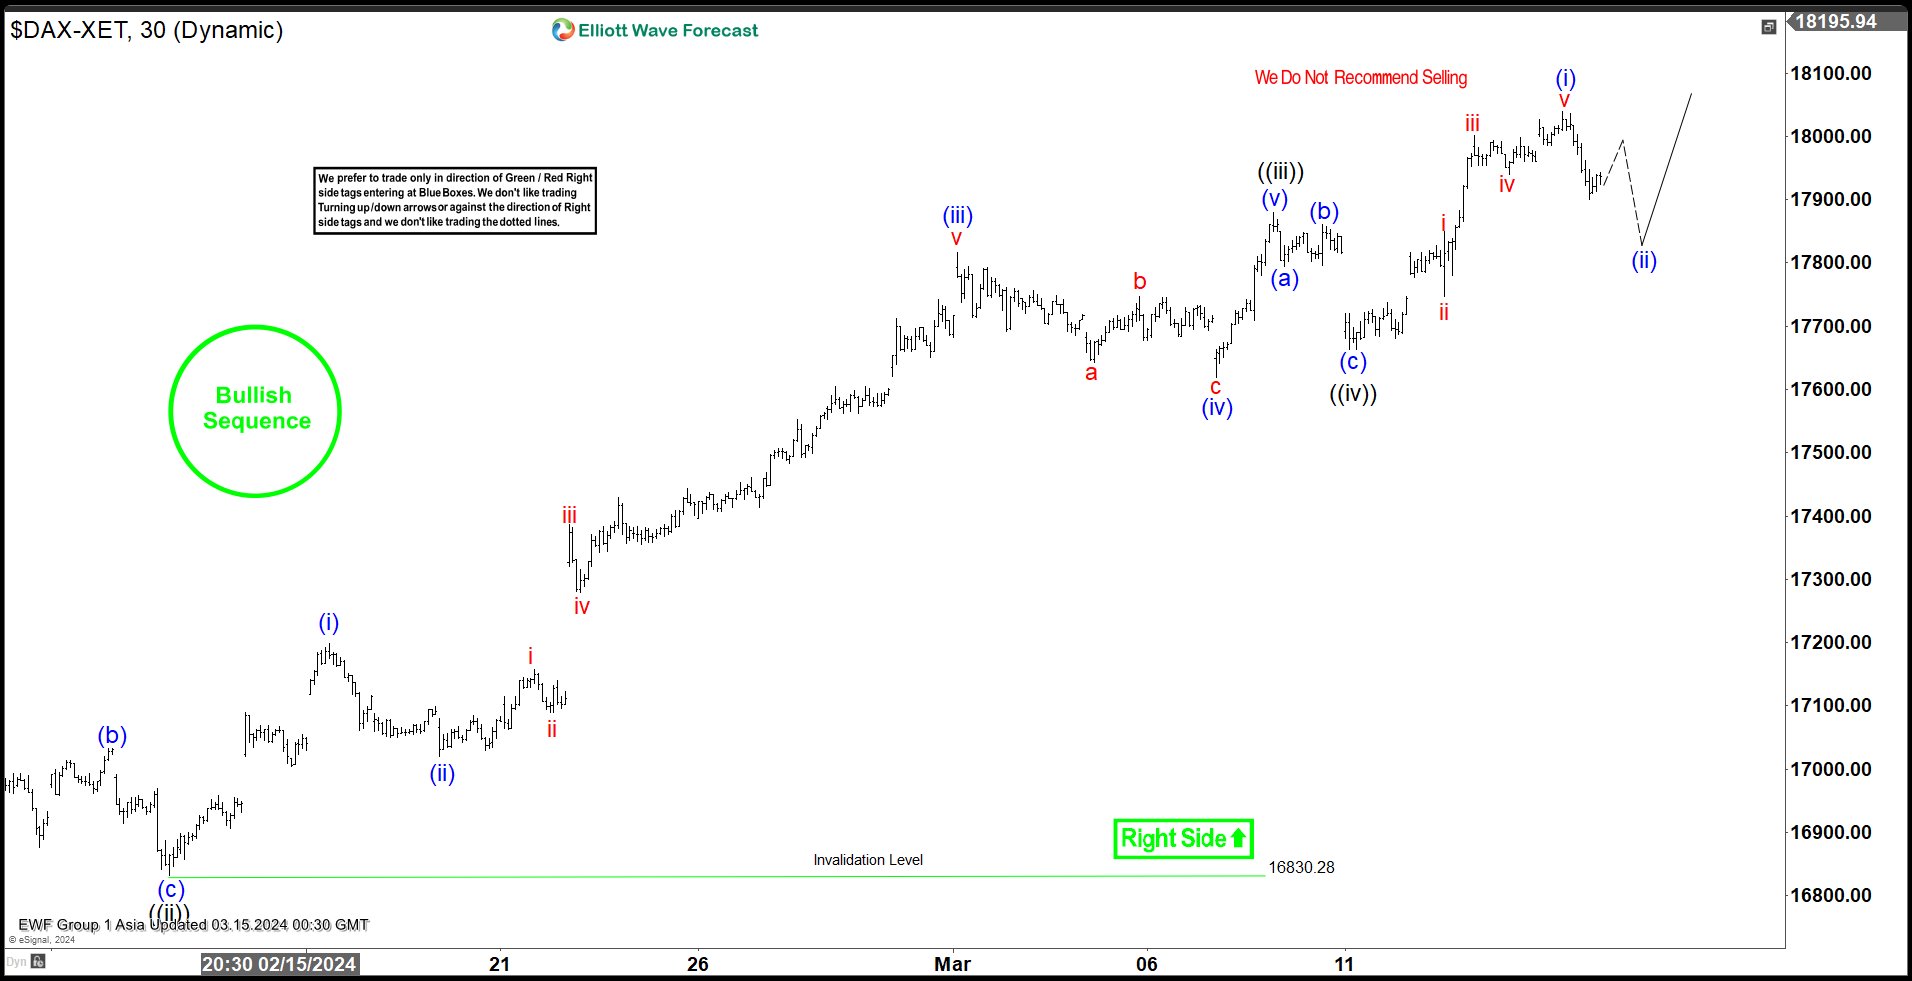
Short Term Elliott Wave view in DAX suggests cycle from 1.17.2024 low is in progress as a 5 waves impulse. Up from 1.17.2024 low, wave ((i)) ended at 17049.52 and pullback in wave ((ii)) ended at 16830.28 as the 30 minutes chart below shows. The Index then rallies higher within in wave ((iii)) with internal subdivision as another impulse in lesser degree. Up from wave ((ii)), wave (i) ended at 17198.45 and pullback in wave (ii) ended at 17019.15. The Index extended higher in wave (iii) towards 17816.52 and pullback in wave (iv) ended at 17619.4. The Index extended higher again in wave (v) towards 17879.11 which completed wave ((iii)) in higher degree.
Pullback in wave ((iv)) subdivided into a zigzag structure. Down from wave ((iii)), wave (a) ended at 17795.13 and wave (b) ended at 17860.51. Wave (c) lower ended at 17662.55 which completed wave ((iv)). The Index has extended higher in wave ((v)) with internal subdivision as 5 waves impulse. Up from wave ((iv)), wave i ended at 17849.8 and wave ii ended at 17746.89. Index extended higher in wave iii towards 18001.42 and wave iv ended at 17939.50. Final leg wave v ended at 18039.05 which completed wave (i). Expect wave (ii) pullback to find support in 3, 7, or 11 swing for further upside, as far as pivot at 16830.28 low stays intact.
DAX 30 Minutes Elliott Wave Chart
DAX Elliott Wave Video
https://www.youtube.com/watch?v=E_tj74X_PXU
USD/JPY Could Recover, Crude Oil Price Breaks $80
Key Highlights
- USD/JPY is attempting a recovery wave from the 146.50 support.
- A key rising channel is forming with support at 147.50 on the 4-hour chart.
- Crude oil prices surged above the $80.00 resistance zone.
- Gold prices are consolidating near the $2,150 zone.
USD/JPY Technical Analysis
The US Dollar declined heavily below the 148.00 zone against the Japanese Yen. USD/JPY found support near 146.50 and recently started a fresh increase.
Looking at the 4-hour chart, the pair is attempting a recovery wave above the 147.00 level. There was a move above the 23.6% Fib retracement level of the downward move from the 150.84 swing high to the 146.47 low.
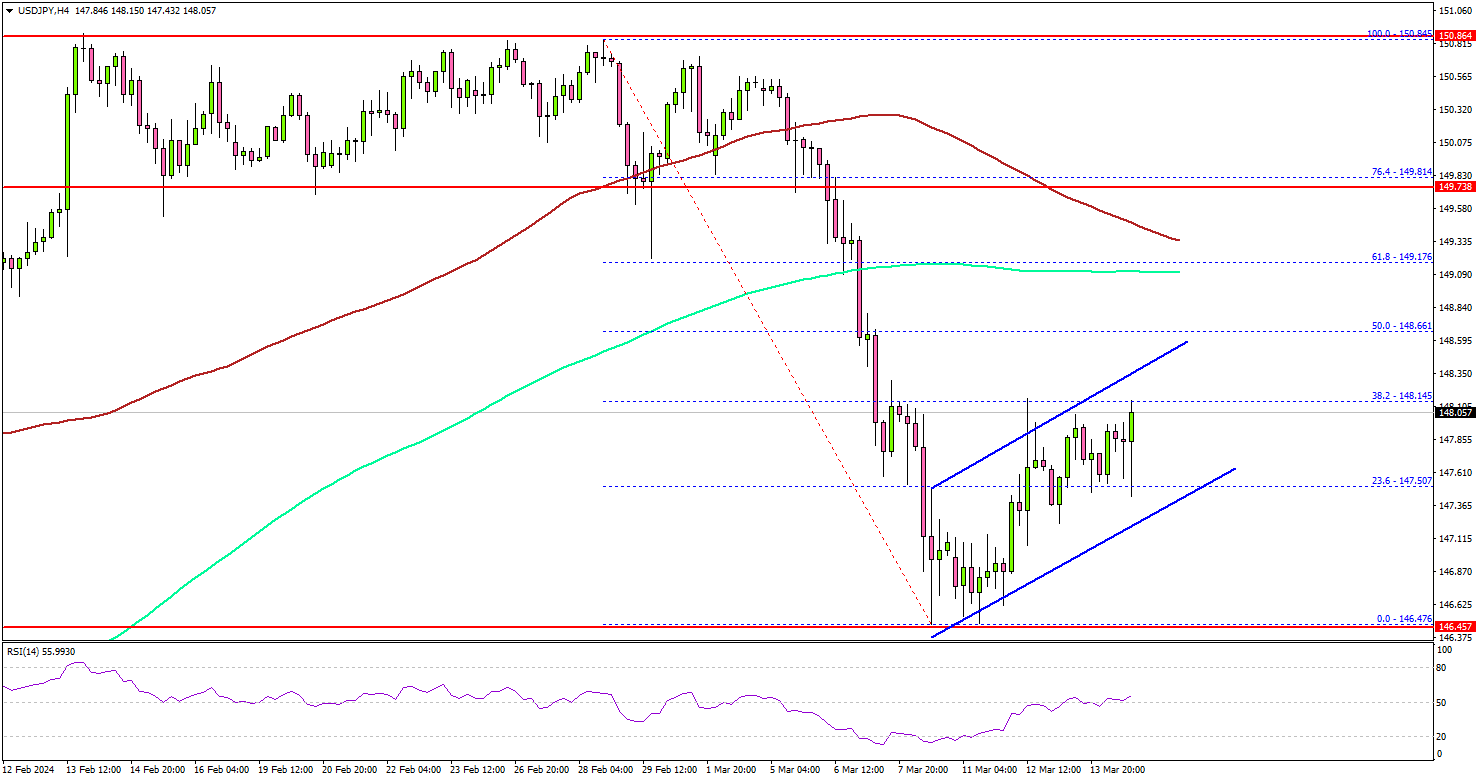
However, the pair is still well below 148.50, the 100 simple moving average (red, 4-hour), and the 200 simple moving average (green, 4-hour). On the upside, the pair could face resistance near the 148.30 level.
The first major resistance is now forming near 148.50. The main resistance is near 149.20. A close above the 149.20 zone could open the doors for more upsides. The next stop for the bulls might be 150.00.
Immediate support is near the 147.50 level. There is also a key rising channel forming with support at 147.50 on the same chart. The next major support is at 147.20. If there is a downside break below the 147.20 support, the pair could decline toward the 146.50 support.
Looking at Oil, there was a strong move above the $80.00 resistance and there are chances of more upsides in the near term.
Economic Releases
- NY Empire State Manufacturing Index for March 2024 – Forecast -7, versus -2.4 previous.
- Michigan Consumer Sentiment Index for Nov 2024 (Prelim) – Forecast 76.9, versus 76.9 previous.
US treasury yields leap as markets question Fed’s easing path
US Treasury yields surged overnight and pulled Dollar higher, in reaction to February's stronger than expected PPI data. Despite prevailing expectations for the Fed to initiate rate cuts in June, the persistence of "sticky" inflation has led a reassessment of the loosening path throughout the year.
Currently, Fed fund futures reflect diminished confidence, with the likelihood of three rate cuts by year-end, from current 5.25-5.50% down to 4.25-4.50%, falling below 70%. Some market participants appears to be speculating on a less dovish stance in Fed's updated dot plot, set to be unveiled next week.
Technically, 10-year yield's strong rise overnight suggests that corrective rebound from 3.785 is still in progress. Break of 4.354 is possible. But for now, strong resistance is expected between 4.391 ad 4.534 (50% and 61.8% retracement of 4.997 to 3.785) to limit upside to complete the rebound.
NZ BNZ manufacturing climbs to 49.3, a glimmer of hope in ongoing recession
New Zealand BusinessNZ Performance of Manufacturing Index rose from 47.5 to 49.3 , marking the highest point in a year. However, the sub-50 reading indicates that the sector remains in contraction for the twelfth consecutive month.
A closer examination of the components reveals a mixed bag of progress and setbacks. Production saw a significant leap from 42.9 to 49.1, reaching its peak since January 2023. Contrarily, employment edged down to the breakeven point of 50.0 from 51.3. New orders continued to struggle, remaining unchanged at 47.8 and indicating contraction for the ninth month in a row, reflecting the ongoing difficulty in securing new business. Finished stocks and deliveries both saw improvements, with deliveries crossing into expansion territory at 51.4, the highest since March 2023.
Despite these developments, the sector's sentiment remains cautious, with 62% of comments being negative in February, marginally less pessimistic than January's 63.2% but more so than December's 61%. The primary concerns among respondents were a lack of orders, both domestically and internationally, and a general slowdown in the economy.
Stephen Toplis, BNZ's Head of Research acknowledged that while New Zealand's manufacturing sector "is still in recession", the latest PMI data signals "there is light at the end of the tunnel". The proximity of the PMI to the "breakeven" threshold and the positive differential between new orders and inventory suggest an upcoming increase in production.
Fed Decision: Will the New ‘Dot Plot’ Boost Dollar?
- Fed will announce its latest decision at 18:00 GMT Wednesday
- Almost certain to keep rates steady, so focus will fall on ‘dot plot’
- Signals of fewer rate cuts this year could help the dollar recover
Solid economy pushes back Fed cuts
The US economy continues to defy expectations. Economic growth is on track to hit 2.5% this quarter, juiced by enormous government spending and solid consumer demand.
Labor markets have shown some early signs of loosening lately, but remain tight by historical standards. While the unemployment rate has risen a little, it is still below 4%, and there are no signs of widespread layoffs. Corporate America isn’t hiring so much anymore, but it isn’t firing workers either.
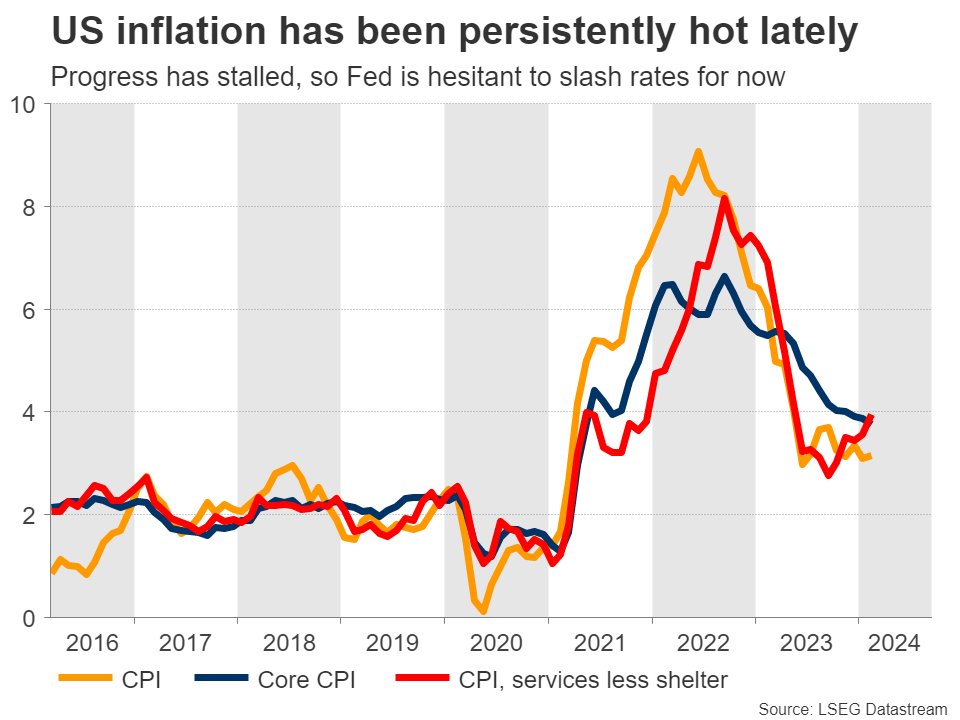
Reflecting this economic resilience, inflation has been persistently hot in recent months. While price pressures have cooled substantially over the past year, the progress has slowed down, with inflation being stickier than investors had hoped. It increasingly seems that the ‘last mile’ in bringing inflation down to its 2% target will be the most difficult part.
As such, investors have unwound bets of heavy Fed rate cuts. The market is currently pricing in just three rate cuts for this year, down from six a few months ago.
All eyes on the dots
Fed officials are almost certain to keep interest rates unchanged on Wednesday. As such, the market reaction will depend mostly on the updated economic forecasts, the new rate projections in the famous ‘dot plot’, and what Chairman Powell says during his press conference.
Back in December, the Fed signaled three quarter-point rate cuts for this year. Yet, considering that inflation has been hotter than anticipated lately, the risk is that the new ‘dot plot’ points to fewer cuts this year, perhaps just two.
Such an outcome would likely be positive for the dollar, and negative for rate-sensitive assets like gold. That said, any such reaction is unlikely to be huge. Investors know that it’s only a matter of time until rates come down, even if the timeline is pushed back a little.
Taking a look at the dollar/yen chart, a spike higher could propel the market above the 50-day simple moving average (SMA) currently at 148.33, turning the focus towards the 148.70 zone. If buyers slice above it, the next resistance barrier might be the 149.70 region.
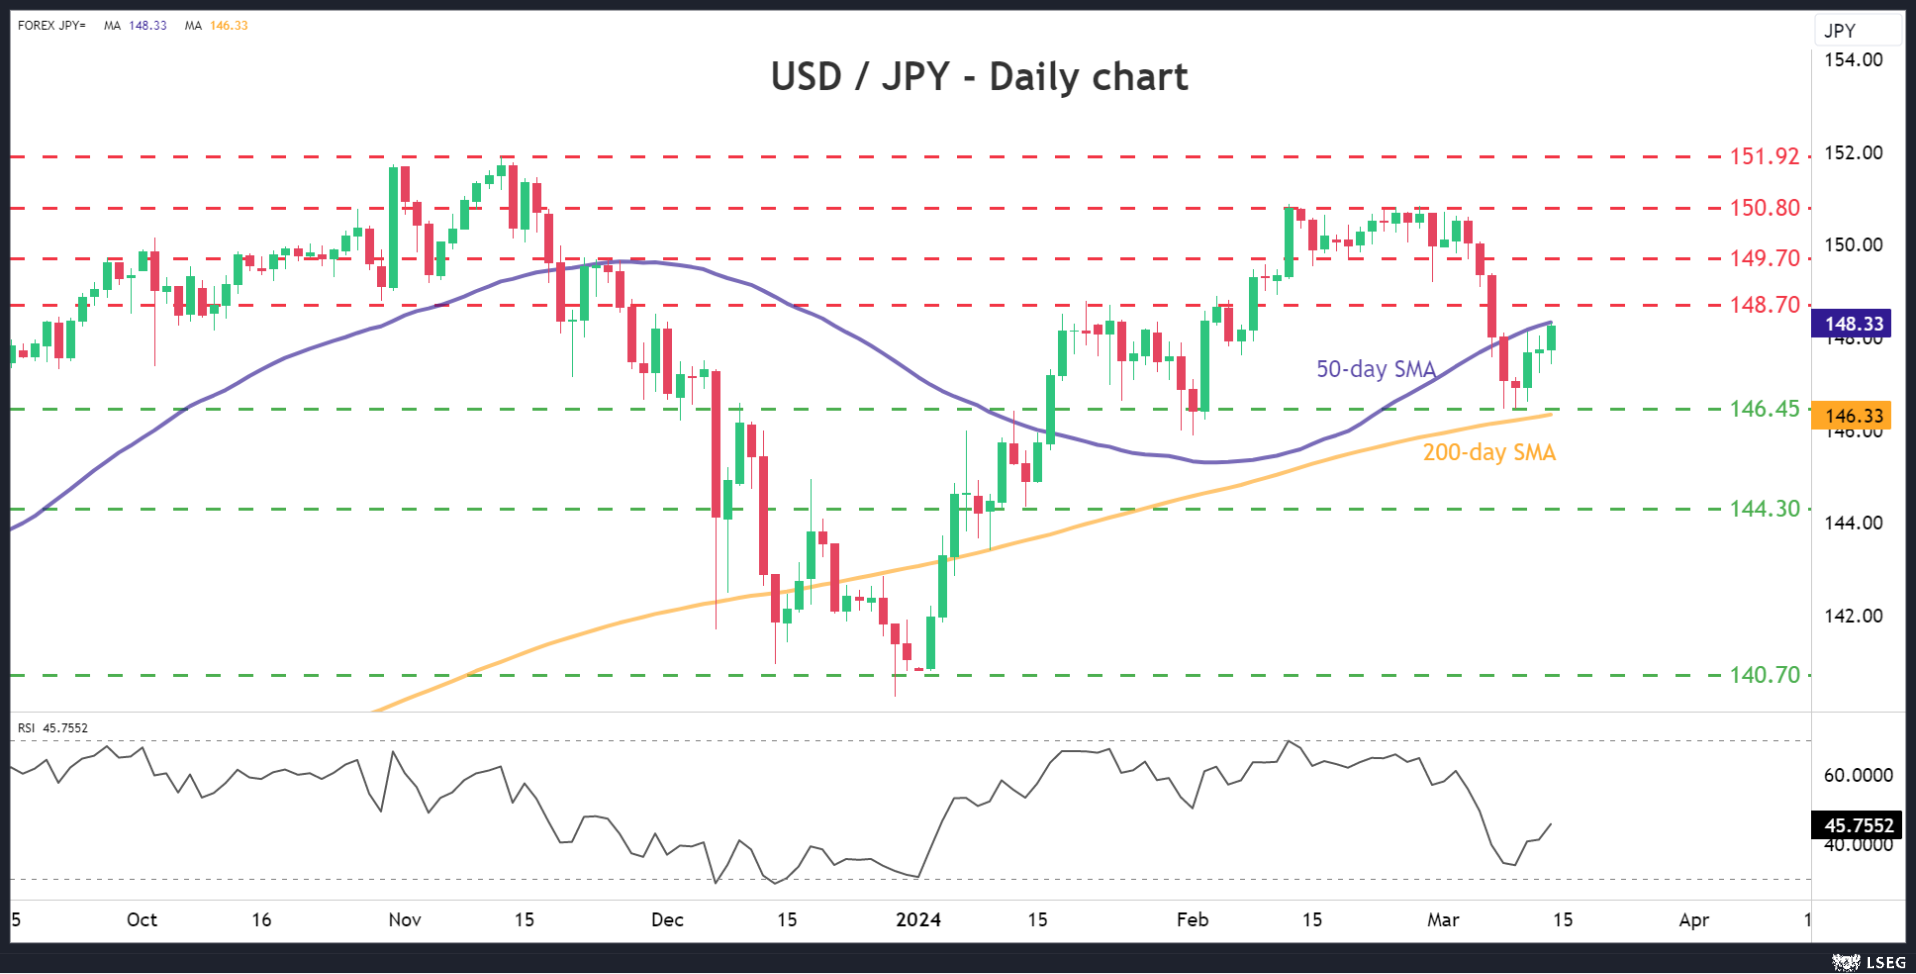
On the flipside, a Fed that keeps the dots unchanged to signal three rate cuts this year could bring ‘relief’ to investors and spark the opposite market reactions. In this case, dollar/yen could drop towards the 146.45 support area, which roughly encapsulates the 200-day SMA as well.
Note that dollar/yen will also be impacted by the Bank of Japan rate decision, which is due early on Tuesday.
What does the dollar need to rally?
All told, the dollar is the second-best performing major currency this year, slightly behind the British pound. That said, the dollar’s gains have not been very impressive, which is strange since the US economy is stronger than most of its competitors, especially in terms of growth.
One element behind the dollar’s inability to truly capitalize on its strong economic fundamentals has been the sanguine tone in stock markets, which has curbed demand for safe haven assets like the dollar.
Therefore, for the dollar to stage a sustainable rally, it might require a correction in high-flying stock markets. If that happens to coincide with a worsening economic outlook in the rest of the world, it would be the dream scenario for the reserve currency.
Looking Beyond the Horizon
The macro outlook is unchanged from our view of recent months. Two years of slow growth could result in economic slack, with inflation ultimately undershooting the RBA’s target. What forces could emerge to offset this?
This week we released fresh forecasts in our Market Outlook publication. The national accounts came in broadly as we expected, and the narrative is unchanged. We continue to expect slow growth in the first half of 2024, with some improvement in the second half of the year. The tax cuts coming from July will help reverse the squeeze on household incomes. Lower inflation will also help restore households’ purchasing power.
The impending tax cuts can be seen as largely restorative and a necessary rebalancing. The share of household income going to income tax payments was exceptionally high in the second half of 2023. Without the give-back inherent in these tax cuts, that tax take would continue to increase and the drag on growth in household disposable income would continue.
Likewise, the cuts in interest rates that we expect later in the year could be regarded as restorative. Monetary policy is currently restrictive. If a restrictive stance of policy is maintained for long enough, inflation continues to decline and ultimately exits the target range on the low side. Some normalisation of policy will therefore need to happen at some point.
Even with these pivots in policy, if our forecasts or something like them turn out to be true, Australia will have had two consecutive years of output growth around 1½% – the 1.5% result over 2023 and (we expect) 1.6% over 2024. This is well below trend. It is also well below the population growth recorded over 2023 and still a little below our expectations for population growth in 2024. Unemployment will be rising, wages growth slowing, and the economic experience of households more broadly will still be uncomfortable.
According to Westpac Economics’ forecasts, Australia will end this year with the unemployment rate at 4½%. As the RBA has emphasised recently, there is more to achieving full employment than just the unemployment rate. The sustainable rate of labour market slack – including unemployment – that keeps growth in labour costs stable and consistent with inflation at target, is not directly observable. But as best as anyone can tell, a 4½% unemployment rate is likely to be a little above this sustainable level. Some evidence for this assessment can be seen in the tipping over in growth in the leading edge of wage determination, individual agreements, already evident with an unemployment rate around 4%. If this assessment is correct, at least some parts of the domestic economy will be exerting downward pressure on inflation over the period ahead, and especially from 2025.
Looking beyond 2025, then, there is a risk that – without at least a period of above-trend growth and falling unemployment – domestic inflation continues to fall. The gap between actual unemployment (implied in our forecasts) and the full-employment level of labour market slack will be small, however, and hard to detect in the data. If it is indeed a gap, though, there will be a tendency for inflation to undershoot the RBA’s target beyond 2025.
When we look beyond 2025, the question therefore arises: what forces would bring about a period of above-trend growth to eliminate emerging economic slack and allow inflation to stabilise?
One obvious possibility would be that the RBA ends up reducing the cash rate to a level that is mildly stimulatory, rather than converging to a more neutral stance as is often assumed. This might not be a conscious strategy. Rather, the RBA might end up there simply because neither they nor anyone else knows exactly where the ‘neutral’ cash rate is. In feeling their way to neutral in the face of fiscal headwinds and labour market slack, they might end up a little below where neutral actually is.
In this context, one can interpret the Westpac Economics forecast for the cash rate at the end of 2025 of 3.1% as either neutral, with a neutral real rate a bit below 1%, or slightly below neutral with a higher neutral real rate. Given the uncertainties around both the outlook and the level of the neutral rate in any one period, we are agnostic about which interpretation turns out to be the right one. It might be that one will never be able to tell the difference.
Another alternative way for a period of above-trend growth to occur is that business investment might pick up. Our forecasts for business investment growth over 2024 and 2025 are running ahead of GDP growth for the same periods, but not enough to drive a period of above-trend output growth overall.
One scenario that would spur a further pick-up in this space would be a concerted response to the climate challenge, perhaps starting in 2026. The considerable required investment in renewable energy generation and transmission would be a large part of this. Other areas that could be involved would be the electrification of the commercial vehicle fleet and rail network, and development of biofuel alternatives for the legacy stock of internal combustion engine vehicles. The energy efficiency of buildings and building materials are another aspect of the transition, especially considering the elevated rate of non-residential building and infrastructure work underway.
The rest of the world will also be highly engaged in energy transition and climate mitigation. It is therefore possible that global investment is elevated in the period ahead, relative to the years between the Global Financial Crisis and the pandemic. This has implications for the likely structure of interest rates globally in coming years. Recall that the so-called ‘neutral’ risk-free interest rate is simply the rate that balances global saving and global investment. It is an outcome of the system, not something imposed as an external force. If desired global investment picks up relative to the pre-pandemic period, for climate or other reasons, that would tend to lift the rate that produces that equilibrium.
The deeper question is whether bond markets, and fiscal authorities, have planned for that possibility.
Cliff Notes: Fading Inflation Risks
Key insights from the week that was.
In Australia, market participants were left with little to dissect this week. The latest NAB business survey pointed to the domestic economy remaining weak in late February, the detail of the survey broadly consistent with last week’s Q4 2023 National Accounts. Although business conditions rose to +10 in February, on a multi-month view the index continues to trend lower, consistent with modest but persistent declines in forward orders over the past ten months. Against this backdrop, businesses are circumspect on the outlook, with confidence fragile for much of the past year. More positively, the deceleration in upstream price pressures is ongoing, final product prices tracking a modest 1.2% rise for the March quarter.
Next week, the RBA Board will meet to discuss recent economic data, including the Q4 National Accounts and Wage Price Index, to decide whether it warrants a shift in policy. Our view is that the RBA will be comforted by recent developments, given the Board’s aim to bring demand back into line with supply and ensure inflation continues to trend toward and then into the target range. We continue to expect the RBA to remain on hold until September at which time they should have enough confidence in the inflation outlook to slowly begin easing policy.
In this week’s essay, Chief Economist Luci Ellis looks beyond the end of our current forecast horizon to consider some of the factors that will determine growth and inflation from 2026. Critical will be the stance of monetary policy and the degree of labour market slack. Also important to the state of the economy is work related to the green transition.
Over in the US, February’s CPI came in a touch firmer than expected at 3.2%yr. The shelter component once again drove the increase, however. Excluding shelter, on both a 6-month annualised and annual basis, inflation is consistent with the FOMC's 2% inflation target. Clear from the detail of the report is that demand-side inflation has successfully been reigned in, leaving only supply-side pressures which monetary policy has little-to-no impact on, at least in the near term. For housing in particular, it is investment that is needed to ease price pressures; this is unlikely while interest rates are contractionary and the outlook for the labour market uncertain.
Retail sales again signalled that consumer demand is waning, February’s 0.6% gain below expectations and only a partial offset to January's downwardly revised 1.1% decline. The control group, which excludes volatile items like fuel, was flat, also below expectations. While inflation has essentially come back to target, the cumulative change in the cost of living since the beginning of the pandemic is substantial and unlikely to be made up by real income gains in the near term. Consumption growth is likely to be materially weaker in 2024 and 2025 than was the case in 2023. Our latest edition of Market Outlook provides key forecasts for Australia, the US and the world.
Finally to Japan, where Q4’s initial 0.1% contraction (the second in a row, signalling recession) was revised away on stronger business investment. In the revised figures, capital expenditure rose 2% in Q4 compared to the 0.1% decline initially reported. This put Q4 GDP growth at 0.1%qtr after a 0.8%qtr decline in Q3. Still, household consumption remains weak having declined over the last three quarters, a time when consumers benefitted from historically high wage growth. It is hard to see evidence of a virtuous cycle of wages, consumption and inflation beginning. As such, the Bank of Japan will want to remain patient with policy, waiting to see how inflation and wage outcomes develop beyond this year's wage decisions before moving their policy rates materially above zero.