Sample Category Title
Focus on Swedish inflation and US Retail Sales
In focus today
In the US, February retail sales and PPI are due for release today. Consensus expects a rebound in retail sales after the unusually weak January print, which might have been distorted by heavy seasonal adjustments at the start of the year. Markets will also follow if the sticky price pressures seen in the CPI earlier this week will be reflected in the PPI as well.
In Sweden, we get the inflation numbers for February. We forecast CPIF at 2.4% y/y and CPIF excl. energy at 3.5% y/y. The fall in core inflation can mainly be attributed to clothing, food, rent and hotel/restaurant prices (in that order of magnitude). However, uncertainty remains high not least because the impact of rent increases is difficult to predict and after a lower-than-expected increase in January, the risk remains to the upside. From the Riksbank, Anna Breman will be participating at a conference on the topic of sustainable finance and the Riksbank will publish a fresh payment report.
In Norway, the regional network survey is scheduled for release. The survey pointed to a drop in activity in Q1. Signs that the rate peak has been reached seem to have improved the sentiment among both corporates and households, and hence we expect that growth prospects will return to positive ground, albeit it should be noted that this does not mean that growth will pick up sharply into the summer, but just stop falling further.
Overnight, Japan's biggest labour union federation, Rengo, releases the first tally of pay deals. This will be the first indication whether wage growth will be strong enough this year to support a sustainable inflation pressure. The results of the spring wage negotiations will be absolutely key to the Bank of Japan's decision whether to start tightening policies.
In China, we also get overnight data. The PBOC releases the 1-year Medium-term Lending Facility (MLF) rate, but it is expected to be unchanged as PBOC likely awaits clearer signals of Fed easing. The 5-year MLF rate, which is a mortgage rate benchmark, was surprisingly cut by 25bp last month and is unlikely to be cut again already. However, PBOC has clearly signalled over the past week that the direction for rates is down and that they have more leeway when other central banks start easing as well. Moreover, Chinese house prices for February will also be released. The print can be seen as an important bellwether for a turn-around in the Chinese housing market. Last month data surprised to the upside, bringing some rays of light.
Economic and market news
What happened yesterday
In the US, the House of Representatives has passed a bill demanding ByteDance, the Chinese owner of TikTok, to divest its U.S. assets within six months or risk a ban. However, the bill's future in the Senate is still uncertain, as discussions persist. The bill marks the most recent step in a series of measures taken in Washington to address national security concerns regarding China.
In the euro area, industrial production declined more than expected in January amid December production being revised down, printing -3.2% m/m (cons: -1.8%) and -6.7% y/y (cons: -3.0%). Hence, the euro area industry starts the year on a weak footing and will likely not contribute to growth before the Q2 or Q3 of 2024. Note, that the decline was driven especially by the very volatile Irish industrial production that dropped 34% m/m due to a base effect from, most likely, a large patent in December.
Also, the ECB announced changes to its operational framework for implementing monetary policy. The key takeaways include the fact that the governing council will continue to steer the monetary policy stance through the deposit facility rate (DFR). The minimum reserve requirements remain unchanged at 1%, and the remuneration of minimum reserves will likewise stay unchanged at 0%.
Additionally, the main refinancing operations (MRO) rate will be adjusted so that the spread between the MROs and the DFR will be reduced to 15bp from the current spread of 50bp. Moreover, the rate on the marginal lending facility (MLF) will also be adjusted, maintaining the spread between the MLF rate and the rate in the MROs at 25bp. These changes will commence with the sixth maintenance period of 2024, beginning on September 18, 2024.
In the UK, January GDP data was fully in line with consensus, coming in at 0.2% m/m, -0.3% y/y and -0.1% 3M/3M. The market reaction was muted.
In geopolitics, US and Iranian officials reported that in January, the US engaged in secret talks with Iran in an effort to convince Tehran to leverage its influence over the Houthis to cease attacks on ships in the Red Sea. Oman facilitated the talks, with Omani officials shuttling between representatives from both nations. Additionally, U.S. Secretary of State Antony Blinken portended that the US is working towards setting up a maritime aid corridor into Gaza.
Equities: Global equities were marginally lower yesterday despite most sectors ending higher. However, with tech and healthcare lower a huge share of the index was dragging down. Europe outperformed the US and once again cross regional sector performance was very different. One can easily be caught wrong footed when looking at volatility, and especially the volatility in AI-related stocks. Hence, we recommend not to focus too much on the day-to-day change in sentiment but rather use the signs from the macro side which in our opinion hold the clues for the medium-term outlook. In US yesterday, Dow +0.1%, S&P 500 -0.2%, Nasdaq -0.5% and Russell 2000 +0.3%. Asian markets are mostly higher this morning together with European and US futures.
FI: European yields rose across the board yesterday albeit with limited news to trade on. The 10y German yield ended up 3bp on the day. The general tightening trend of for example the German ASW swap spread and the BTPs-Bund spread continued, with the ASW-spread crossing 30bp.
FX: A relatively quiet day with the recent USD respite proving short-lived as EUR/USD climbed somewhat. Not much action in Scandies as both SEK and NOK trades mostly sideways. EUR/GBP continued to climb steadily higher, whereas EUR/PLN remains below 4.30.
Crude Oil Prices Rise as Ukraine Hits Russian Refineries
Direction was mixed yesterday, as Tuesday’s hotter-than-expected US CPI print gave cold feet to investors regarding the Federal Reserve’s (Fed) ability to cut interest rates as soon as in June. The S&P 500 and Nasdaq consolidated near record, energy stocks helped tempering losses in the S&P500 as technology stocks traded down. The dollar index rebounded as the selloff in Treasuries accelerated despite a strong 30-year bond auction.
Today, focus is on the US retail sales and producer price inflation data. Retail sales are expected to have rebounded following a relatively weak read in January, while producer prices are expected to have risen in February, fueled by higher energy prices. Normally, I would expect higher-than-expected retail sales and higher-than-expected PPI data to temper the Fed rate cut bets, back a further rise in US yields and the dollar, and trigger a downside correction in the US stock markets.
Speaking of oil prices, the positive pressure is building after the EIA data confirmed a 1.5 mio barrel fall in US oil inventories last week, and after Ukraine attacked major Russian oil refineries with drones and damaged around 12% of the country’s oil-processing capacity. The barrel of US crude tested the $80pb level. Offers near $80pb could be cleared on the back of rising tensions, yet I doubt that we will see a sustainable rise in oil prices above this level when the geopolitical jitters disappear from the headlines. There is still a strong resistance within the $80/82pb range.
Elsewhere, tensions between the US and China are on the rise again, as US House passed a bill to ban Tiktok unless the Chinese ByteDance sells the platform to a third party that would comply with the US data security demands. The bill is on its way to the White House. The US accuses China to use the user data and build propaganda using the platform. The affair is highly political of course, and it is one more major point that opposes the two presidential candidates, Biden and Trump. Biden says he will sign the bill, while Trump says banning TikTok would give too much power to Facebook, that he openly dislikes – as the platform imposed a ban on the ex-President after the Capitol riot back in 2021. Meta didn’t react much to the news.
Meanwhile
European stocks extended gains and hit fresh record as energy and luxury names led the rally higher yesterday. The EURUSD consolidates gains below the 1.10 level and should see a solid resistance into this level, especially if we see another hot inflation report from the US today. European Central Bank’s (ECB) Wunsch said yesterday that the bank may eventually start lowering the interest rates without being sure that inflation is returning to the 2% target, and that the latter decision could come ‘before so long’. Listening to Lagarde and other ECB members, it sounds like a June cut is a done deal, unless a significant surprise occurs on the inflation front. But a lot can change from now to June. If tensions between Ukraine and Russia escalate in a way to boost oil prices, we will certainly see the central banks constrained to delay their rate cut plans. For now, however, the expectation is that the ECB will start cutting in June and cut 4 times this year. The bank also announced changes to its operational framework in a way to allow the banks in different locations to ask for liquidity that they need, so that the monetary policy could be more flexible to better meet the various needs of various economies across the bloc as excess liquidity dries out. The market reaction to the latter changes is expected to be limited.
USD/CAD Daily Outlook
Daily Pivots: (S1) 1.3453; (P) 1.3476; (R1) 1.3494; More...
No change in USD/CAD's outlook and intraday bias stays neutral. On the downside, break of 1.3419 and sustained trading below 1.3439 support will argue that rebound from 1.3176 has completed as a corrective move to 1.3605. Near term outlook will be turned bearish for 1.3357 support first. On the upside, though, break of 1.3524 minor resistance will revive near term bullishness, and turn bias back to the upside for retesting 1.3605 resistance instead.
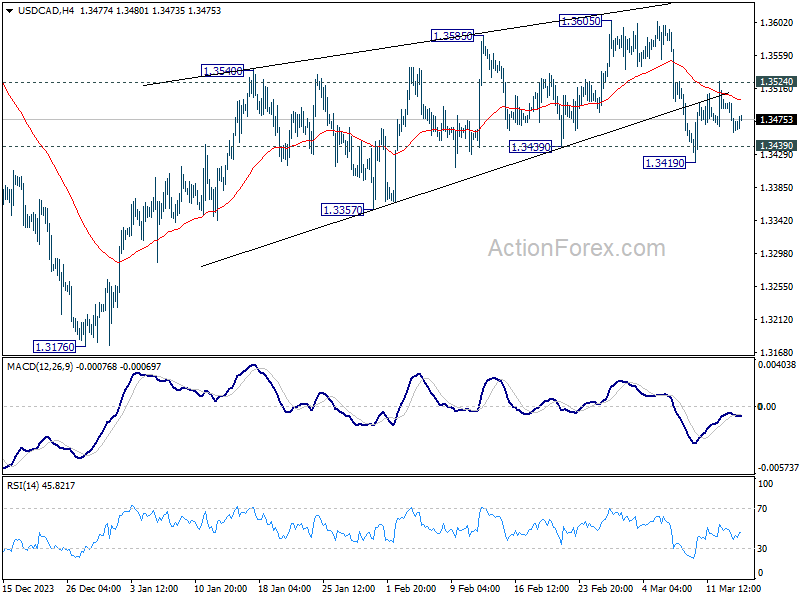
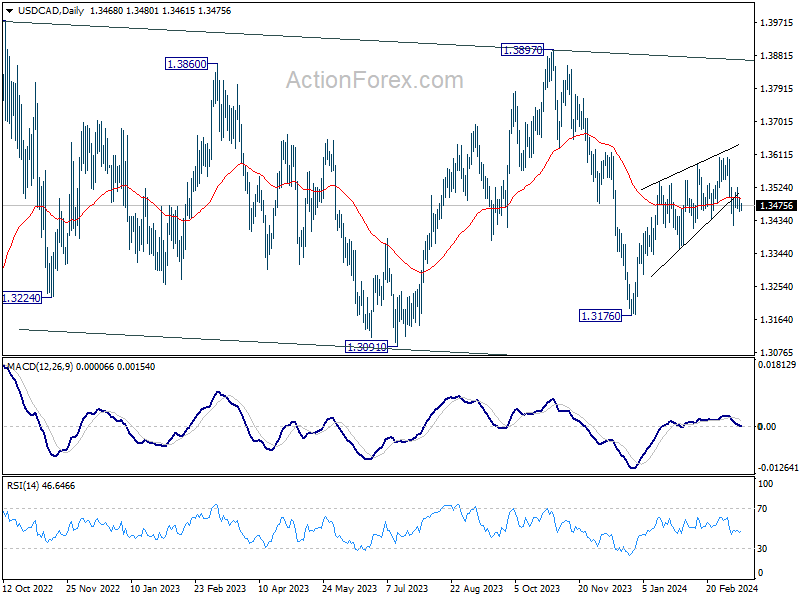
In the bigger picture, price actions from 1.3976 (2022 high) are viewed as a corrective pattern only. In case of another fall, strong support should emerge above 1.2947 resistance turned support to bring rebound. Overall, larger up trend from 1.2005 (2021 low) is still expected to resume through 1.3976 at a later stage.
AUD/USD Daily Report
Daily Pivots: (S1) 0.6603; (P) 0.6619; (R1) 0.6638; More...
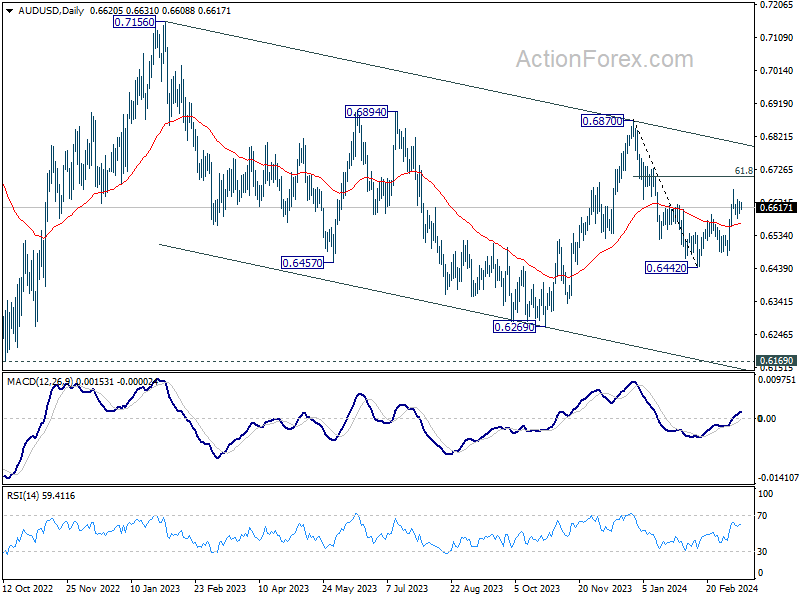
Intraday bias in AUD/USD remains neutral and outlook is unchanged. Another rise will be mildly in favor as long as 55 4H EMA (now at 0.6586) holds. Above 0.6666 will resume the rebound from 0.6442 to 61.8% retracement of 0.6877 to 0.6442 at 0.6707 next. Sustained trading above there will argue rise from 0.6442 is probably resuming whole rally from 0.6269. Nevertheless, sustained break of 55 4H EMA will revive near term bearishness and bring retest of 0.6442 low instead.
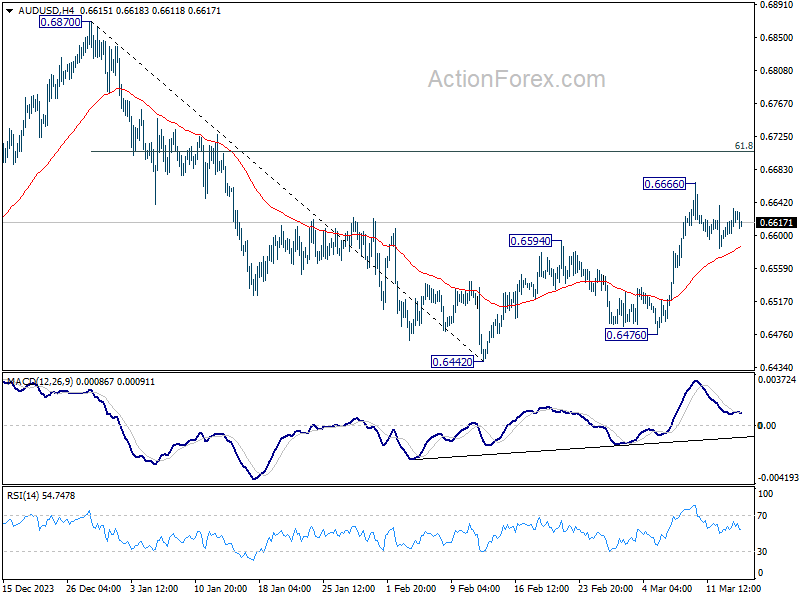
In the bigger picture, price actions from 0.6169 (2022 low) are seen as a medium term corrective pattern to the down trend from 0.8006 (2021 high). Fall from 0.7156 (2023 high) is seen as the second leg, which might still be in progress. Overall, sideway trading could continue in range of 0.6169/7156 for some more time. But as long as 0.7156 holds, an eventual downside breakout would be mildly in favor.
USD/JPY Daily Outlook
Daily Pivots: (S1) 147.31; (P) 147.68; (R1) 148.12; More...
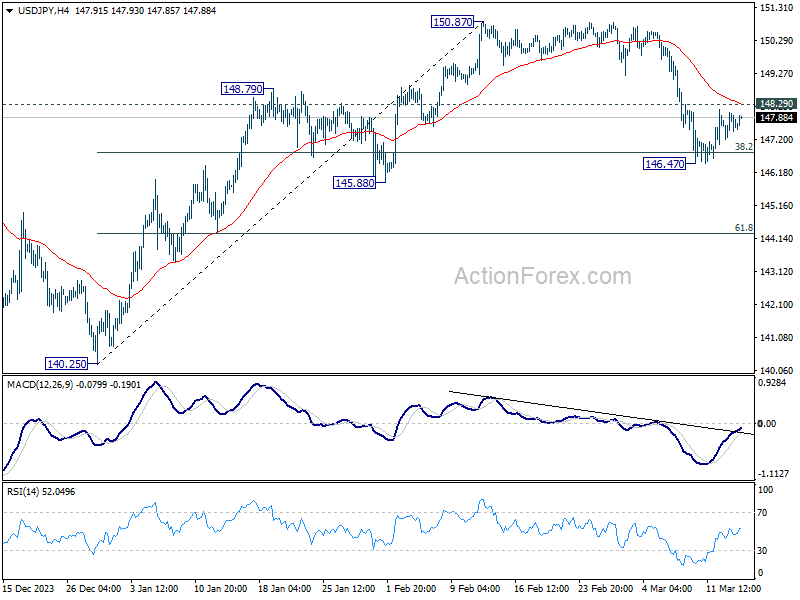
Intraday bias in USD/JPY remains neutral for the moment. On the downside, sustained break of 38.2% retracement of 140.25 to 150.87 at 146.81 will argue that fall from 150.87 is reversing the whole rally from 140.25. In this case, deeper decline would be seen to 61.8% retracement at 144.30 and below. Nevertheless, strong support from 146.81, followed by break of 148.29 minor resistance resistance, will argue that fall from 150.87 is merely a correction, which has completed already. Retest of 150.87 should be seen next.
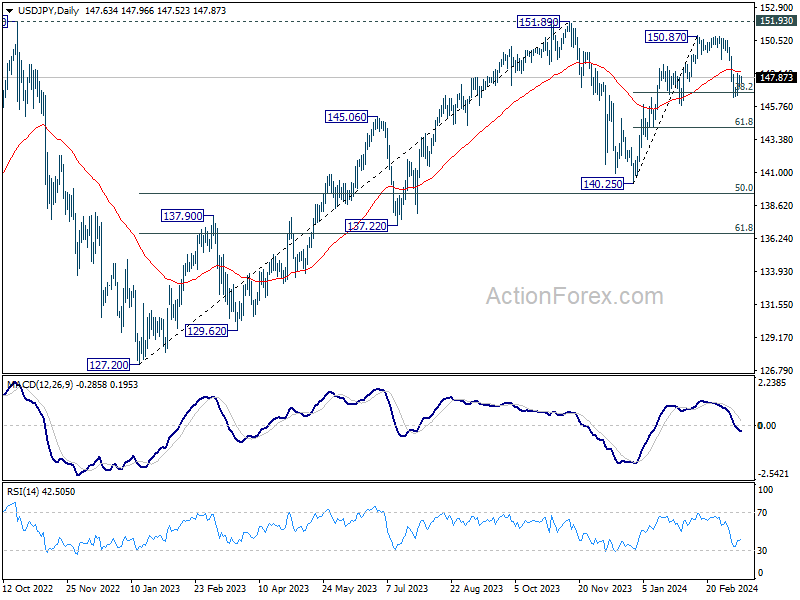
In the bigger picture, no change in the view that price action from 151.89 (2023 high) are correction to up trend from 127.20 (2023 low). The question is whether this correction has completed at 140.25, or extending with fall from 150.87 as the third leg. Sustained break of above mentioned 146.81 fibonacci level will favor the latter case. But even so, downside should be contained by 50% retracement of 127.20 to 151.89 at 139.54.
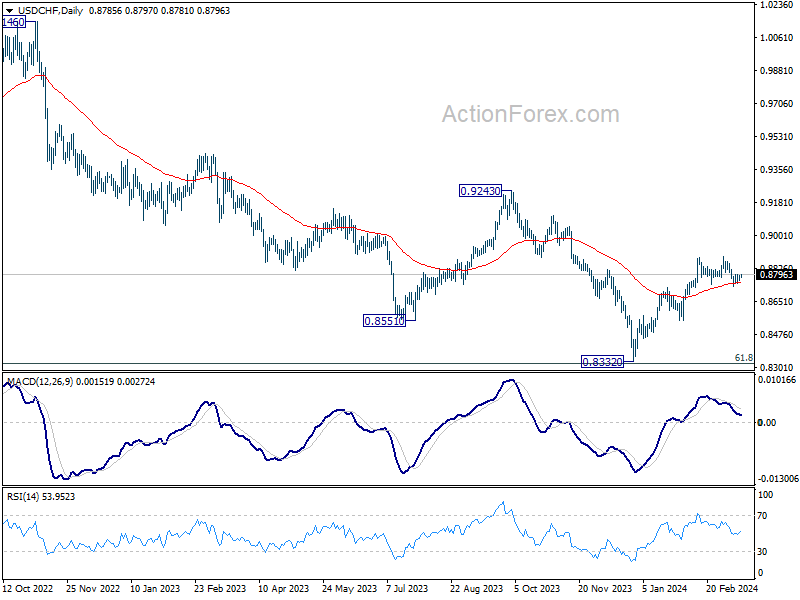
USD/CHF Daily Outlook
Daily Pivots: (S1) 0.8773; (P) 0.8782; (R1) 0.8799; More....
No change in USD/CHF's outlook and intraday bias stays neutral. On the downside, sustained break of 0.8741 will argue that the whole rebound from 0.8332 might have completed, and bring deeper fall to 0.8550 support. Nevertheless, strong bounce from current level will retain near term bullishness. Further break of 0.8891 will resume the rise from 0.8332.
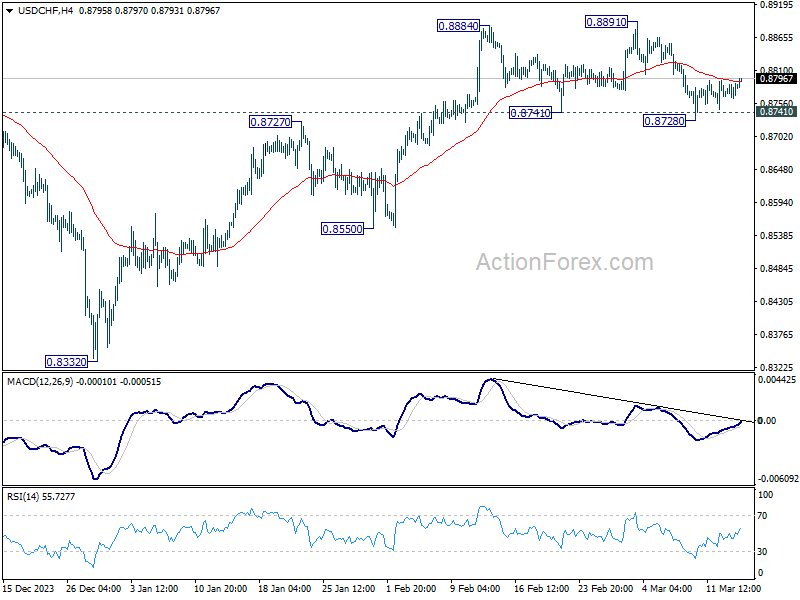
In the bigger picture, price actions from 0.8332 medium term bottom as seen as developing into a corrective pattern to the down trend from 1.0146 (2022 high). Further rise would be seen as long as 0.8555 support holds. But upside should be limited by 0.9243 resistance, at least on first attempt.
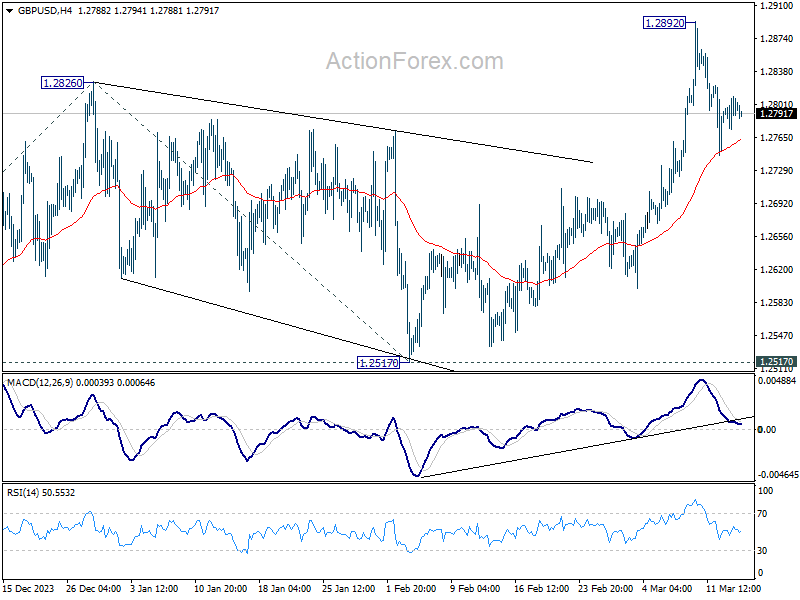
GBP/USD Daily Outlook
Daily Pivots: (S1) 1.2778; (P) 1.2794; (R1) 1.2814; More...
Intraday bias in GBP/USD remains neutral at this point. Further rally will remain in favor as long as 55 4H EMA (now at 1.2762) holds. On the upside, above 1.2892 will resume larger rise from 1.2063 and target 61.8% projection of 1.2036 to 1.2826 from 1.2517 at 1.3005. However, sustained break of 55 4H EMA will bring deeper fall back towards 55 D EMA (now at 1.2672), and possibly further to 1.2517 structural support.
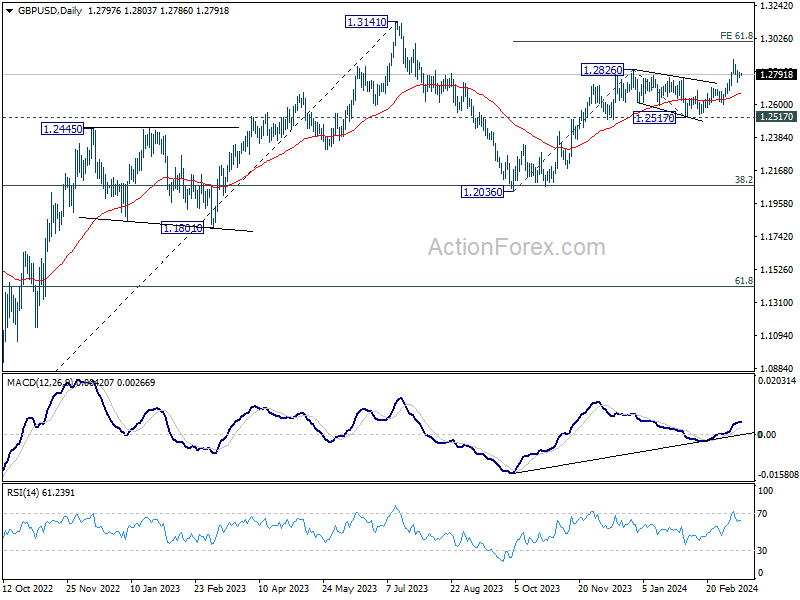
In the bigger picture, price actions from 1.3141 medium term top are seen as a corrective pattern to up trend from 1.0351 (2022 low). Rise from 1.2036 is seen as the second leg, which is still in progress. But upside should be limited by 1.3141 to bring the third leg of the pattern. Meanwhile, break of 1.2517 support will argue that the third leg has already started for 38.2% retracement of 1.0351 (2022 low) to 1.3141 at 1.2075 again.
EUR/USD Daily Outlook
Daily Pivots: (S1) 1.0924; (P) 1.0944; (R1) 1.0968; More...
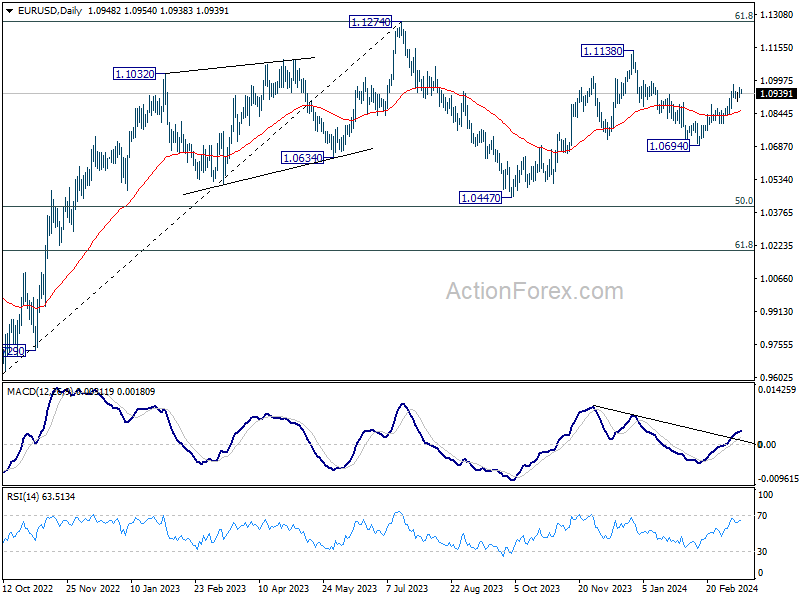
EUR/USD is still capped below 1.0980 resistance despite current recovery. Intraday bias remains neutral first. Further rise is in favor as long as 55 4H EMA (now at 1.0904) holds. Above 1.0980 will resume the rally from 1.0694 to retest 1.1138 high. However, sustained break of the EMA will turn bias to the downside for 1.0797 support instead.
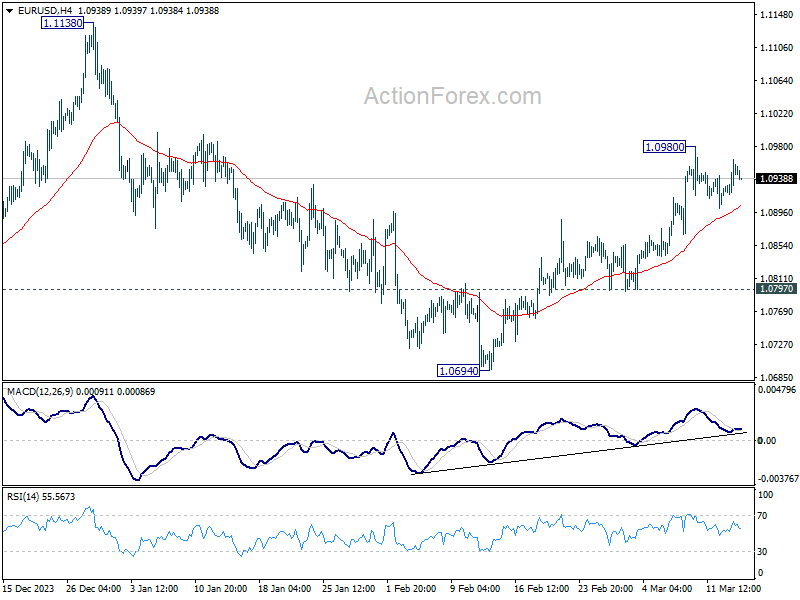
In the bigger picture, price actions from 1.1274 are viewed as a corrective pattern to rise from 0.9534 (2022 low). Rise from 1.0447 is seen as the second leg. While further rally could cannot be ruled out, upside should be limited by 1.1274 to bring the third leg of the pattern. Meanwhile, sustained break of 1.0694 support will argue that the third leg has already started for 1.0447 and possibly below.
Forex Consolidation, Metals Surge, US Retail Sales and PPI Eyed
Overall, the forex markets are still stuck in consolidative trading in Asian session, with expectations set for a subdued European session given the light economic calendar. However, anticipation builds for volatility spikes with releases of US retail sales and PPI later today. For now, Canadian Dollar is the stronger one for the week, followed by Euro and then Dollar. Yen is the weaker one, followed by Sterling and Kiwi. But overall, all major pairs and crosses are bounded inside last week's range.
In contrast, the commodities market, particularly industrial metals, showcases more dynamic price actions. Copper spiked to its highest level in nearly a year, fueled by considerations of production cuts among Chinese smelters. Silver's surge this week, driven by optimism surrounding the global economic recovery, contrasts with Gold's current stagnation. After reaching a record high last week, Gold appears to be in a consolidation phase, taking a momentary pause in the long term uptrend.
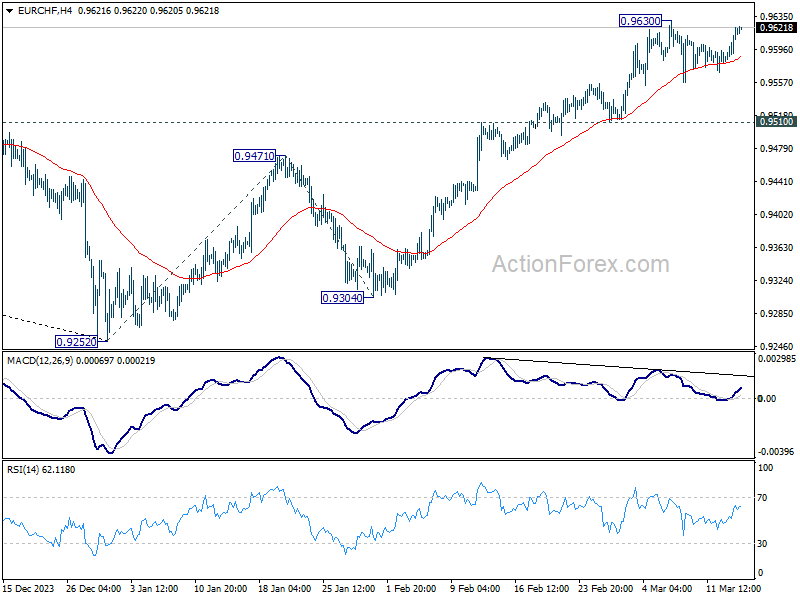
Technically, EUR/CHF might have finished the near term consolidation from 0.9630 after drawing support from 55 4H EMA. Immediate focus is now on 0.9630 resistance. Firm break there will resume whole rise from 0.9252 and target 161.8% projection of 0.9252 to 0.9471 from 0.9304 at 0.9658 next. The question is whether the upside breakout in EUR/CHF would be accompanied by break of 1.0980 resistance in EUR/USD or 0.8891 resistance in USD/CHF. This interplay between these three pairs merits close observation.
In Asia, at the time of writing, Nikkei is up 0.26%. Hong Kong HSI is down -0.78%. China Shanghai SSE is down -0.09%. Singapore Strait Times is up 0.71%. Japan 10-year JGB yield is up 0.014 at 0.775. Overnight, DOW rose 0.10%. S&P 500 fell -0.19%. NASDAQ fell -0.54%. 10-year yield rose 0.037 to 4.192.
Silver targeting key resistance zone at 26 as momentum picks up
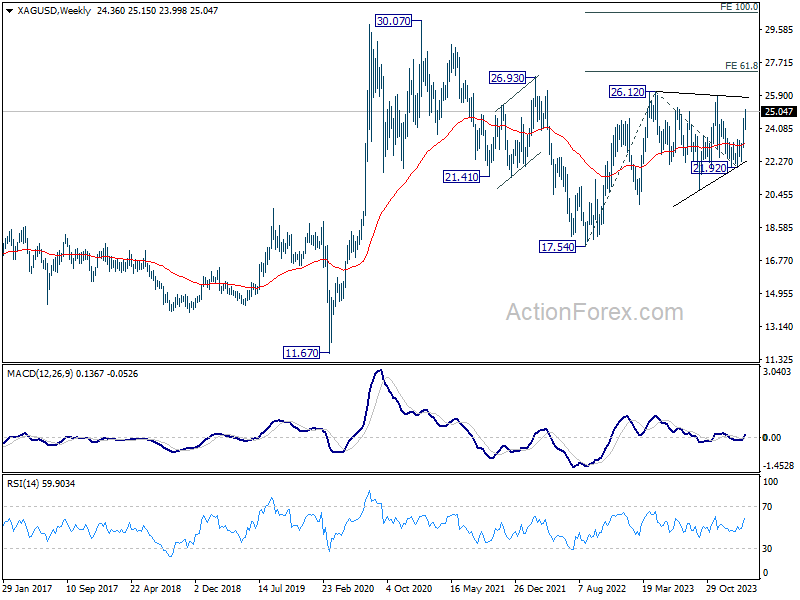
While Gold's rally stalled after hitting new record high last week, Silver is picking up momentum. Given that Silver has been clearly lagging Gold this year, there is room for Silver to catch up and outperform in Q2.
Fundamentally, both Gold and Silver as precious metal would benefit from policy loosening of major global central banks. But as additionally as an industrial metal, Silver could be benefited more with global growth and industrial demands pick up.
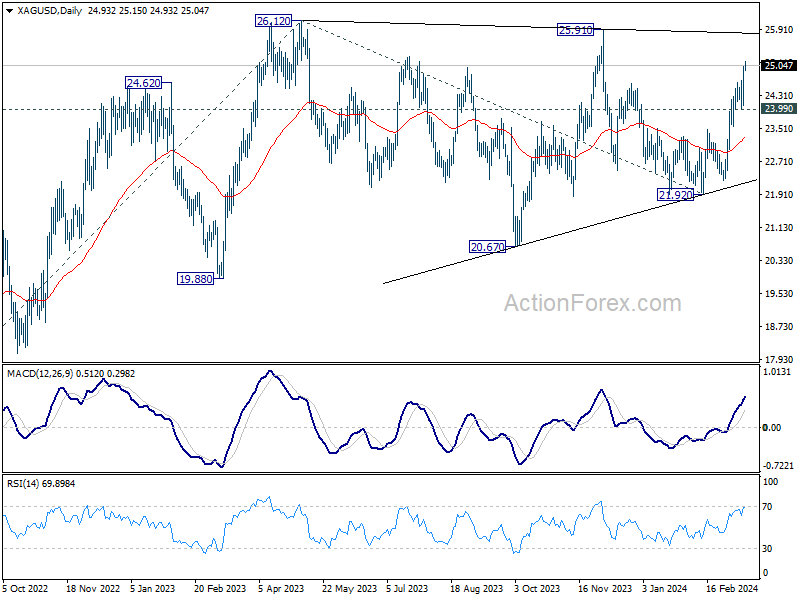
Yet, technically, Silver has to overcome key resistance level around 26 first. For now, near term outlook will stay bullish as long as 23.99 support holds. It's possible that consolidation pattern from 26.12 has completed with three waves to 21.92 already.
Decisive break of 26.12 will confirm resumption of whole rise from 17.54 (2022 low). In this case, the near medium term target will be 61.8% projection of 17.54 to 26.12 from 21.92 at 27.22. Firm break there will pave the way for new record high above 30 later in the year.
Nevertheless, rejection by 25.91/26.12 resistance zone, or break of 23.99 support, will delay the bullish case and extend the consolidation from 26.12 with another falling leg instead.
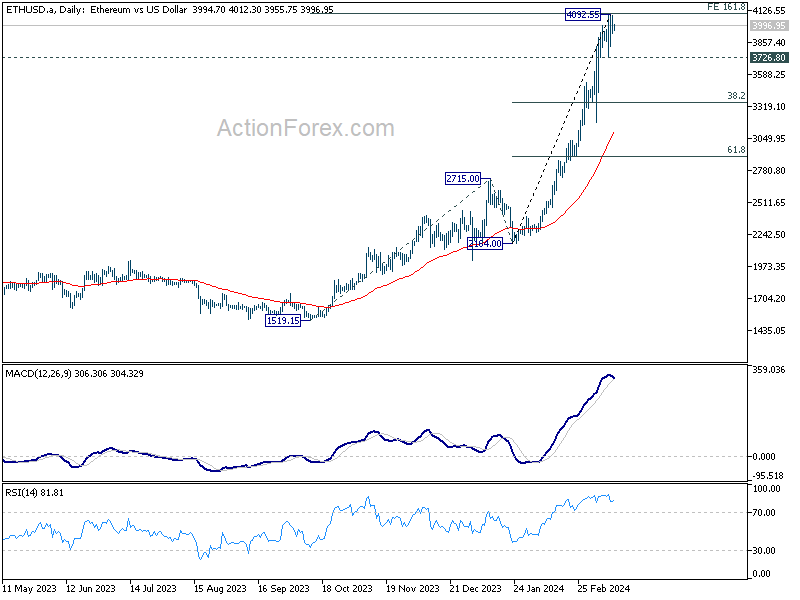
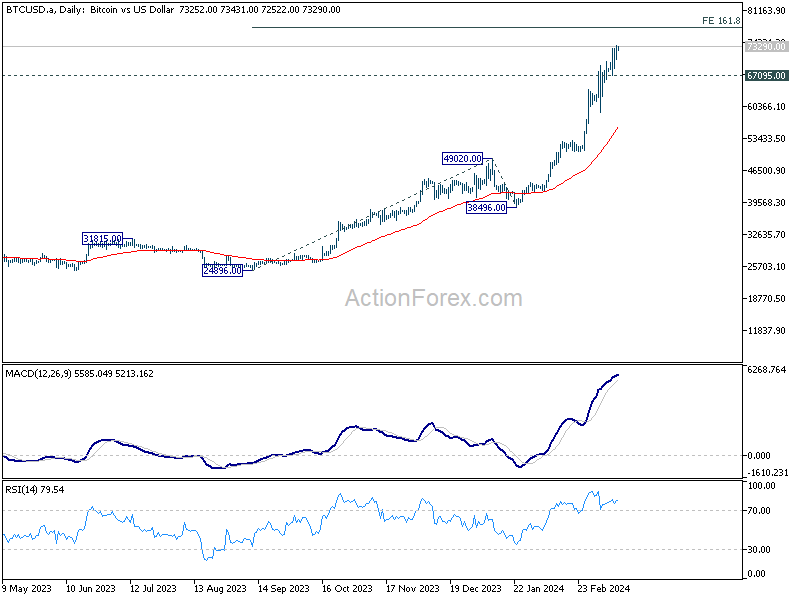
Ethereum's momentum wanes, Bitcoin's consolidation due soon
Ethereum's rally appears to be losing momentum as seen in D MACD, after accelerating to as high as 4092.5. Overbought consolidation in D RSI is probably limiting it at 161.8% projection of 1519.1 to 2715.0 from 2164.0 at 4098.6. Break of 3726.8 support will confirm short term topping, and bring correction to 38.2% retracement of 2164.0 to 4092.5 at 3355.8, and then set the range for sideway consolidations.
As for Bitcoin, there might still be room to extend the record run, but upside potential is limited for the near term, as some consolidations should be due after the strong rally. Upside should be limited by 161.8% projection of 24896 to 49020 from 38496 at 77528. Meanwhile, break of 67095 support will indicate that a short term top is already formed, and deeper pull back could be seen next to start a consolidation phase.
Looking ahead
Swiss PPI is the only feature in Euroepan session. Later in the day, US will release retail sales, PPI and jobless claims. Canada will release manufacturing sales.
EUR/USD Daily Outlook
Daily Pivots: (S1) 1.0924; (P) 1.0944; (R1) 1.0968; More...
EUR/USD is still capped below 1.0980 resistance despite current recovery. Intraday bias remains neutral first. Further rise is in favor as long as 55 4H EMA (now at 1.0904) holds. Above 1.0980 will resume the rally from 1.0694 to retest 1.1138 high. However, sustained break of the EMA will turn bias to the downside for 1.0797 support instead.
In the bigger picture, price actions from 1.1274 are viewed as a corrective pattern to rise from 0.9534 (2022 low). Rise from 1.0447 is seen as the second leg. While further rally could cannot be ruled out, upside should be limited by 1.1274 to bring the third leg of the pattern. Meanwhile, sustained break of 1.0694 support will argue that the third leg has already started for 1.0447 and possibly below.
Economic Indicators Update
| GMT | Ccy | Events | Actual | Forecast | Previous | Revised |
|---|---|---|---|---|---|---|
| 00:01 | GBP | RICS Housing Price Balance Feb | -10% | -10% | -18% | |
| 07:30 | CHF | PPI M/M Feb | 0.20% | -0.50% | ||
| 07:30 | CHF | PPI Y/Y Feb | -2.30% | |||
| 12:30 | CAD | Manufacturing Sales M/M Jan | 0.30% | -0.70% | ||
| 12:30 | USD | Retail Sales M/M Feb | 0.50% | -0.80% | ||
| 12:30 | USD | Retail Sales ex Autos M/M Feb | 0.40% | -0.60% | ||
| 12:30 | USD | PPI M/M Feb | 0.30% | 0.30% | ||
| 12:30 | USD | PPI Y/Y Feb | 1.10% | 0.90% | ||
| 12:30 | USD | PPI Core M/M Feb | 0.20% | 0.50% | ||
| 12:30 | USD | PPI Core Y/Y Feb | 2.00% | 2.00% | ||
| 12:30 | USD | Initial Jobless Claims (Mar 8) | 218K | 217K | ||
| 14:00 | USD | Business Inventories Jan | 0.30% | 0.40% | ||
| 14:30 | USD | Natural Gas Storage | -3B | -40B |
Technical Outlook and Review
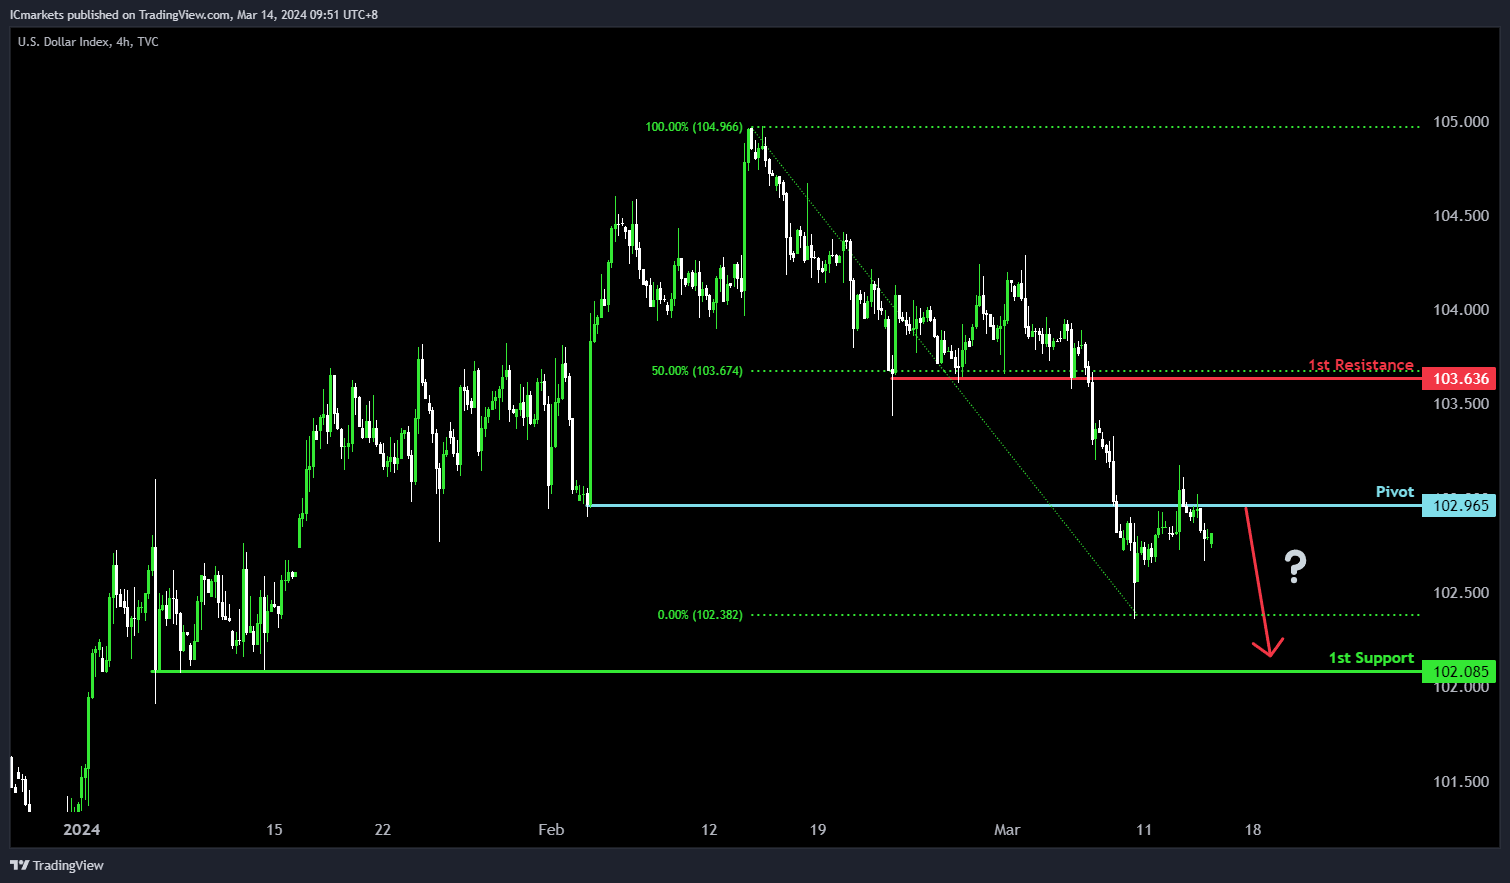
DXY:
For DXY, the potential direction is bearish, aligning with the overall momentum of the chart. There’s a likelihood of a bearish continuation towards the 1st support level. The pivot at 103.44 acts as a significant overlap resistance, indicating a potential barrier where selling pressure may intensify.
On the support side, the 1st support at 102.08 is identified as a multi-swing low support, suggesting its significance as a level where buying interest has historically emerged. Conversely, the 1st resistance at 103.63 serves as a pullback resistance, potentially limiting further upward movement in the price, particularly reinforced by the 50% Fibonacci Retracement level.
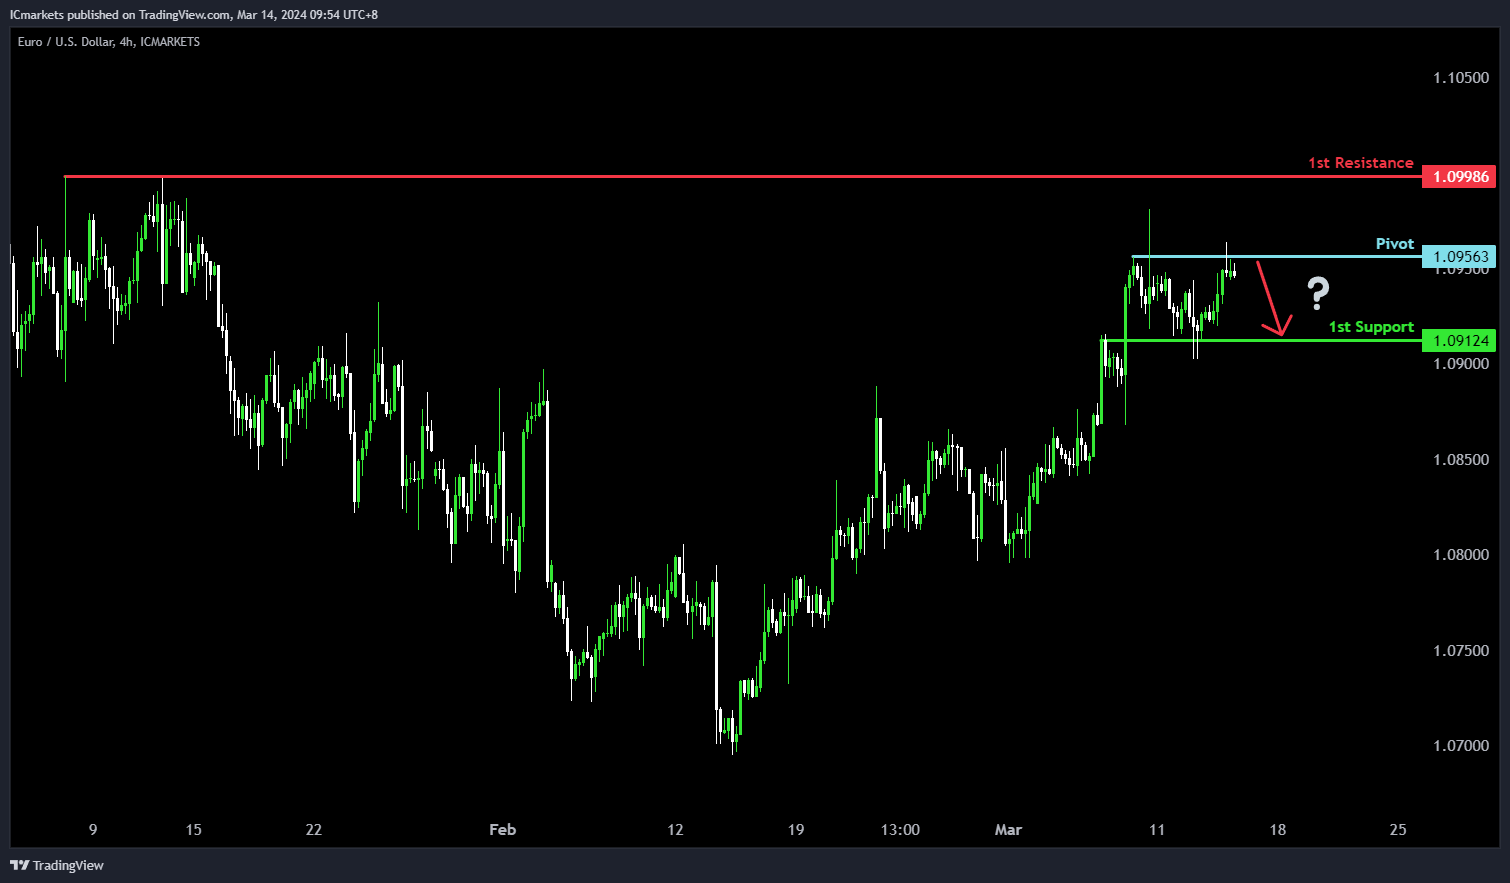
EUR/USD:
For EUR/USD, the potential direction is bearish, despite the overall bullish momentum of the chart. There’s a possibility of a bearish reaction off the pivot level, leading to a drop towards the 1st support.
The pivot at 1.0956 is significant as multi-swing high resistance, suggesting a potential barrier where selling pressure might increase. The 1st support at 1.0912, on the other hand, is identified as an overlap support, indicating its historical significance as a level where buying interest has emerged.
Conversely, the 1st resistance at 1.0998 serves as swing high resistance, potentially limiting further upward movement in the price
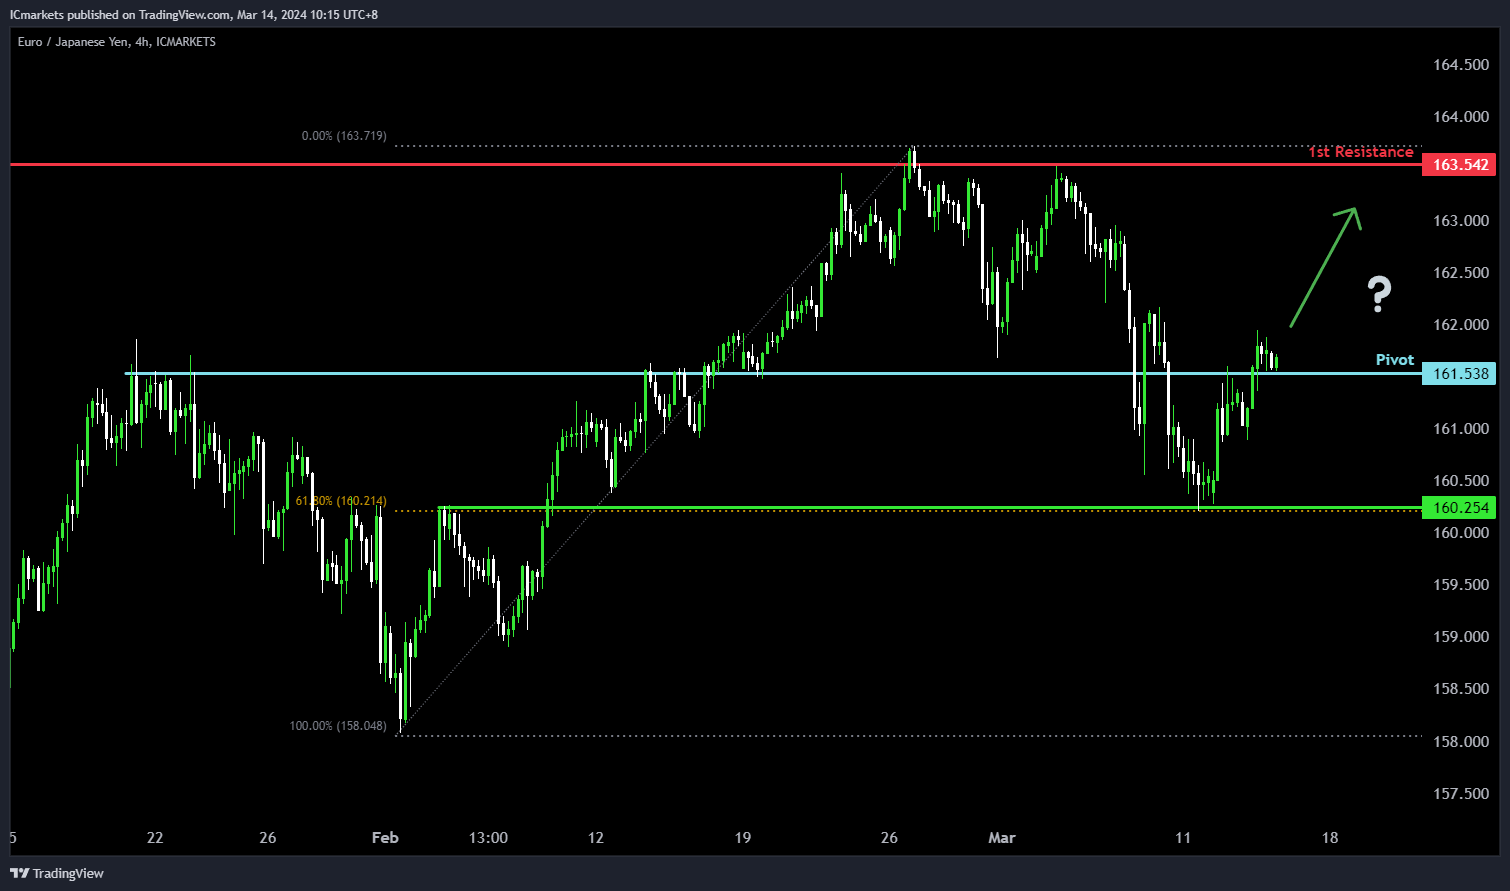
EUR/JPY:
The EUR/JPY chart suggests a potential bullish direction despite the prevailing bearish momentum. Several factors contribute to this analysis.
The pivot level at 161.538 is notable as it coincides with pullback support, indicating a significant historical level where buying interest may emerge.
Additionally, the 1st support level at 160.254 aligns with an overlap support and the 61.80% Fibonacci Retracement level, further reinforcing its significance as a potential area of support.
On the resistance side, the 1st resistance level at 163.542 is identified as a swing high resistance, representing a historical barrier to upward movement.
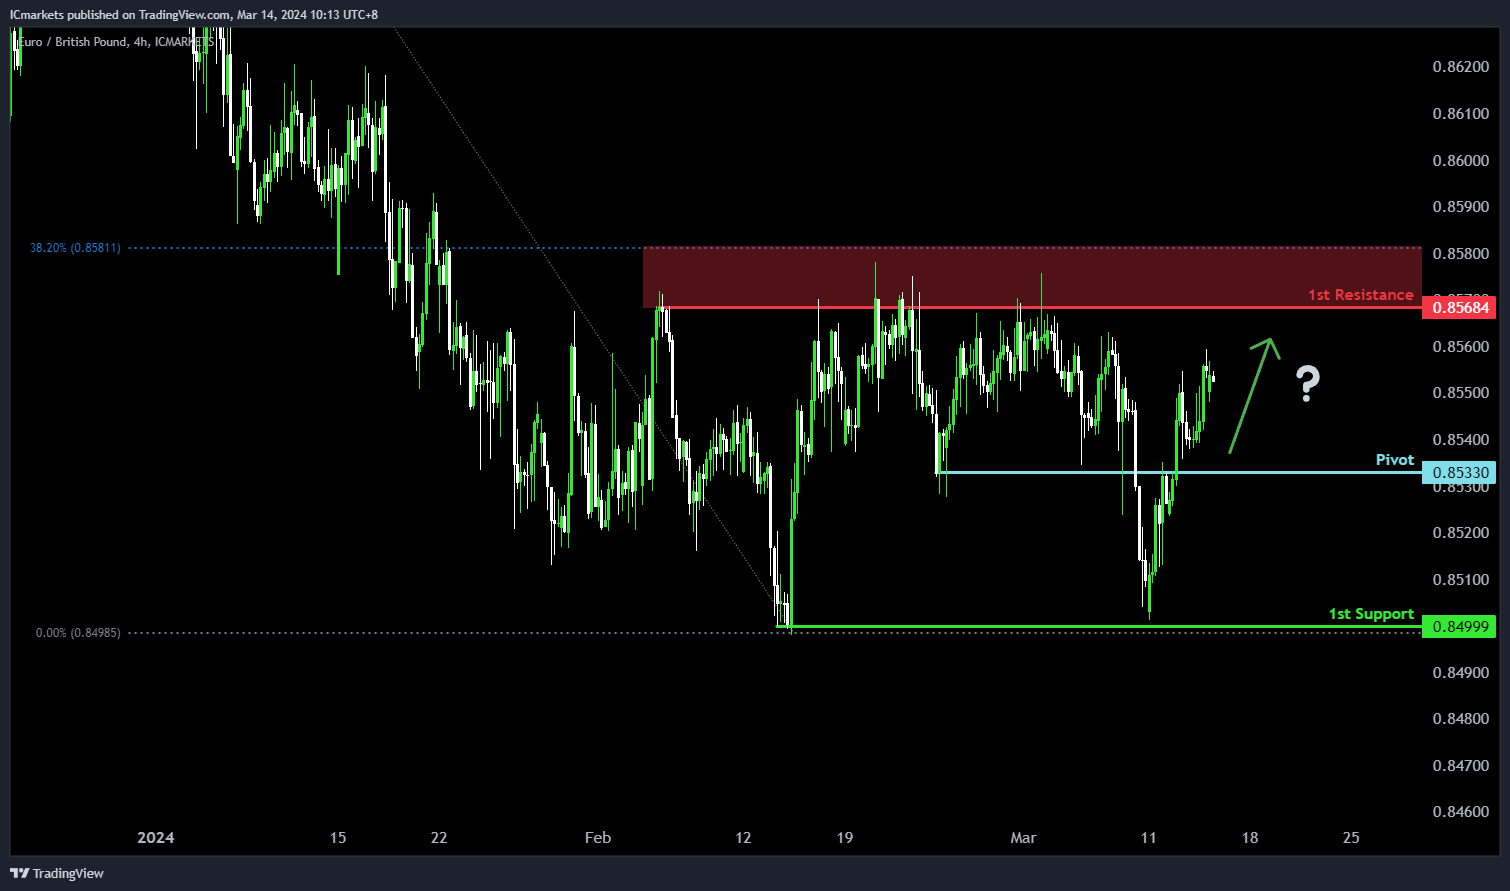
EUR/GBP:
The EUR/GBP chart suggests a potential bullish direction despite the prevailing bearish momentum. Several factors contribute to this analysis.
The pivot level at 0.85330 is significant as it serves as pullback support, indicating a historical level where buying interest may emerge.
Furthermore, the 1st support level at 0.84999 aligns with a swing low support, further reinforcing its significance as a potential area where buyers might enter the market.
On the resistance side, the 1st resistance level at 0.85684 is identified as a swing high resistance and coincides with the 38.20% Fibonacci Retracement level, suggesting a historical barrier to upward movement.
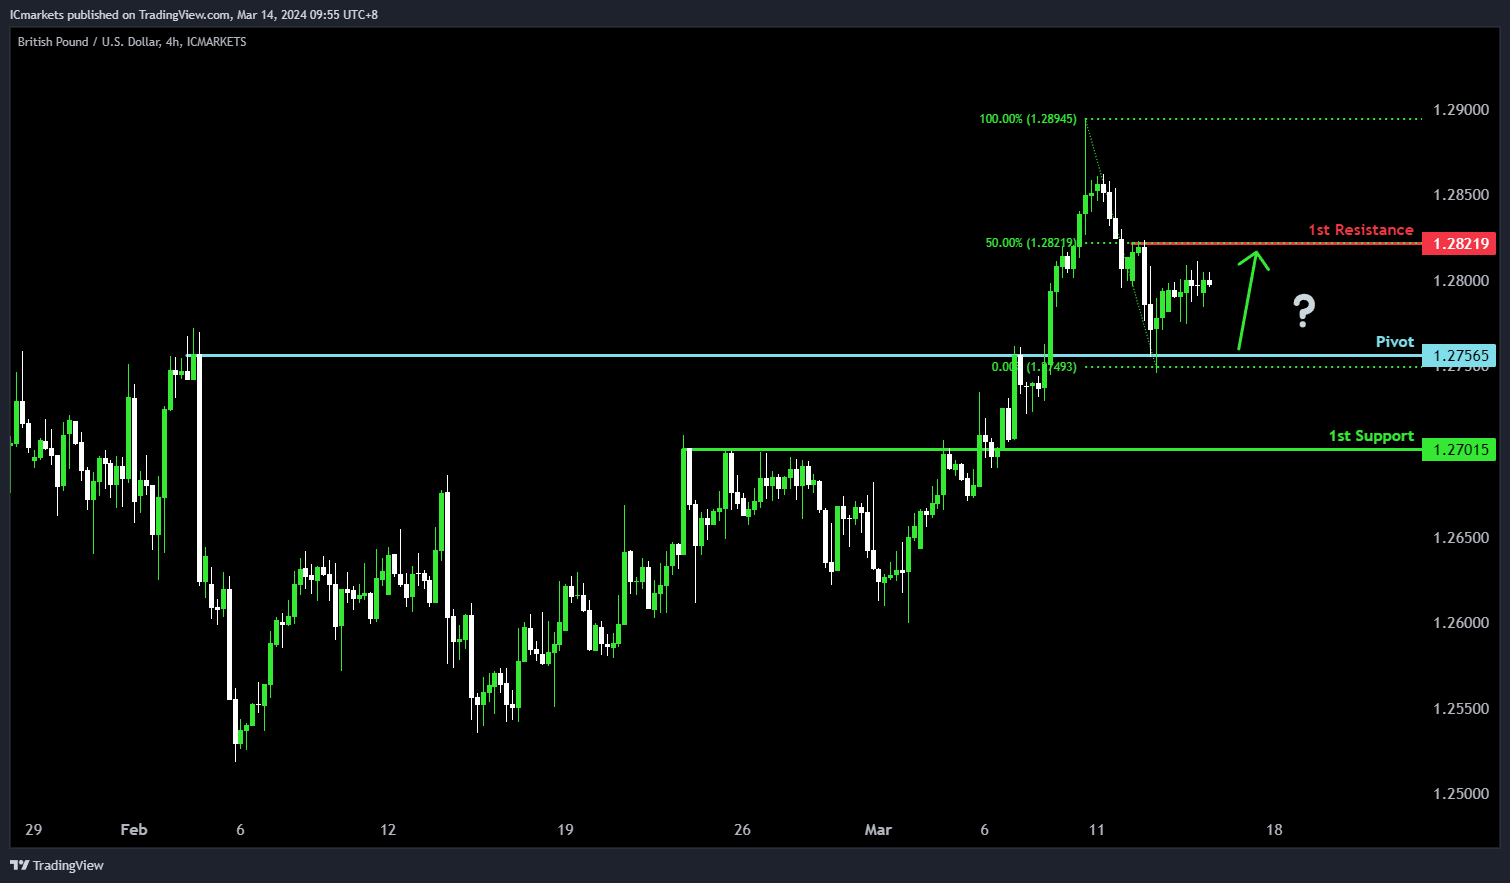
GBP/USD:
For GBP/USD, the potential direction is bullish, aligning with the overall bullish momentum of the chart. There’s a likelihood of a bullish bounce off the pivot level, signaling a move towards the 1st resistance.
The pivot at 1.2756 acts as an overlap support, suggesting its significance as a level where buyers may intervene to support the price. Additionally, the 1st support at 1.2701 reinforces this pattern as another overlap support, further indicating its historical importance.
On the resistance side, the 1st resistance at 1.2821 is identified as swing high resistance, potentially impeding further upward movement. The presence of the 50% Fibonacci Retracement adds to its significance as a potential barrier where selling pressure could increase.
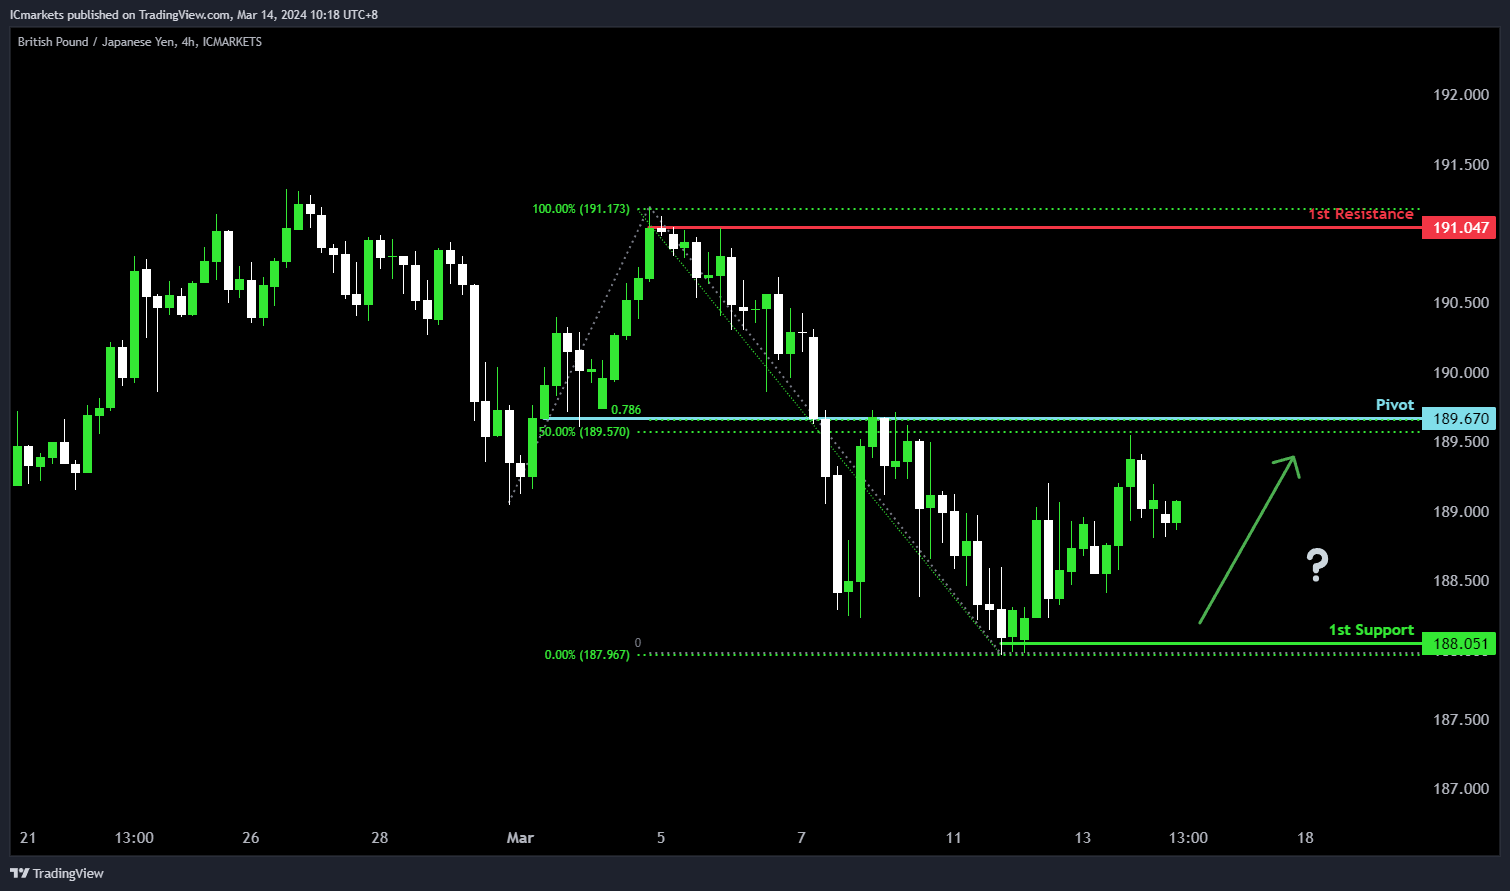
GBP/JPY:
The GBP/JPY chart suggests a potential bullish direction despite the prevailing bearish momentum. Several factors contribute to this analysis.
The pivot level at 189.670 is significant as it coincides with pullback resistance, the 50% Fibonacci Retracement level, and the 78.60% Fibonacci Projection. This convergence of indicators highlights a crucial area where price might find resistance but could also serve as a potential turning point for a bullish reversal.
Additionally, the 1st support level at 188.051 corresponds to a swing low support, indicating historical buying interest in this region.
On the resistance side, the 1st resistance level at 191.047 is identified as a swing high resistance, representing a historical barrier to upward movement.
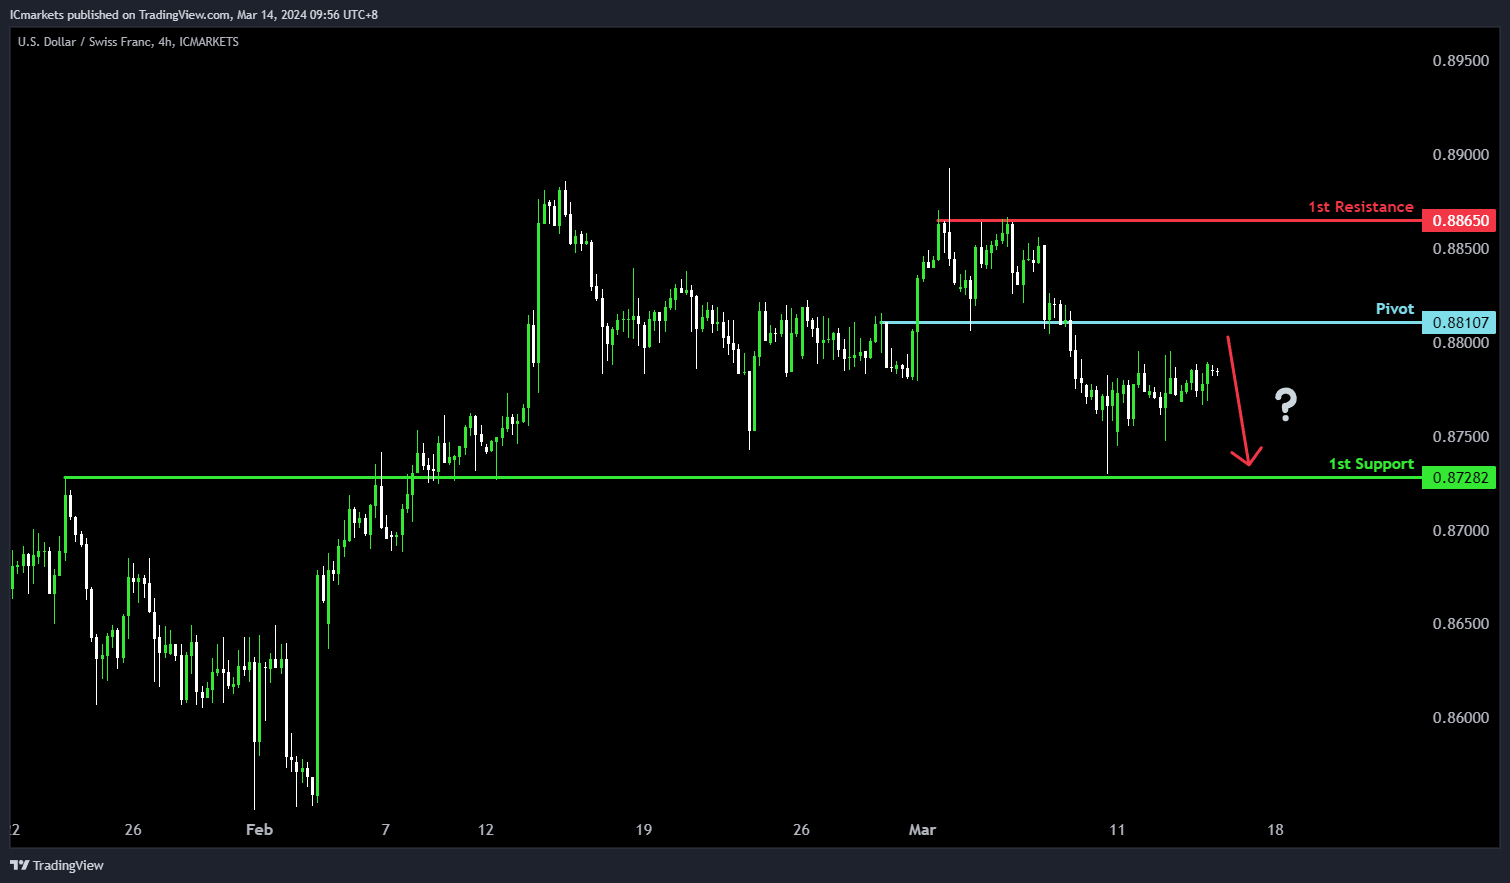
USD/CHF:
For USD/CHF, the potential direction is bearish, aligning with the overall bearish momentum of the chart. There’s a possibility of a bearish reaction off the pivot level, leading to a drop towards the 1st support.
The pivot at 0.8810 serves as a point of pullback resistance, indicating its significance as a level where selling pressure may increase. In contrast, the 1st support at 0.8728 acts as an overlap support, suggesting historical buying interest in that area.
On the resistance side, the 1st resistance at 0.8865 is identified as multi-swing high resistance, potentially hindering further upward movement.
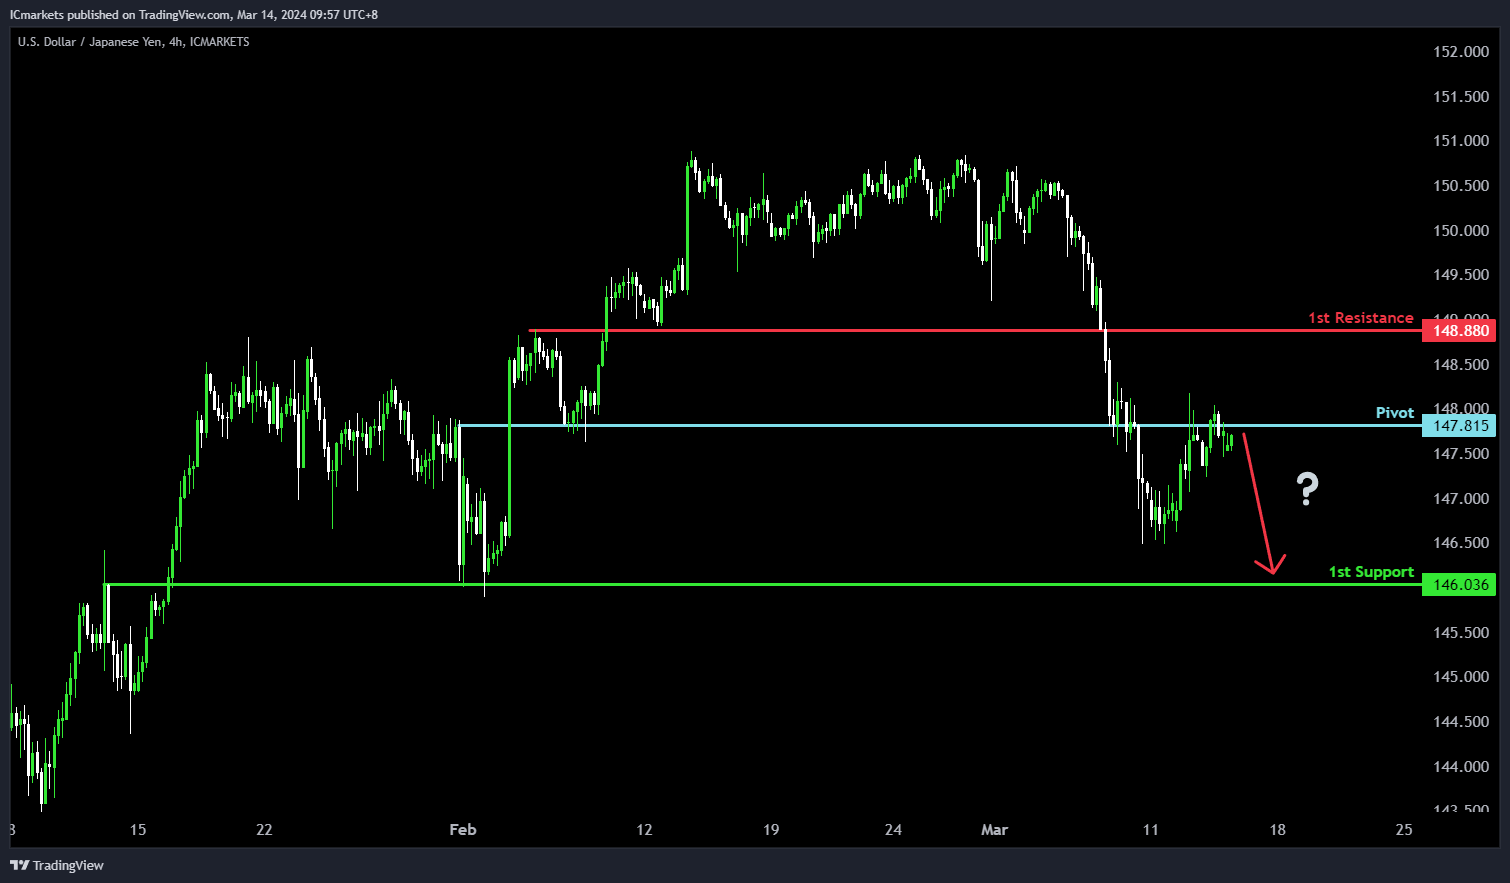
USD/JPY:
For USD/JPY, the potential direction is bearish, reflecting the overall bearish momentum of the chart. There’s a likelihood of a bearish reaction off the pivot level, leading to a decline towards the 1st support.
The pivot at 147.81 acts as an overlap resistance, indicating its historical significance as a level where selling pressure may intensify. Conversely, the 1st support at 146.03 serves as an overlap support, suggesting a historical area where buying interest has emerged.
On the resistance side, the 1st resistance at 148.88 is identified as a pullback resistance, potentially limiting further upward movement
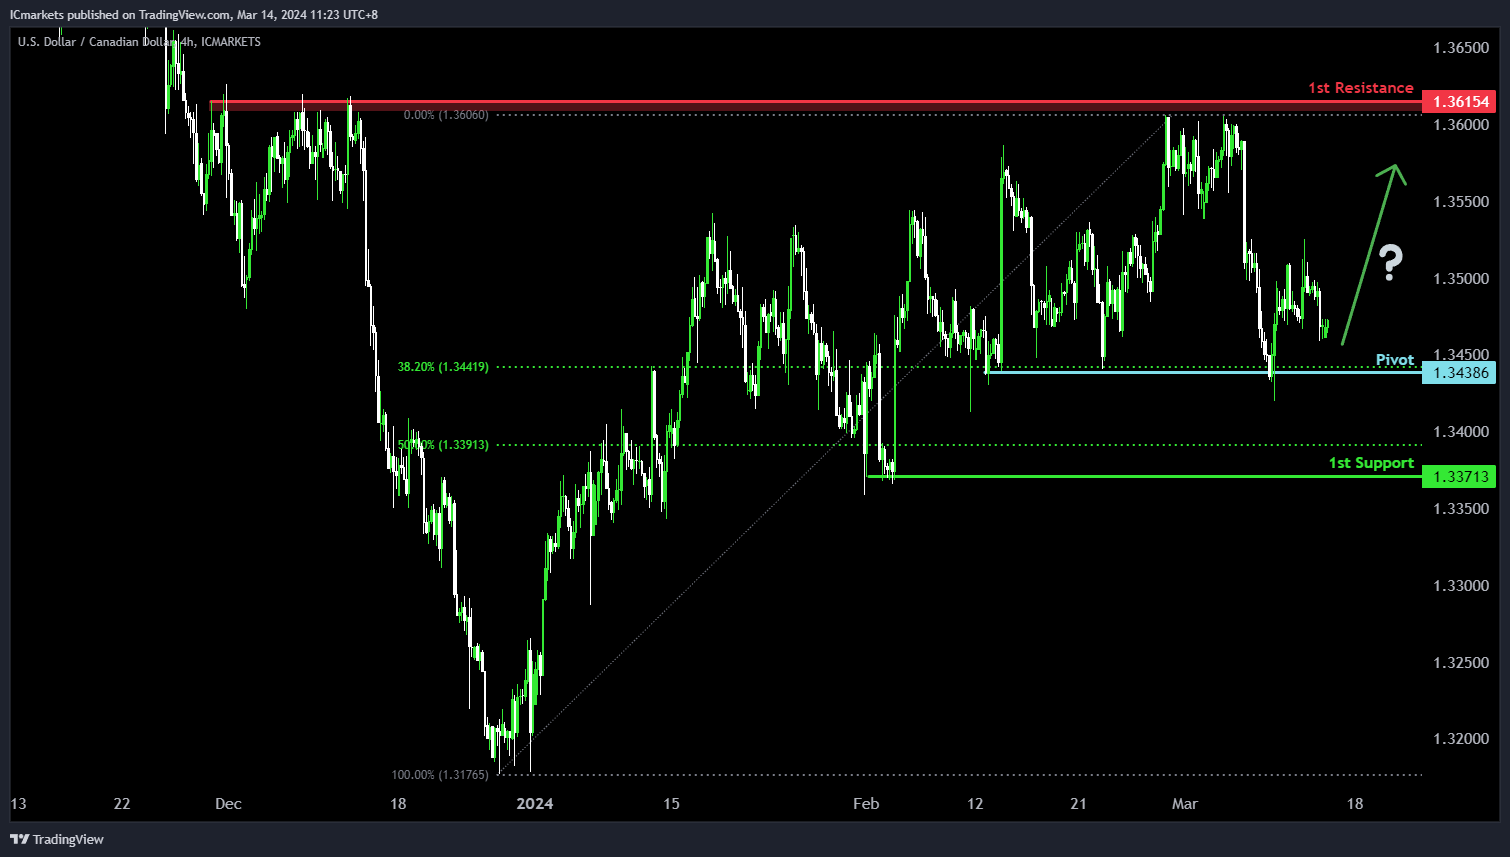
USD/CAD:
The USD/CAD chart currently demonstrates a neutral bias. In this context, there is a potential scenario for price to fluctuate between the pivot and the 1st resistance.
The pivot level at 1.3438 is identified as a pullback support that aligns with the 38.20% Fibonacci Retracement level where price could potentially bounce off to climb higher. Higher up, the 1st resistance level at 1.3615 is noted as a pullback resistance, further highlighting its importance as a potential resistance zone.
To the downside, the 1st support level at 1.3371 is marked as a pullback support that aligns close to the 50.00% Fibonacci Retracement level, reinforcing its significance as a key support level.
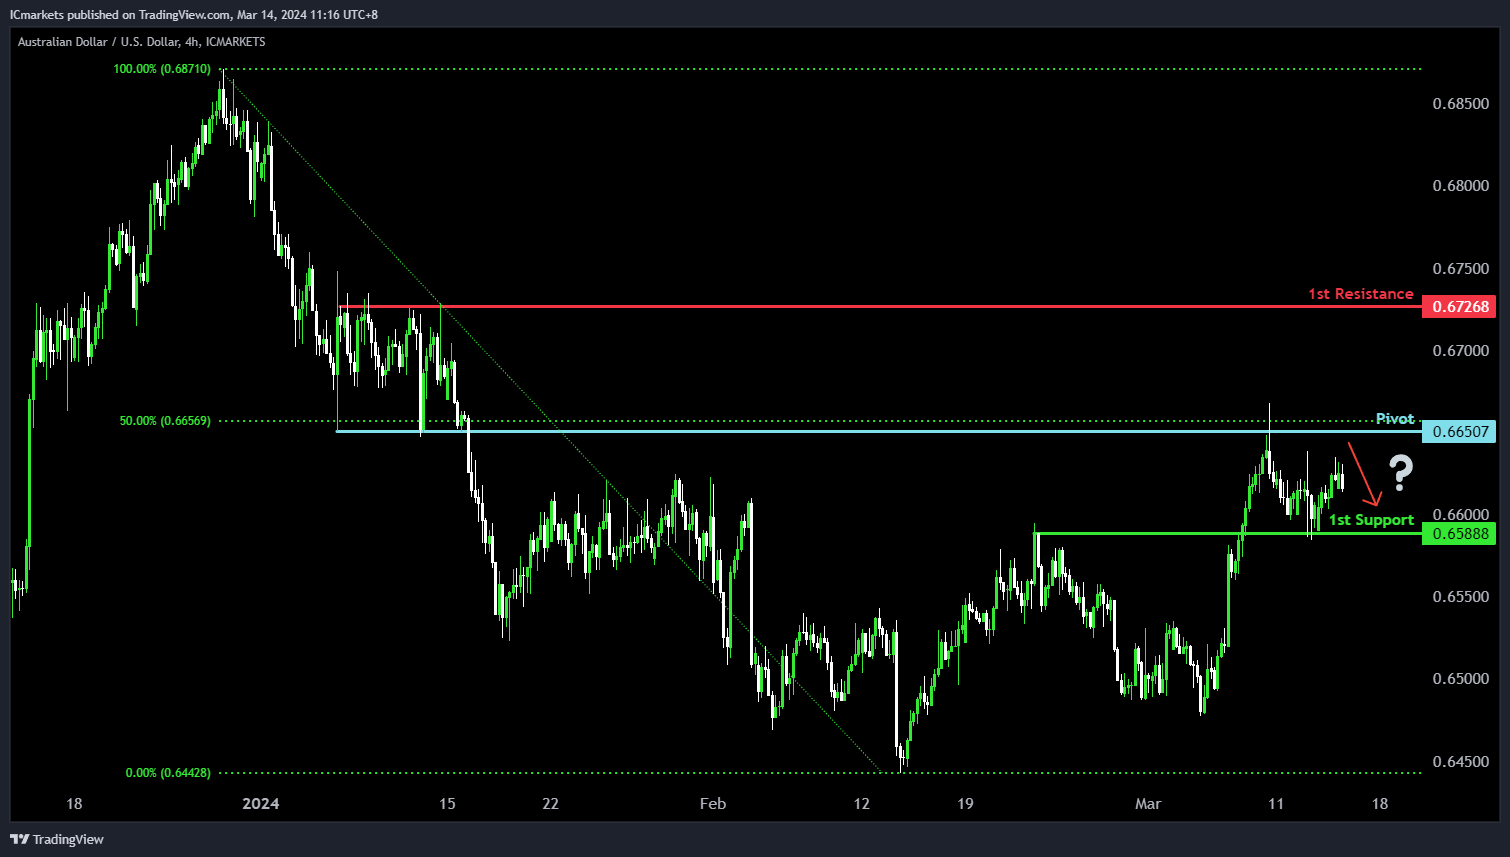
AUD/USD:
The AUD/USD chart currently demonstrates a neutral bias. In this context, there is a potential scenario for price to fluctuate between the pivot and the 1st support.
The pivot level at 0.6650 is identified as an overlap resistance that aligns with the 50.00% Fibonacci Retracement level where price could potentially reverse from to drop lower. The 1st support level at 0.6588 is marked as an overlap support, reinforcing its significance as a key support level.
On the resistance side, the 1st resistance level at 0.6726 is noted as a pullback resistance, potentially limiting any further upward movement.
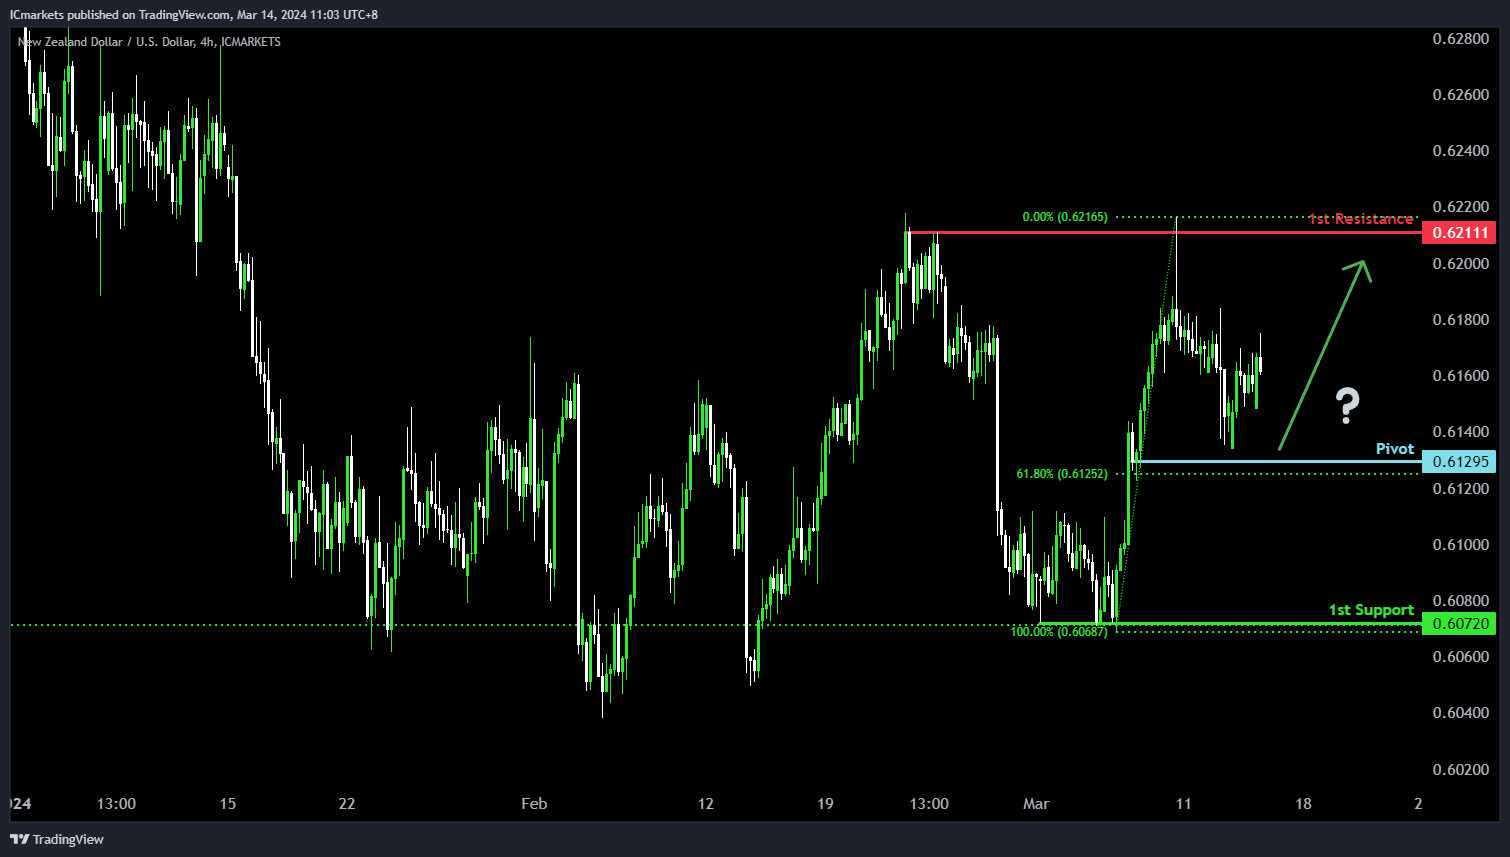
NZD/USD
The NZD/USD chart currently demonstrates a neutral bias. In this context, there is a potential scenario for price to fluctuate between the pivot and the 1st resistance.
The pivot level at 0.6129 is identified as a pullback support that aligns close to the 61.80% Fibonacci Retracement level where price could potentially reverse from to climb higher. The 1st resistance level at 0.6211 is identified as a multi-swing-high resistance, potentially limiting any further upward movement.
On the support side, the 1st support level at 0.6072 is marked as a pullback support, reinforcing its significance as a key support level.
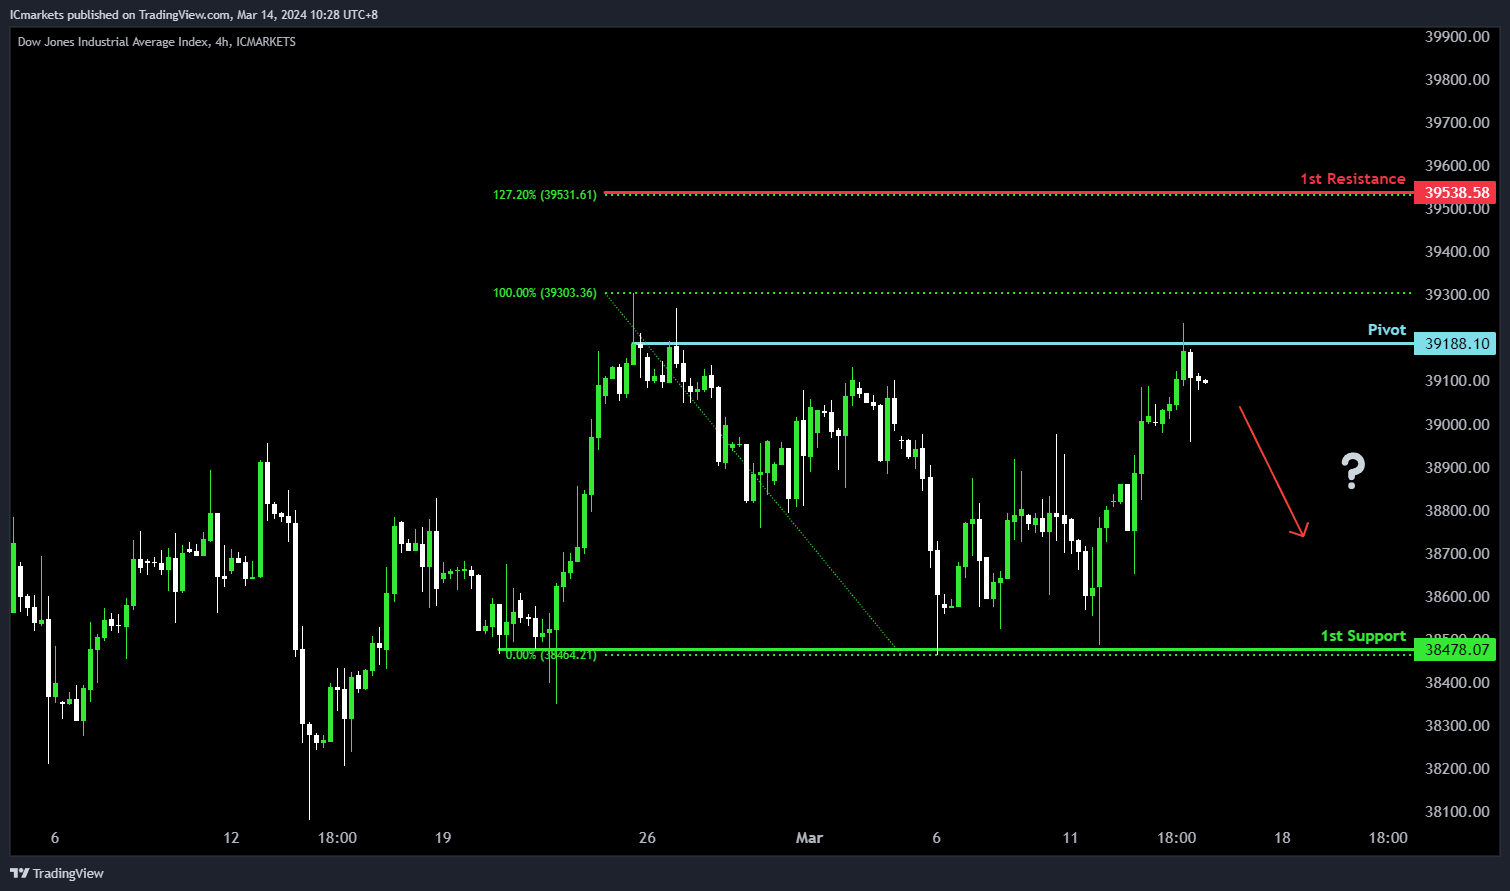
DJ30:
The DJ30 chart currently indicates a potential bearish direction, despite the prevailing bullish momentum. Several factors contribute to this analysis.
The pivot level at 39178.61 is significant as it serves as a swing high resistance, suggesting a historical level where selling pressure may emerge.
Furthermore, the 1st support level at 38478.07 aligns with a swing low support, reinforcing its significance as a potential area where buyers might step in.
On the resistance side, the 1st resistance level at 39538.58 is identified as a significant level, marked by the 127.20% Fibonacci Extension, indicating a potential barrier to further bullish movement.
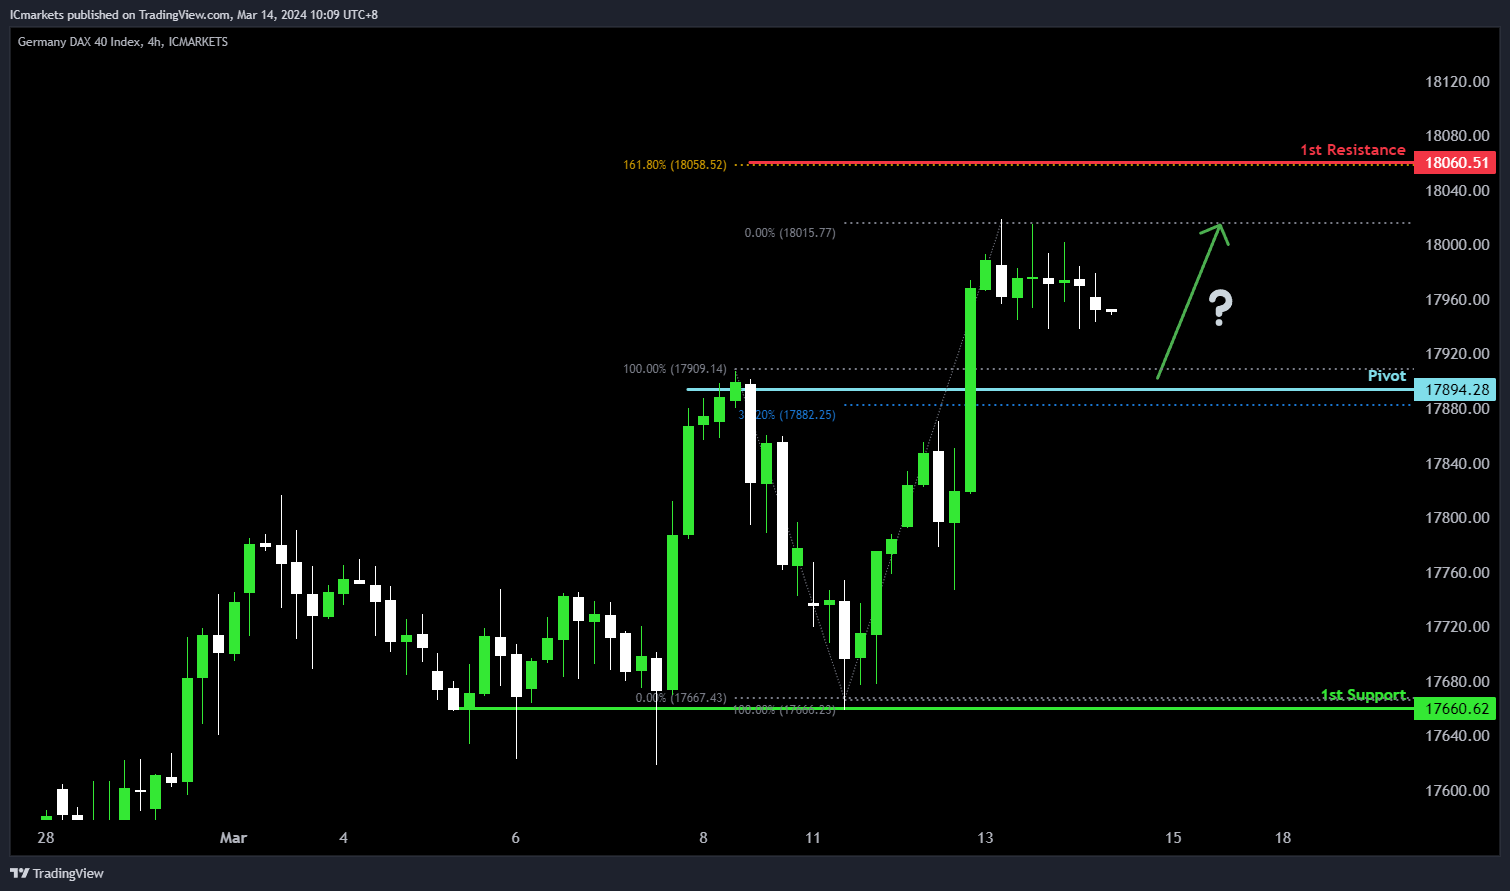
GER40:
The GER40 chart indicates a potential bullish direction, aligning with the overall bullish momentum. Several factors contribute to this analysis.
The pivot level at 17894.28 serves as a pullback support and coincides with the 38.20% Fibonacci Retracement, indicating a significant historical level where buying interest may emerge.
Furthermore, the 1st support level at 17660.62 aligns with a swing low support, reinforcing its significance as a potential area where buyers might enter the market.
On the resistance side, the 1st resistance level at 18060.51 is identified as significant, marked by the 161.80% Fibonacci Extension, suggesting a potential barrier to further bullish movement.
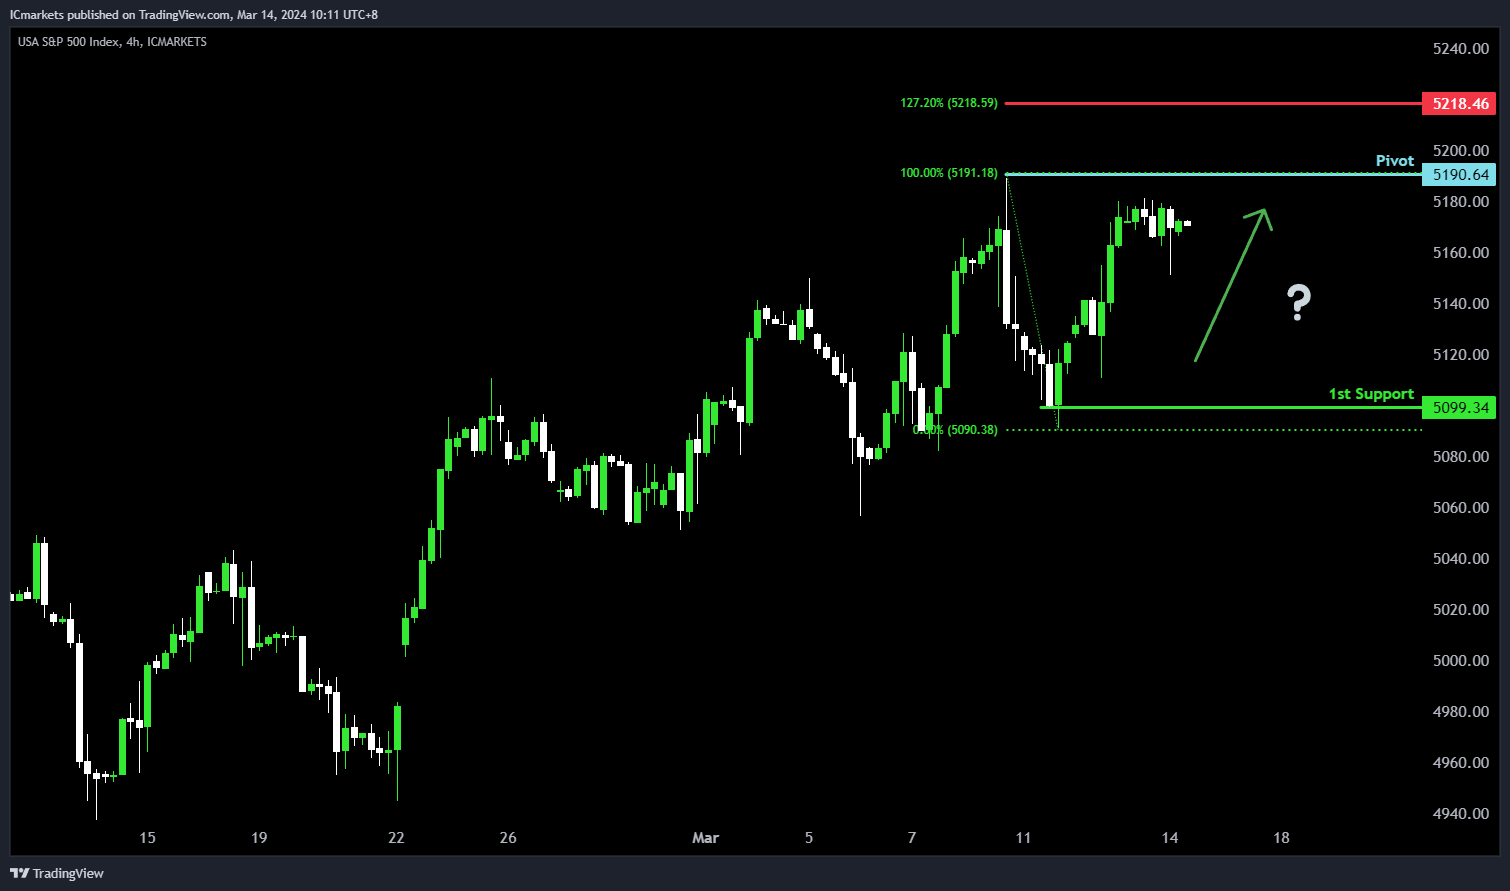
US500:
The US500 chart indicates a potential bullish direction, consistent with the overall bullish momentum. Several factors contribute to this analysis.
The pivot level at 5190.64 is significant as it represents a swing high resistance, suggesting a historical barrier to upward movement.
Additionally, the 1st support level at 5099.34 corresponds to a swing low support, indicating a significant historical level where buying interest has previously emerged.
On the resistance side, the 1st resistance level at 5218.46 is marked by the 127.20% Fibonacci Extension, further reinforcing its significance as a potential barrier to further bullish movement.
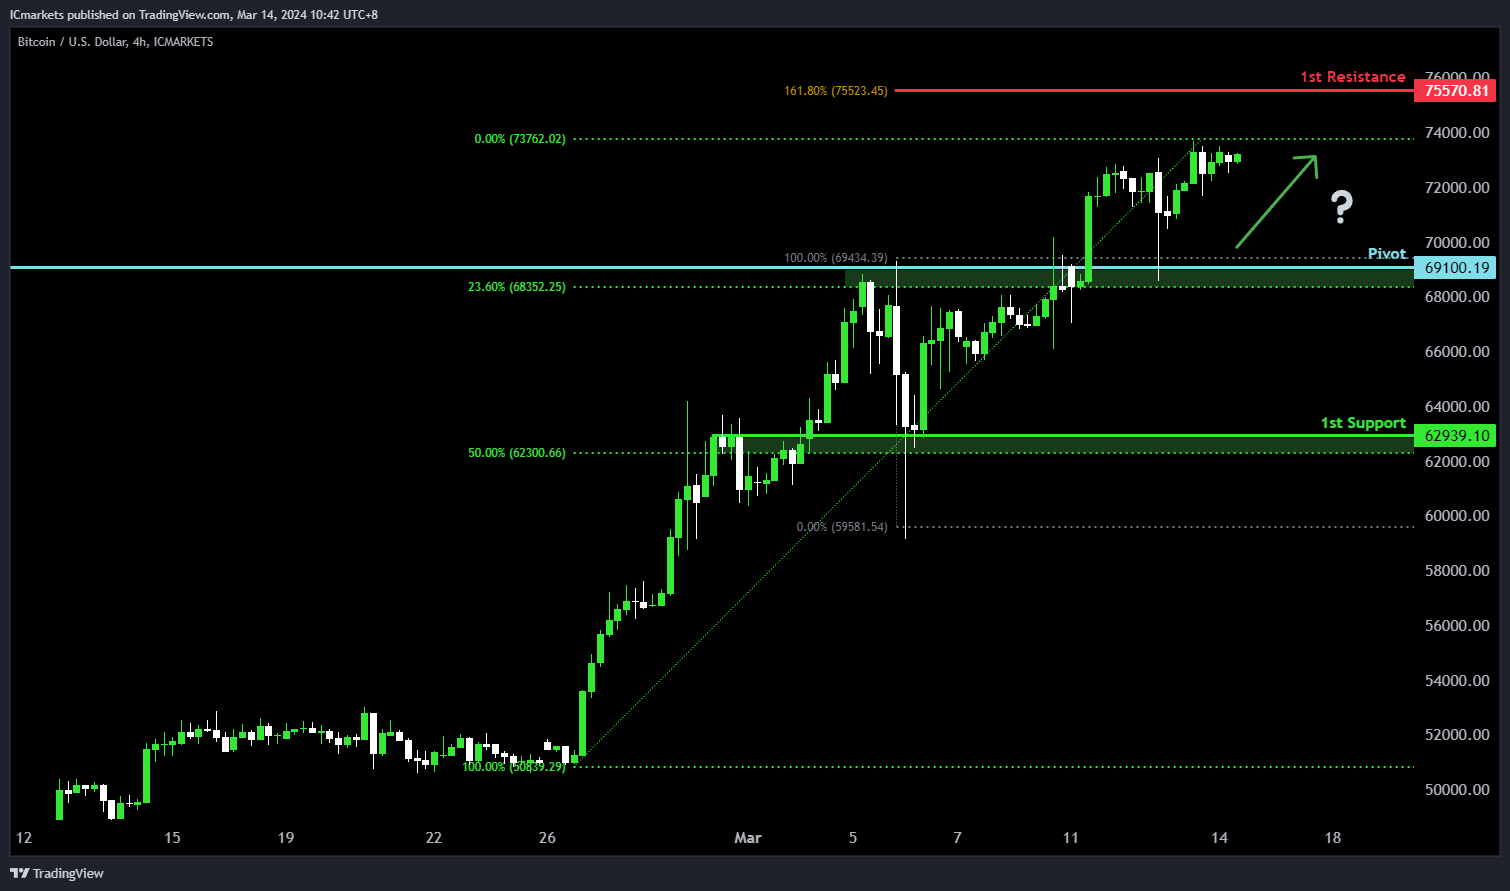
BTC/USD:
The BTC/USD chart indicates a potential bullish direction, in line with the overall bullish momentum. Several factors contribute to this analysis.
The pivot level at 69100.19 serves as a pullback support and coincides with the 23.60% Fibonacci Retracement, highlighting its significance as a potential area where buying interest might emerge.
Furthermore, the 1st support at 62939.10 aligns with a swing low support and corresponds to the 50% Fibonacci Retracement level, further reinforcing its importance as a potential area where buyers could enter the market.
On the resistance side, the 1st resistance level at 75570.81 is identified by the 161.80% Fibonacci Extension, indicating a significant barrier to further bullish movement.
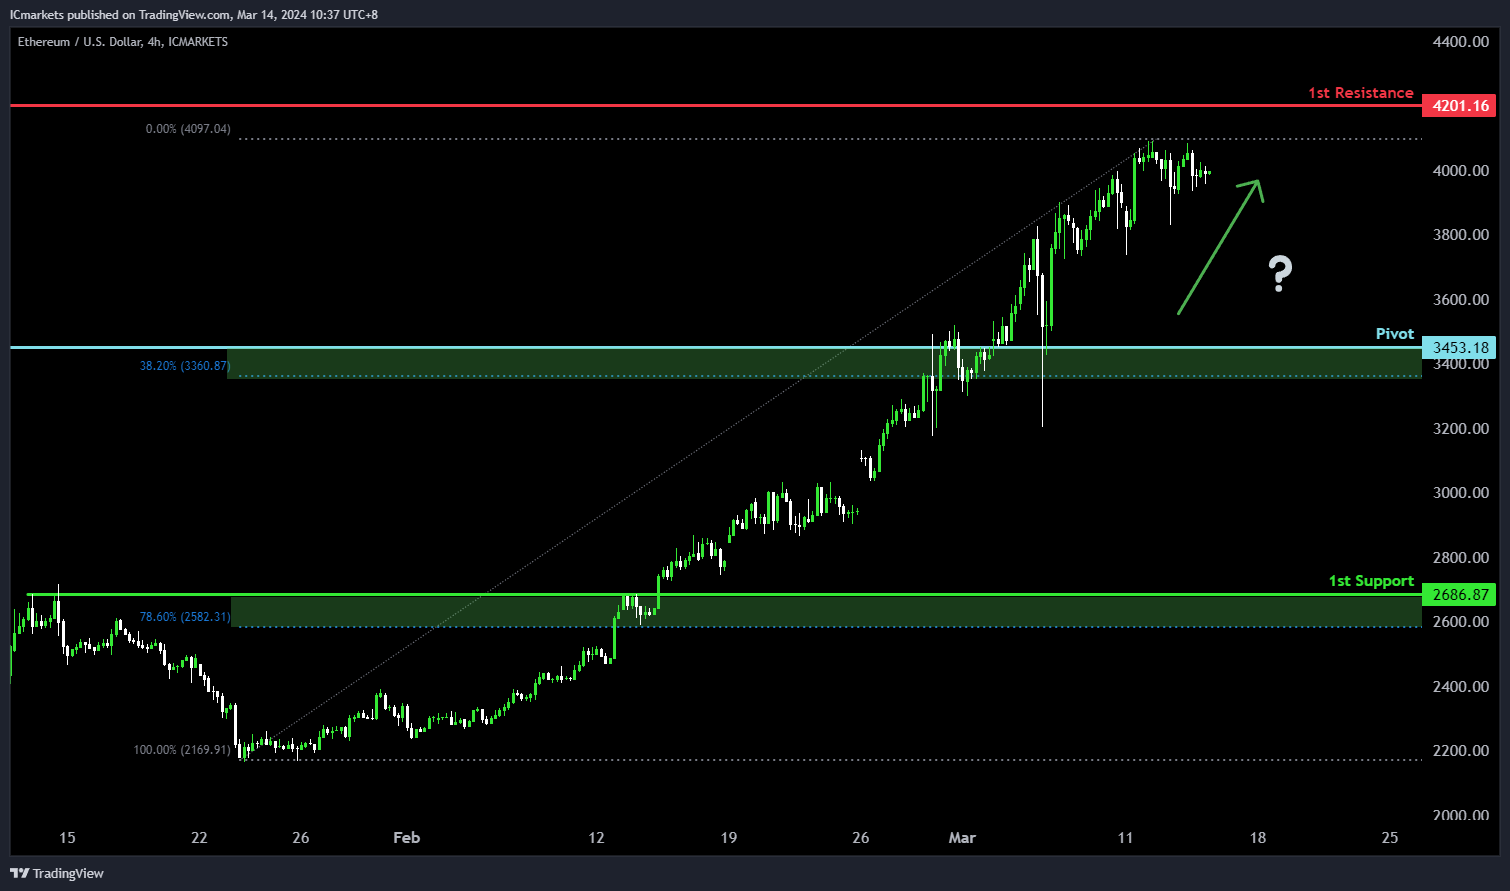
ETH/USD:
The ETH/USD chart suggests a bullish potential direction, reflecting the overall bullish momentum. Several factors contribute to this analysis.
The pivot level at 3453.18 serves as a pullback support and coincides with the 38.20% Fibonacci Retracement, indicating a significant historical level where buying interest may emerge.
Furthermore, the 1st support at 2686.87 aligns with a swing low support and corresponds to the 78.60% Fibonacci Retracement level, further reinforcing its significance as a potential area where buyers might enter the market.
On the resistance side, the 1st resistance level at 4201.16 is identified as an overlap resistance, suggesting a historical barrier to further upward movement.
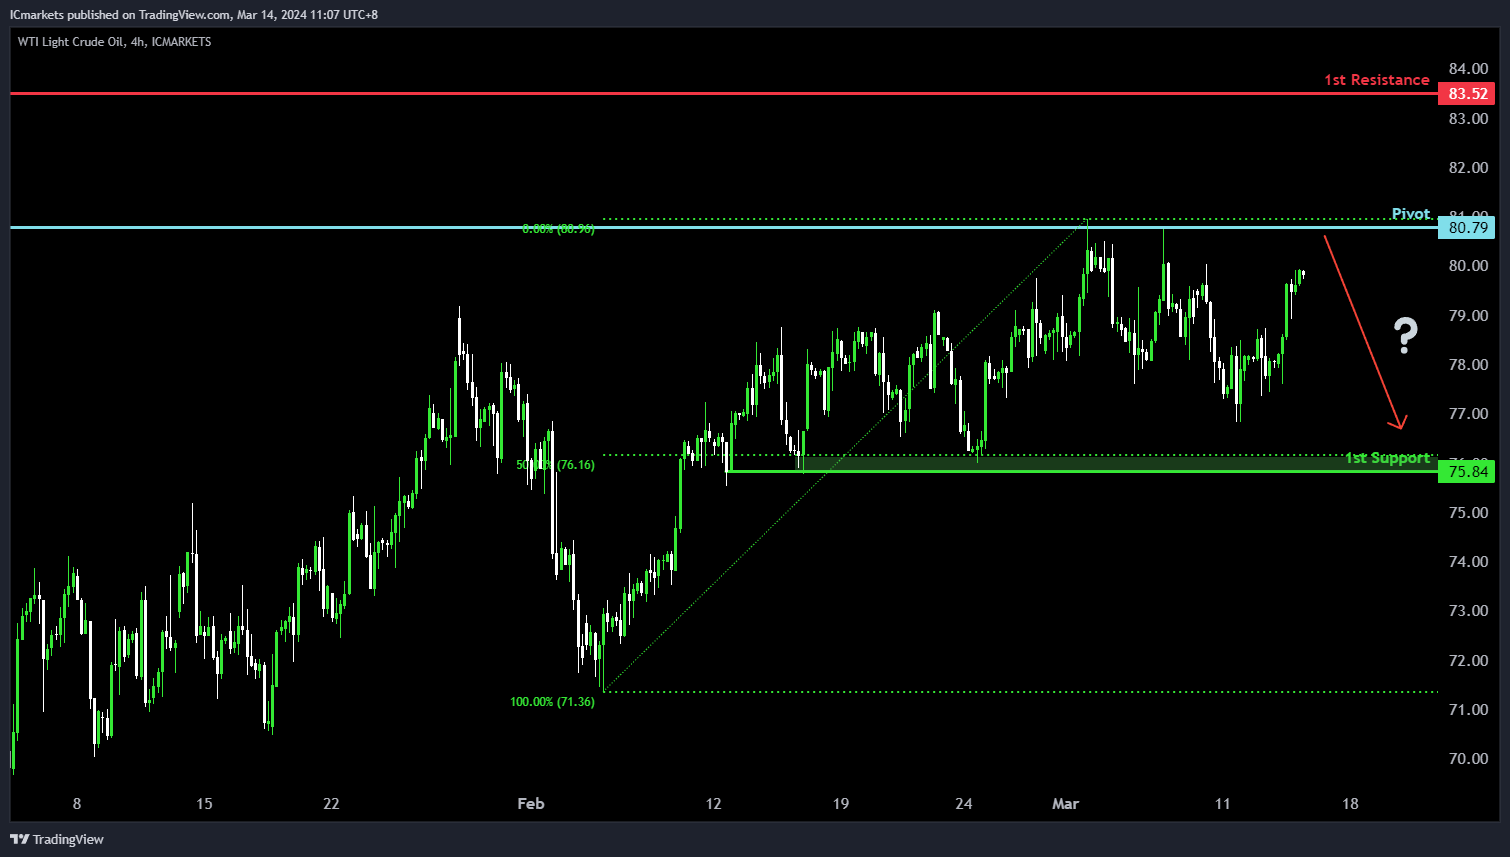
WTI/USD:
The WTI (West Texas Intermediate) chart currently demonstrates a neutral bias. In this context, there is a potential scenario for price to fluctuate between the pivot and the 1st support.
The pivot level at 80.79 is identified as an overlap resistance where price could potentially reverse from to drop lower. Further below, the 1st support level at 75.84 is marked as a pullback support that aligns close to the 50.00% Fibonacci Retracement level, reinforcing its significance as a key support level.
To the upside, the 1st resistance level at 83.52 is noted as a pullback, further reinforcing its significance as a potential barrier to further bullish movement.
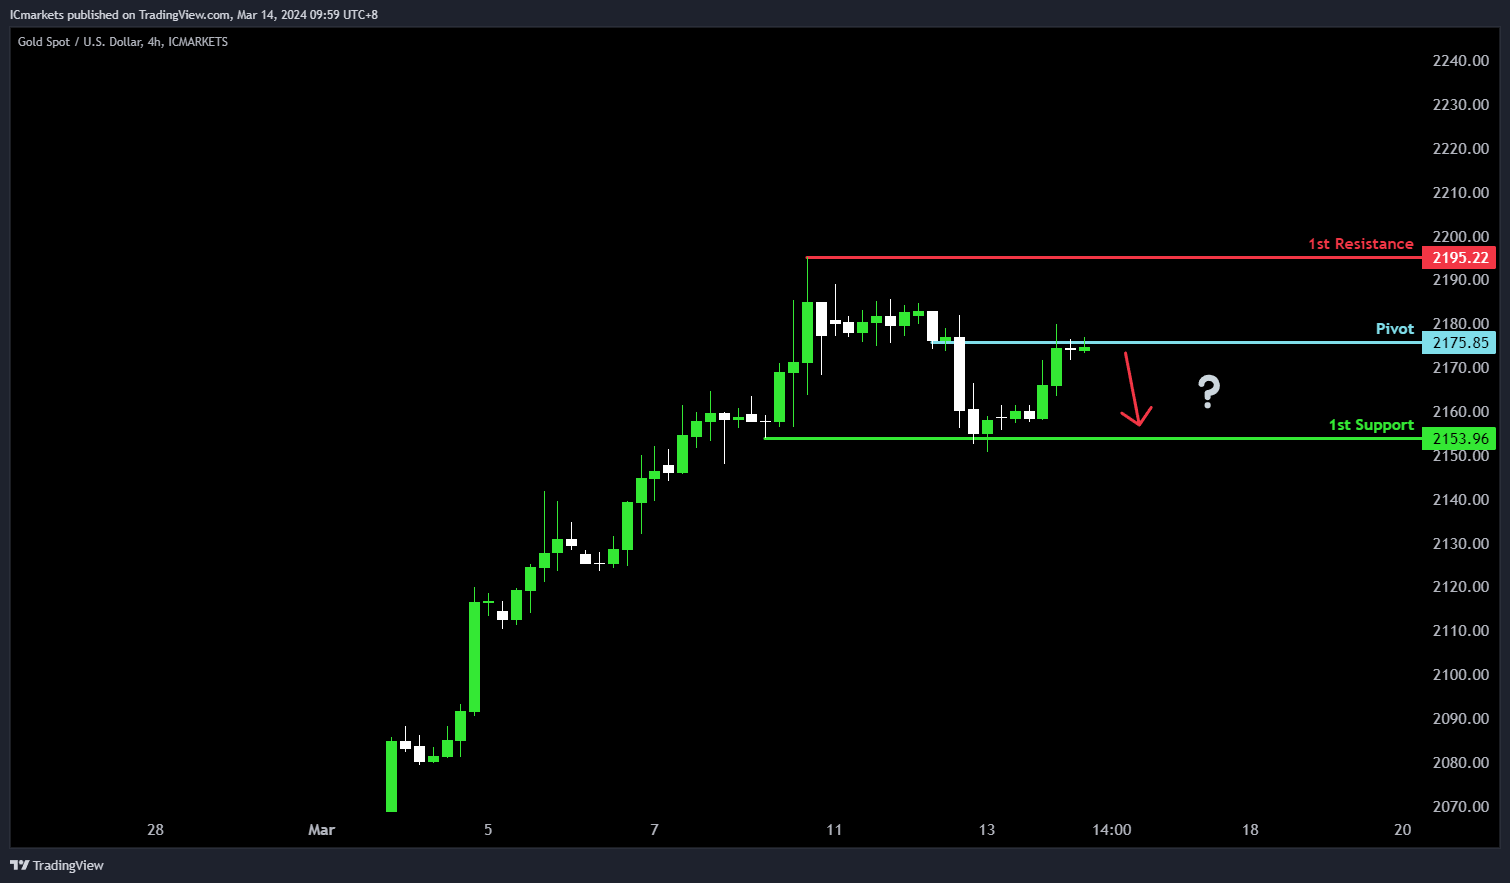
XAU/USD (GOLD):
For XAU/USD, the potential direction is bearish, despite the overall bullish momentum of the chart. There’s a possibility of a bearish reaction off the pivot level, leading to a decline towards the 1st support.
The pivot at 2175.85 is considered an overlap resistance, indicating its historical significance as a level where selling pressure may increase. Conversely, the 1st support at 2153.96 is identified as a multi-swing low support, suggesting it could attract buying interest and potentially halt the downward movement.
On the resistance side, the 1st resistance at 2195.22 is noted as a swing high resistance, indicating its historical significance as a level where selling pressure has previously emerged, potentially limiting further upward movement.