
Sample Category Title
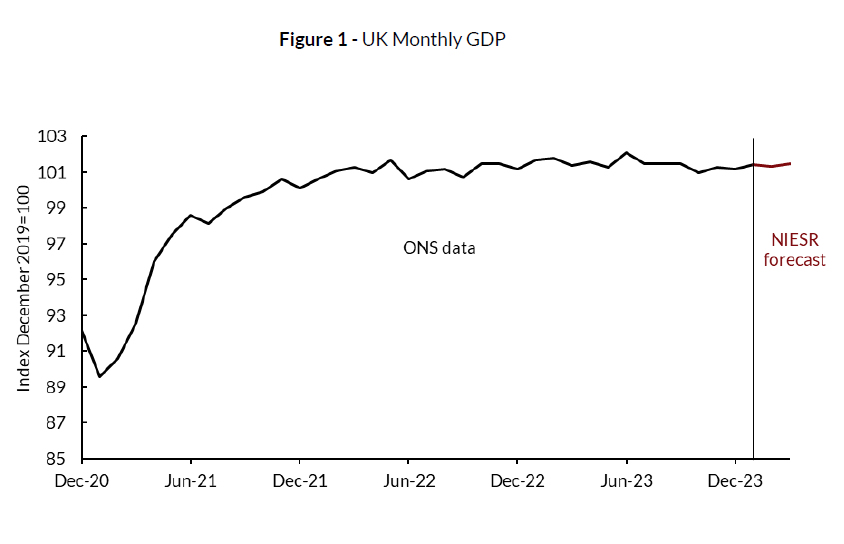
NIESR forecasts 0.3% UK GDP growth in Q1
NIESR forecast UK GDP to grow by 0.3% in Q1, aligns with a pattern of "low, but stable economic growth," suggesting a potential "turning point" for the nation after slipping into a technical recession in the latter half of 2023.
The forecast comes with a critical analysis of UK's economic stagnation, emphasizing the necessity for "structural changes" to break free from the so-called low-growth trap. The institute's recommendation underscores the importance of bolstering public investment, particularly in pivotal areas such as infrastructure, education, and health.
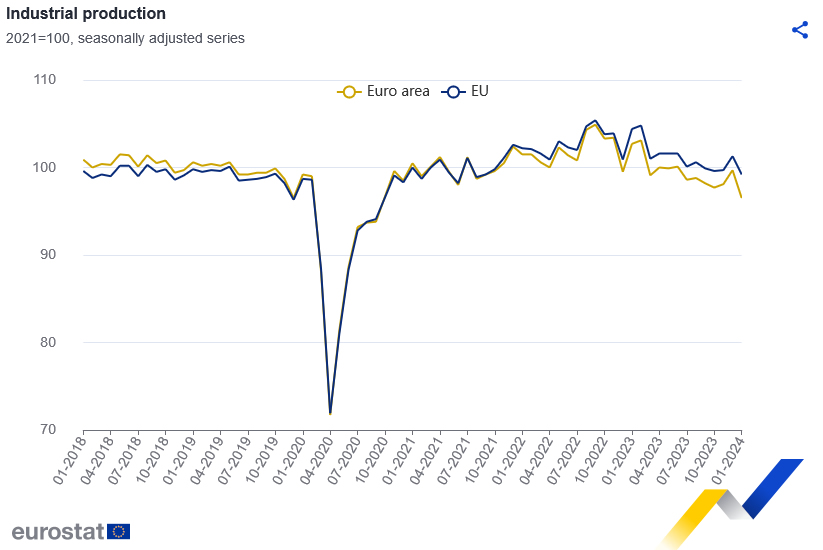
Eurozone industrial production falls -3.2% mom in Jan, EU down -2.1% mom
Eurozone industrial production fell -3.2% mom in January, much worse than expectation of -1.0% mom. Production increased by 2.6% for intermediate goods, increased by 0.5% for energy, decreased by -14.5% for capital goods, decreased by -1.2% for durable consumer goods, decreased by -0.3% for non-durable consumer goods.
EU industrial production fell -2.1% mom. Among Member States for which data are available, the largest monthly decreases were recorded in Ireland (-29.0%), Malta (-9.4%) and Estonia (-6.6%). The highest increases were observed in Poland (+13.3%), Slovenia (+10.6%) and Lithuania (+7.2%).
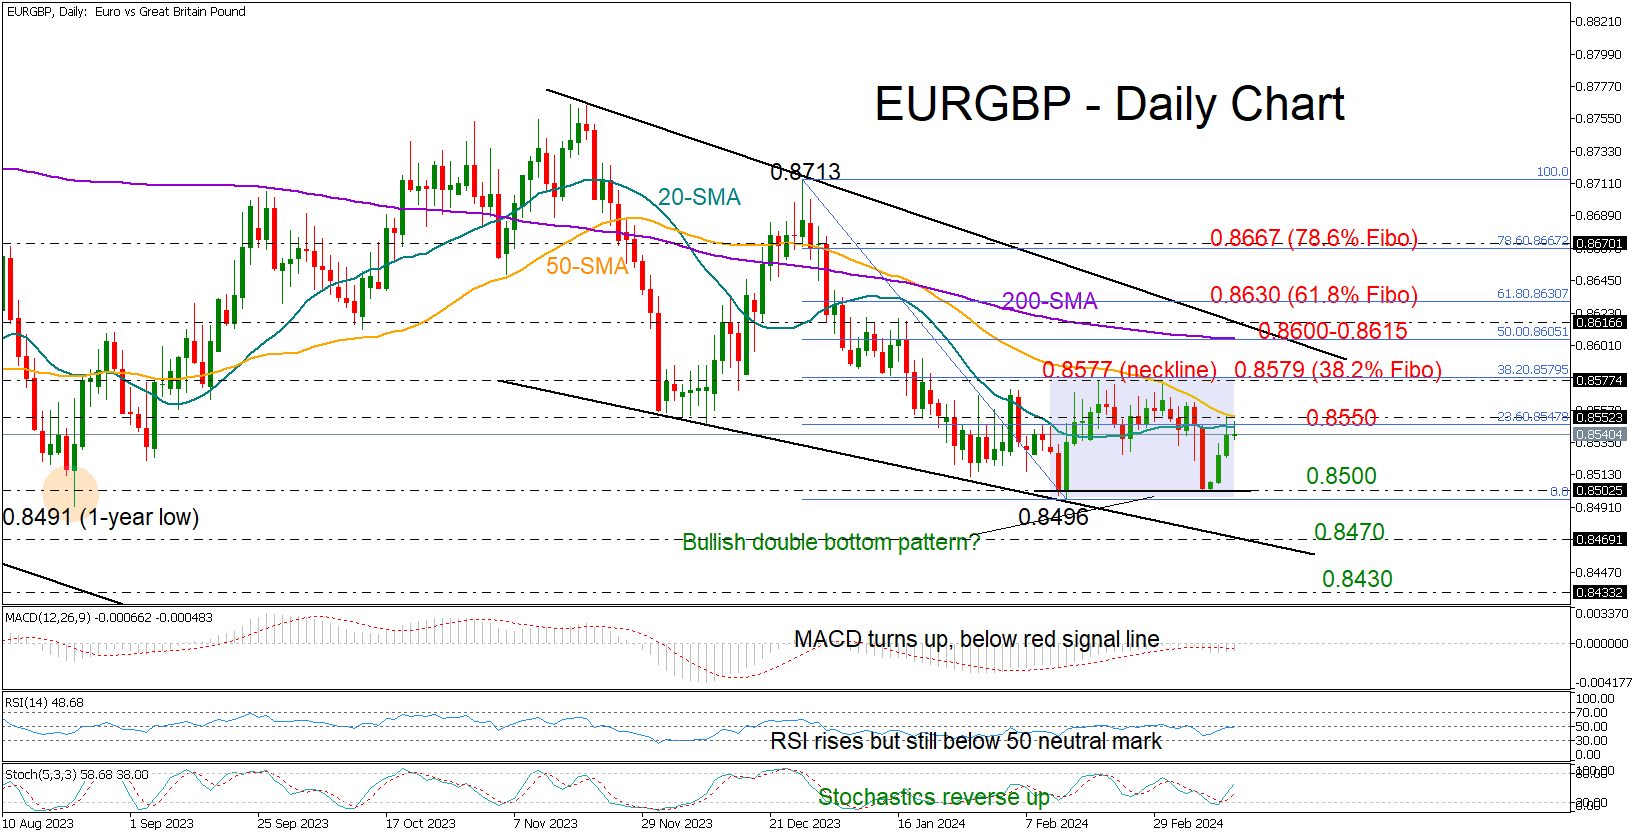
EURGBP Starts to Take a Bullish Shape
- EURGBP gets rejected near 50-day SMA after rebound
- Market structure develops into a bullish double bottom pattern
- Buyers need a rally above 0.8577 to dominate
EURGBP could not surpass its 50-day simple moving average (SMA) at 0.8553 on Tuesday. However, the bullish double bottom pattern, which started to take shape around February’s base of 0.8500, might generate buying interest in the coming sessions in hopes the pair will soon stage an upside trend reversal.
The technical indicators have turned upwards, showing some improvement in market sentiment, but the RSI still needs to surpass its 50 neutral level. Moreover, the moving averages haven’t changed trajectory.
Traders should exercise caution until the price surpasses the 50-day SMA and closes above the neckline at 0.8577, which also aligns with the 38.2% Fibonacci retracement level. In the event that the bullish scenario materializes, the pair could be propelled strongly towards the 0.8600-0.8615 area. Should the pair breach the 61.8% Fibonacci of 0.8630 too, the recovery phase could pick up steam towards 0.8670.
Alternatively, if the price remains trapped below the 50-day SMA and pulls below the 23.6% Fibonacci of 0.8545, it might again seek support near the 0.8500 floor. A downtrend resumption beneath that threshold is expected to stabilize around the descending line from November at 0.8470 and then stretch into the 0.8400-0.8430 zone last seen in August 2022. Slightly lower, the August 2022 low of 0.8340 might next attract attention.
In brief, EURGBP set a strong foothold around the 0.8500 mark, which was also a major support zone in 2023, increasing optimism that the previous downward pattern will soon come to an end. That said, traders will wait for a confirmation above 0.8577.
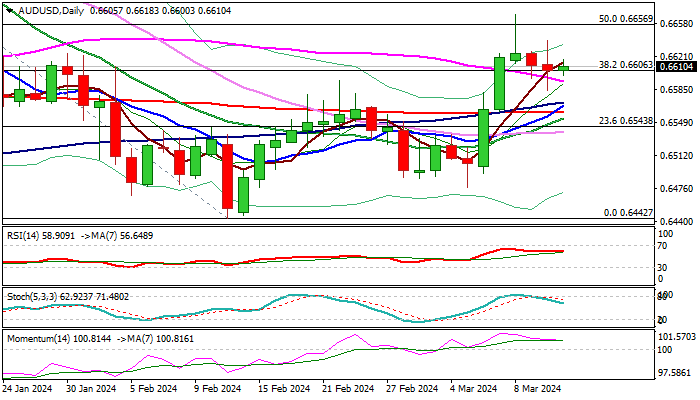
AUD/USD: Starts to Regain Traction After Shallow Pullback
AUDUSD is holding within a narrow range around 0.6600 handle on Wednesday, after the pullback in past three days started to run out of steam.
Tuesday’s long-legged Doji signaled indecision and hinting that corrective phase might be close to the end, as picture on daily chart remains bullish (strong positive momentum / MA’s in bullish setup forming multiple bull-crosses).
Near-term action stayed above descending 55DMA for the fifth straight day, adding to initial positive signals, however more evidence will be needed to signal the bottom of corrective pullback.
Repeated close above the base of falling daily cloud will be a minimum requirement, with close above Tuesday’s spike high (0.6638) to strengthen near-term structure and shift focus to the upside, for renewed attempt at key near-term barriers at 0.6667/70 (Mar 8 recovery peak / daily cloud top).
Res: 0.6638; 0.6670; 0.6707; 0.6728.
Sup: 0.6584; 0.6572; 0.6555; 0.6543.
Bitcoin Fluctuates But Keeps Its Direction
Market picture
The crypto market rose another 0.5% over the past 24 hours to $2.75 trillion. The Cryptocurrency Fear and Greed Index remained at 81 (extreme greed). But the past day was not a quiet one.
Bitcoin briefly broke above $73K in a sharp move, triggering an avalanche of stop orders that drove the price down 6.5% over the next three hours to $68.6K – precisely the level from which the last rally began on Monday.

This pullback was considered an opportunity for those looking to get in at the rally, and there appear to be quite a few. The intraday nature of the move is reminiscent of the behaviour of large institutional traders, with trading algorithms intercepting the move and retail traders often joining in. Either way, the overall trend remains bullish, and Bitcoin is climbing back towards its highs as we head into early European trading.
News background
The depth of liquidity in the bitcoin market, as measured by the value of exposures in order books within 2%, reached a record $600 million, Kaiko noted. The number of bids significantly exceeded the number of asks, suggesting profit-taking by traders as historical highs were updated. The persistence of refinancing rates near the highs suggests that demand for the asset is resilient.
BTC trading volume on spot platforms reached $51 billion, surpassing the values of the 2021 bull market. At the same time, Tether’s capitalisation reached an all-time high ($100bn).
Just two months after the launch of the first spot bitcoin ETFs in the US, the assets under management at BlackRock’s IBIT fund surpassed 200,000 BTC ($14.6 billion).
Given the pace of capital inflows into spot bitcoin ETFs, there will be a shortage of BTC supply in six months, CryptoQuant estimates. Currently, there are only 1.4 million BTC available in the market for bitcoin ETFs.
Bloomberg lowered the chances of spot Ethereum ETFs launching in May to 35% from 70%. The reduced optimism is due to the SEC’s low level of involvement in negotiations with issuers. Other challenges to a favourable verdict are the PoS mechanism, the risk of price manipulation and the recognition of the asset as a security.
The non-custodial cryptocurrency wallet MetaMask has begun testing Mastercard’s payment onchain. The joint product will be “the first truly decentralised web3 payment solution”. Users will be able to spend cryptocurrency “on everyday purchases wherever cards are accepted”.
GBP/USD: Bulls Show Resilience amid Inflation and GDP News
Yesterday important data on inflation in the United States was published. It caused a significant spike in volatility in financial markets, even though the values were in line with expectations. CPI in monthly terms: actual = 0.4%, forecast = 0.4%, a month ago = 0.3%, a year ago = 0.4%.
And today news came out about UK GDP in monthly terms, which also corresponded to expectations: fact = +0.2%, forecast = +0.2%, a month ago = -0.1%.
It is noteworthy that in both cases the first reaction was a fall in the price of GBP/USD, but then a recovery followed — this is a manifestation of the stability of demand.
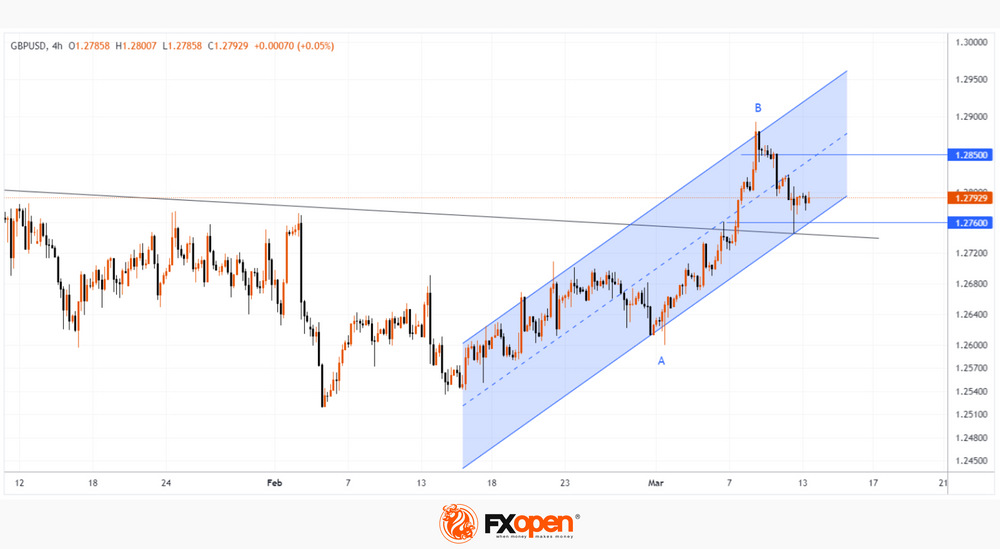
From the point of view of technical analysis of the GBP/USD chart, the market has support in the area of 1.276 from:
→ the bottom line of the ascending channel (shown in blue);
→ Fibo level 50% rollback from impulse A→B;
→ the black long-term trend line originating at the end of 2023, which previously served as resistance, but changed its role after the breakdown on March 7.
Will the bulls be able to resume the upward trend within the blue channel?
Even if attempts to implement this scenario occur, the GBP/USD chart shows that:
→ In this case, they may encounter bearish aggression, visible in sharp price declines from top B.
→ It is possible that resistance will be the level of 1.285, which served as local support on March 10-11, and in the area of which (for now) the median line of the blue ascending channel passes.
Trade over 50 forex markets 24 hours a day with FXOpen. Take advantage of low commissions, deep liquidity, and spreads from 0.0 pips. Open your FXOpen account now or learn more about trading forex with FXOpen.
This article represents the opinion of the Companies operating under the FXOpen brand only. It is not to be construed as an offer, solicitation, or recommendation with respect to products and services provided by the Companies operating under the FXOpen brand, nor is it to be considered financial advice.
Today Is an Ethereum Update. ETH/USD Is Above $4,000
An update is scheduled for the Ethereum network today, approximately at 16:55 GMT+3.
The update is called Dencun and is the biggest code change since April 2023, when the Shapella update was implemented.
Dencun aims to reduce fees on the growing array of ancillary networks running on top of Ethereum, called layer 2 (L2) “aggregates.” The changes involve “proto-dunksharding” technology, which is intended to improve the blockchain’s ability to process data from L2 networks.
It is believed that the implementation of the update will give impetus to the development of projects built on auxiliary networks. On the other hand, there is a risk of failures. Although it is worth noting that Dencun was deployed three times on test networks, and each time there were no problems.
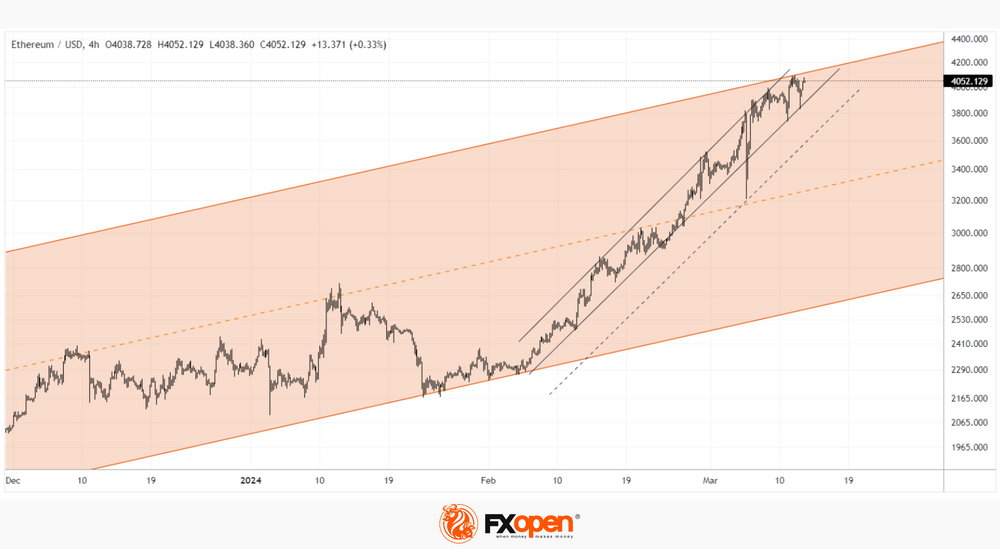
The ETH/USD chart shows that the price of Ethereum today, on the day of the update, is showing bullish behavior:
→ the price moves within the long-term ascending channel (shown in orange). Having pushed off from its lower limit in early February, the price of ETH has already reached its upper limit, which is +76% in about a month!
→ during the growth, the price formed an ascending channel (shown by black lines);
→ the price is trying to consolidate above the psychological level of USD 4,000 for Ethereum.
→ long lower shadows on the candles on March 11-12 give reason to believe that there is strong demand in the market amid news related to an important update for the development of Ethereum.
Reaching the upper boundary of the channel is an argument in favor of a consolidation scenario after a significant rally. But it is possible that using the hype, the bulls will try to storm the upper border of the channel. If successful, the area around USD 4,000 could act as an important support for ETH/USD in the future.
FXOpen offers the world's most popular cryptocurrency CFDs*, including Bitcoin and Ethereum. Floating spreads, 1:2 leverage — at your service. Open your trading account now or learn more about crypto CFD trading with FXOpen.
*At FXOpen UK and FXOpen AU, Cryptocurrency CFDs are only available for trading by those clients categorised as Professional clients under FCA Rules and Professional clients under ASIC Rules respectively. They are not available for trading by Retail clients.
This article represents the opinion of the Companies operating under the FXOpen brand only. It is not to be construed as an offer, solicitation, or recommendation with respect to products and services provided by the Companies operating under the FXOpen brand, nor is it to be considered financial advice.
ECB’s Kazaks: Inflation dragon nearly defeated, rate cuts on horizon
ECB Governing Council member Martins Kazaks likened the fight against inflation to battling a dragon, stating in a blog post, "The dragon of inflation is pinned to the ground, a little more and it will be defeated." This vivid metaphor reflects a growing confidence within ECB that the persistent inflationary pressures which have challenged Eurozone economy are finally coming under control.
Kazaks further suggested that "if the economy roughly follows" the bank's forecasts, "then the decision to start reducing interest rates could be made within the next few meetings."
Kazaks also acknowledged the delicate balance the ECB has had to maintain: the risk of premature rate cuts that could reignite inflation versus the risk of delaying rate reductions too long. However, he noted that these risks are now beginning to "level out," there is "no need to delay the rate reduction too much"
Complementing Kazaks's insights, ECB Governing Council member Francois Villeroy de Galhau told France Info radio, "We will probably cut rates in spring, and spring in Europe is from April to June 21."
"It's perhaps more probable in June — we are very pragmatic and will see depending on the data," Villeroy added.
US Dollar Strengthens Amid Inflation Data
As of Wednesday, the EUR/USD pair is hovering near 1.0925 after experiencing a volatile session, with expectations for a more subdued week ahead.
Recent statistical data highlighted higher-than-expected inflation in the US for February, prompting adjustments to predictions about the easing of monetary policy by the Federal Reserve in June.
The Consumer Price Index (CPI) rose by 0.4% month-on-month last month, aligning with expectations. Year-on-year, the indicator expanded to 3.2% from 3.1%. Core inflation in the US increased by 0.4% month-on-month, surpassing the forecast of 0.3%. From year to year, the indicator rose to 3.8% from the previous 3.7%.
While these figures did not come as a "surprise," they reaffirmed that inflation is more persistent than previously thought. Specific details of the reports offer local hope for improvement, although it is clear overall that the situation could be more comfortable for the Fed to make significant decisions.
The market interpreted these developments favourably for the US dollar, shifting investor preferences towards it.
Market focus is squarely on the Fed's June meeting, with the March and May sessions attracting less interest. The Fed will likely require more statistical information by then.
As indicated by public data, investor expectations suggest a 69% chance of a rate cut in June, down from 71% earlier in the week.
In what would be the most optimistic forecast, the Fed will probably manage to cut rates only three times this year.
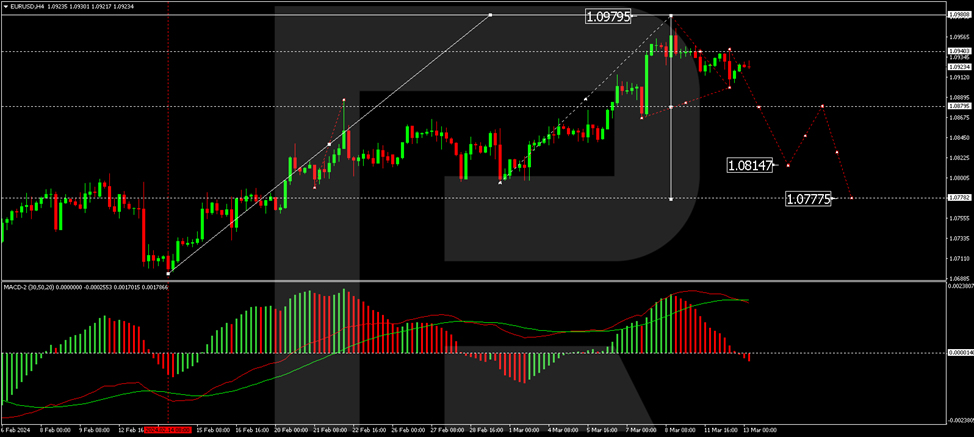
Technical Analysis of EUR/USD
On the H4 chart, EUR/USD is forming the first wave of decline towards 1.0777. The first structure of this wave and its correction have been completed. Today, we will consider the likelihood of breaking the minimum of the first structure and continuing the development of the wave to the local target level of 1.0815. The MACD indicator confirms this scenario, with its signal line above zero and a sharply decreasing histogram, indicating the continuation of the downtrend.
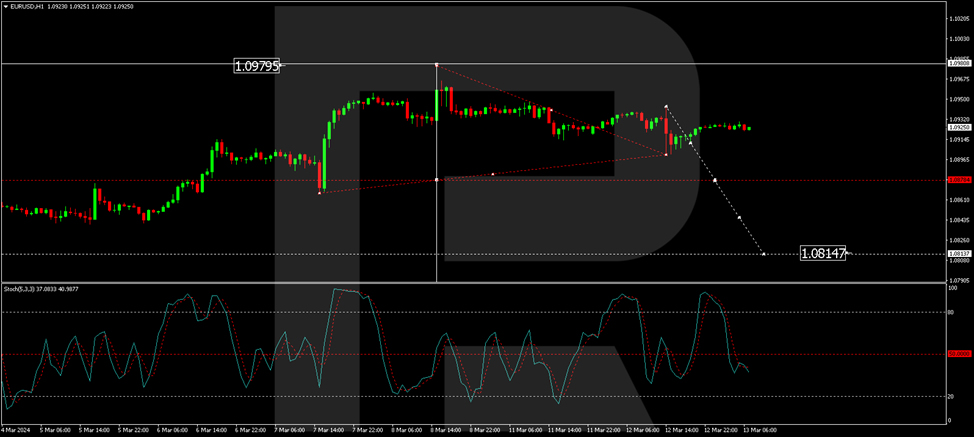
On the H1 chart, EUR/USD has formed the first wave of a decline structure to 1.0900 and a correction to 1.0939. The market has essentially delineated a consolidation range around the level of 1.0939. Today, a decline to the lower boundary of this range is expected. With a breach of 1.0900, a further decline to 1.0880 is anticipated, with the trend potentially continuing to 1.0815. The Stochastic oscillator confirms this scenario, with its signal line below the 50 mark, expecting a continuation of the decline towards 20.
GBP/USD Recovers While EUR/GBP Aims More Upsides
GBP/USD is attempting a fresh increase from the 1.2745 zone. EUR/GBP is gaining pace and might extend its rally above the 0.8550 zone.
Important Takeaways for GBP/USD and EUR/GBP Analysis Today
- The British Pound is attempting a recovery above the 1.2780 zone against the US Dollar.
- There was a break above a key bearish trend line with resistance at 1.2790 on the hourly chart of GBP/USD at FXOpen.
- EUR/GBP started a fresh increase above the 0.8535 resistance zone.
- There is a major bullish trend line forming with support near 0.8535 on the hourly chart at FXOpen.
GBP/USD Technical Analysis
On the hourly chart of GBP/USD at FXOpen, the pair started a fresh decline from the 1.2890 zone. The British Pound traded below the 1.2820 zone against the US Dollar.
A low was formed near 1.2746 and the pair is now attempting a recovery wave. There was a break above the 23.6% Fib retracement level of the downward move from the 1.2893 swing high to the 1.2746 low.
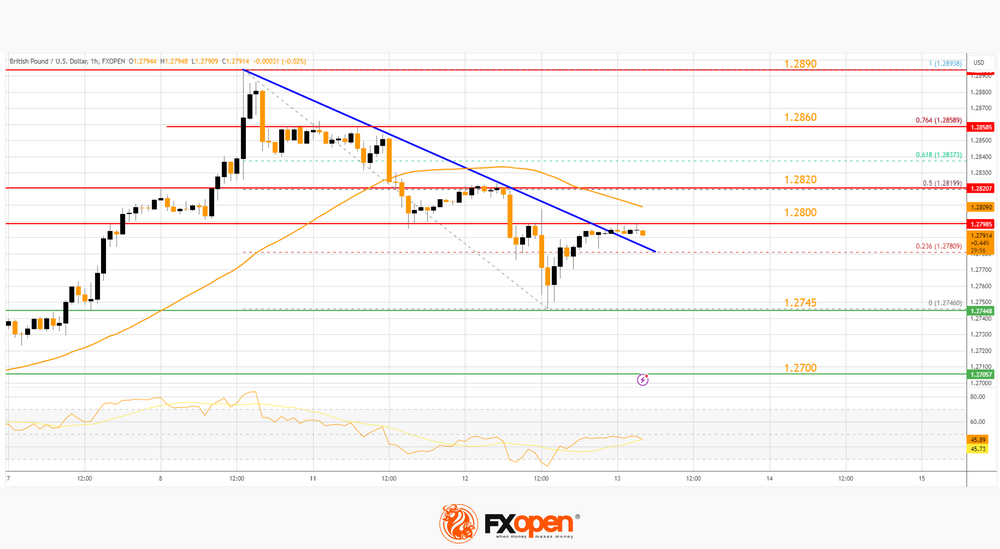
There was a break above a key bearish trend line with resistance at 1.2790, but the pair is still below the 50-hour simple moving average. On the upside, the GBP/USD chart indicates that the pair is facing resistance near 1.2800.
The next major resistance is near the 1.2820 level or the 50% Fib retracement level of the downward move from the 1.2893 swing high to the 1.2746 low. If the RSI moves above 50 and the pair climbs above 1.2820, there could be another rally. In the stated case, the pair could rise toward the 1.2890 level or even 1.2920.
On the downside, there is a major support forming near 1.2745. If there is a downside break below the 1.2745 support, the pair could accelerate lower. The next major support is near the 1.2700 zone, below which the pair could test 1.2665. Any more losses could lead the pair toward the 1.2550 support.
EUR/GBP Technical Analysis
On the hourly chart of EUR/GBP at FXOpen, the pair started a fresh increase from the 0.8500 zone. The Euro traded above the 0.8525 level to move into a positive zone against the British Pound.
The EUR/GBP chart suggests that the pair settled above the 50-hour simple moving average and 0.8535. There was a clear move above the 50% Fib retracement level of the downward move from the 0.8562 swing high to the 0.8503 low.
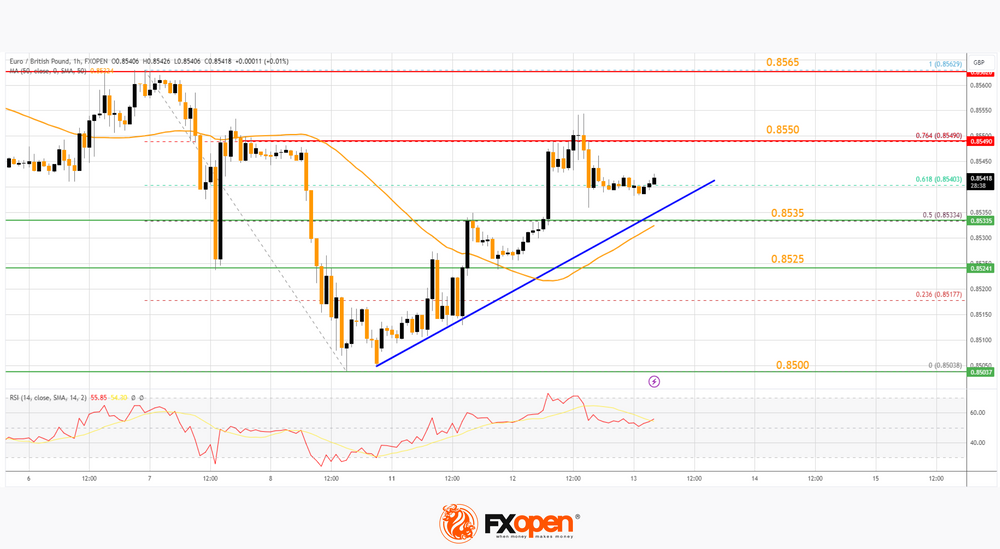
Immediate resistance is near 0.8550 or the 76.4% Fib retracement level of the downward move from the 0.8562 swing high to the 0.8503 low.
The next major resistance for the bulls is near the 0.8565 zone. A close above the 0.8565 level might accelerate gains. In the stated case, the bulls may perhaps aim for a test of 0.8600. Any more gains might send the pair toward the 0.8650 level in the coming days.
Immediate support sits near a major bullish trend line or 0.8535. The next major support is near the 0.8525 zone. A downside break below the 0.8525 support might call for more downsides.
In the stated case, the pair could drop toward the 0.8500 support level. Any more losses might send the pair toward the 0.8460 level in the near term.
Trade over 50 forex markets 24 hours a day with FXOpen. Take advantage of low commissions, deep liquidity, and spreads from 0.0 pips. Open your FXOpen account now or learn more about trading forex with FXOpen.
This article represents the opinion of the Companies operating under the FXOpen brand only. It is not to be construed as an offer, solicitation, or recommendation with respect to products and services provided by the Companies operating under the FXOpen brand, nor is it to be considered financial advice.