Sample Category Title
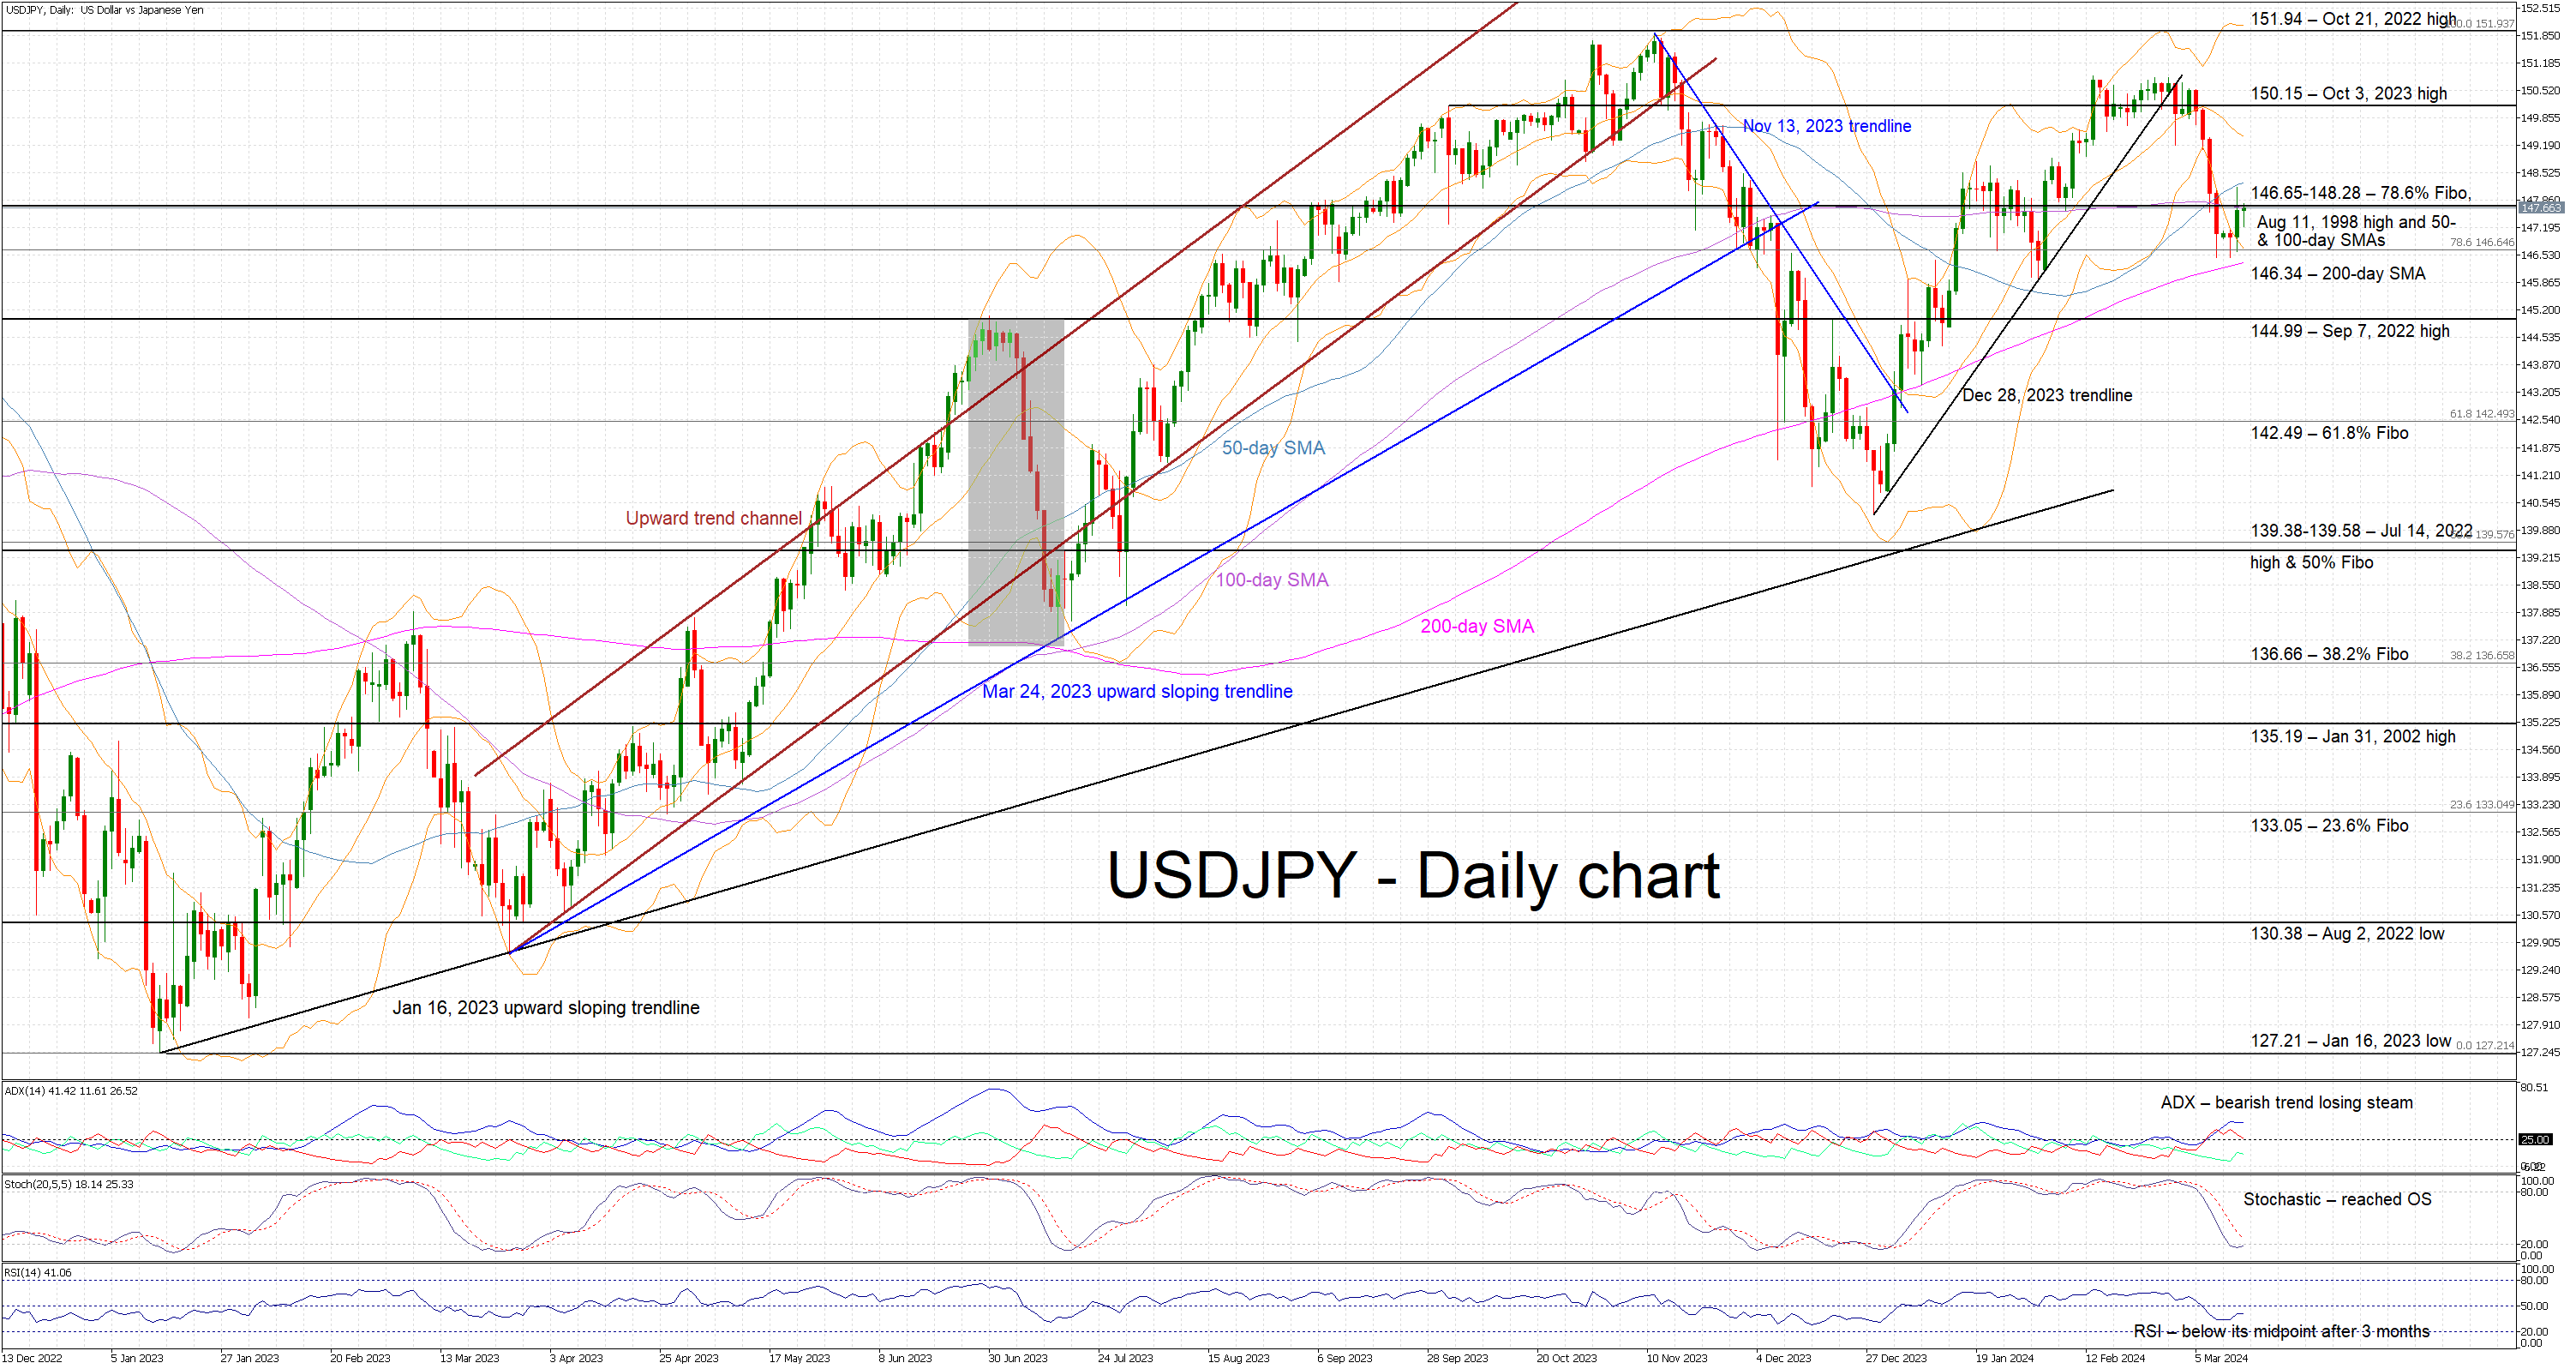
USDJPY Stuck Inside a Key Range
- USDJPY trades sideways in anticipation of next week’s key events
- USDJPY’s correction halted a tad above the 200-day SMA
- Momentum indicators support the bearish trend but with less conviction
USDJPY is trying to record a green candle today as it tests the resistance set by the 146.65-148.28 range. The correction from the late February highs halted at the 200-day simple moving average (SMA) with market participants potentially positioning for the key events ahead, which include wage talk results and next week’s central bank meetings.
In the meantime, the momentum indicators remain mostly supportive of the recent correction. More specifically, the Average Directional Movement Index (ADX) is trading sideways, above the 25 threshold, and thus signalling a weakening bearish trend in USDJPY. Similarly, the RSI has dropped below its 50-midpoint for the first time in more than 3 months, but it appears unable to record a lower low. More importantly, the stochastic oscillator has reached its oversold (OS) territory and maintains a good gap from its moving average.
Should the bulls regain confidence, they could try to lead USDJPY above the 146.65-148.28 range and towards the October 3, 2023 high at 150.15. If successful, they could then stage a rally towards the October 21, 2022 high at 151.94 and gradually open the door to a new 30-year high.
On the flip side, the bears are keen to retake market control and finally break below the 146.65-148.28 area, which is populated by the 78.6% Fibonacci retracement of the October 21, 2022 - January 16, 2023 downtrend, the August 11, 1998 high, and the 50- and 100-day simple moving averages (SMAs). Even lower, the bears could push USDJPY towards the September 7, 2022 high at 144.99 level, provided they manage to overcome the support set by the 200-day SMA at 146.34.
To sum up, USDJPY bulls are attempting to recover part of their recent losses with the market’s attention firmly on the next key market events.
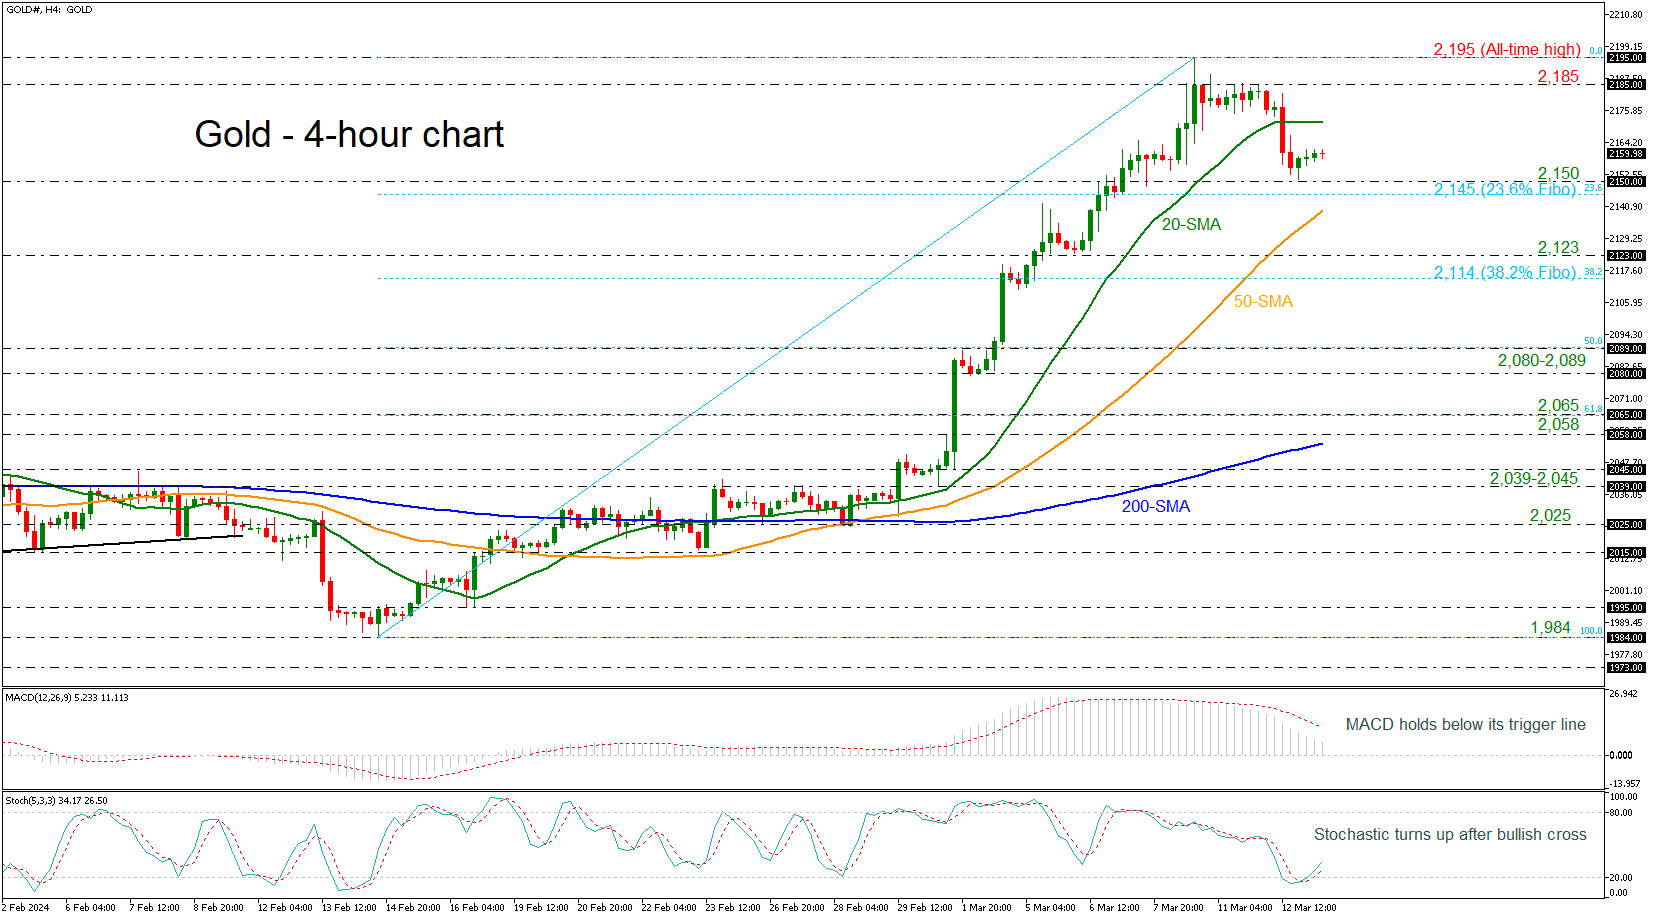
Gold Advances Again After Rebound Off 2,150
Gold prices rebounded off the 2,150 support level after creating a bearish correction from the strong rally towards the fresh all-time high of 2,195 on Friday in the 4-hour chart.
The technical oscillators are showing some contradicting signs as the MACD is losing momentum beneath its trigger line. However, the stochastic is gaining some momentum following the bullish crossover within the %K and %D lines in the oversold territory.
If the market continues to the upside, then the market could meet immediate resistance at the flat 20-period simple moving average (SMA) at 2,171 before challenging the crucial 2,185 bar. Even higher, the record peak of 2,195 may halt bullish movements.
On the flip side, a dive below the 2,150 support and the 23.6% Fibonacci retracement level of the upward wave from 1,984 to 2,195 at 2,145 could send the price until the 50-period SMA at 2,139. Steeper decreases could open the door for the 2,123 region and the 38.2% Fibonacci of 2,114.
All in all, the yellow metal is strongly bullish despite the latest downside move in the 4-hour chart. A move below the 200-period SMA may switch the outlook to a more neutral one.
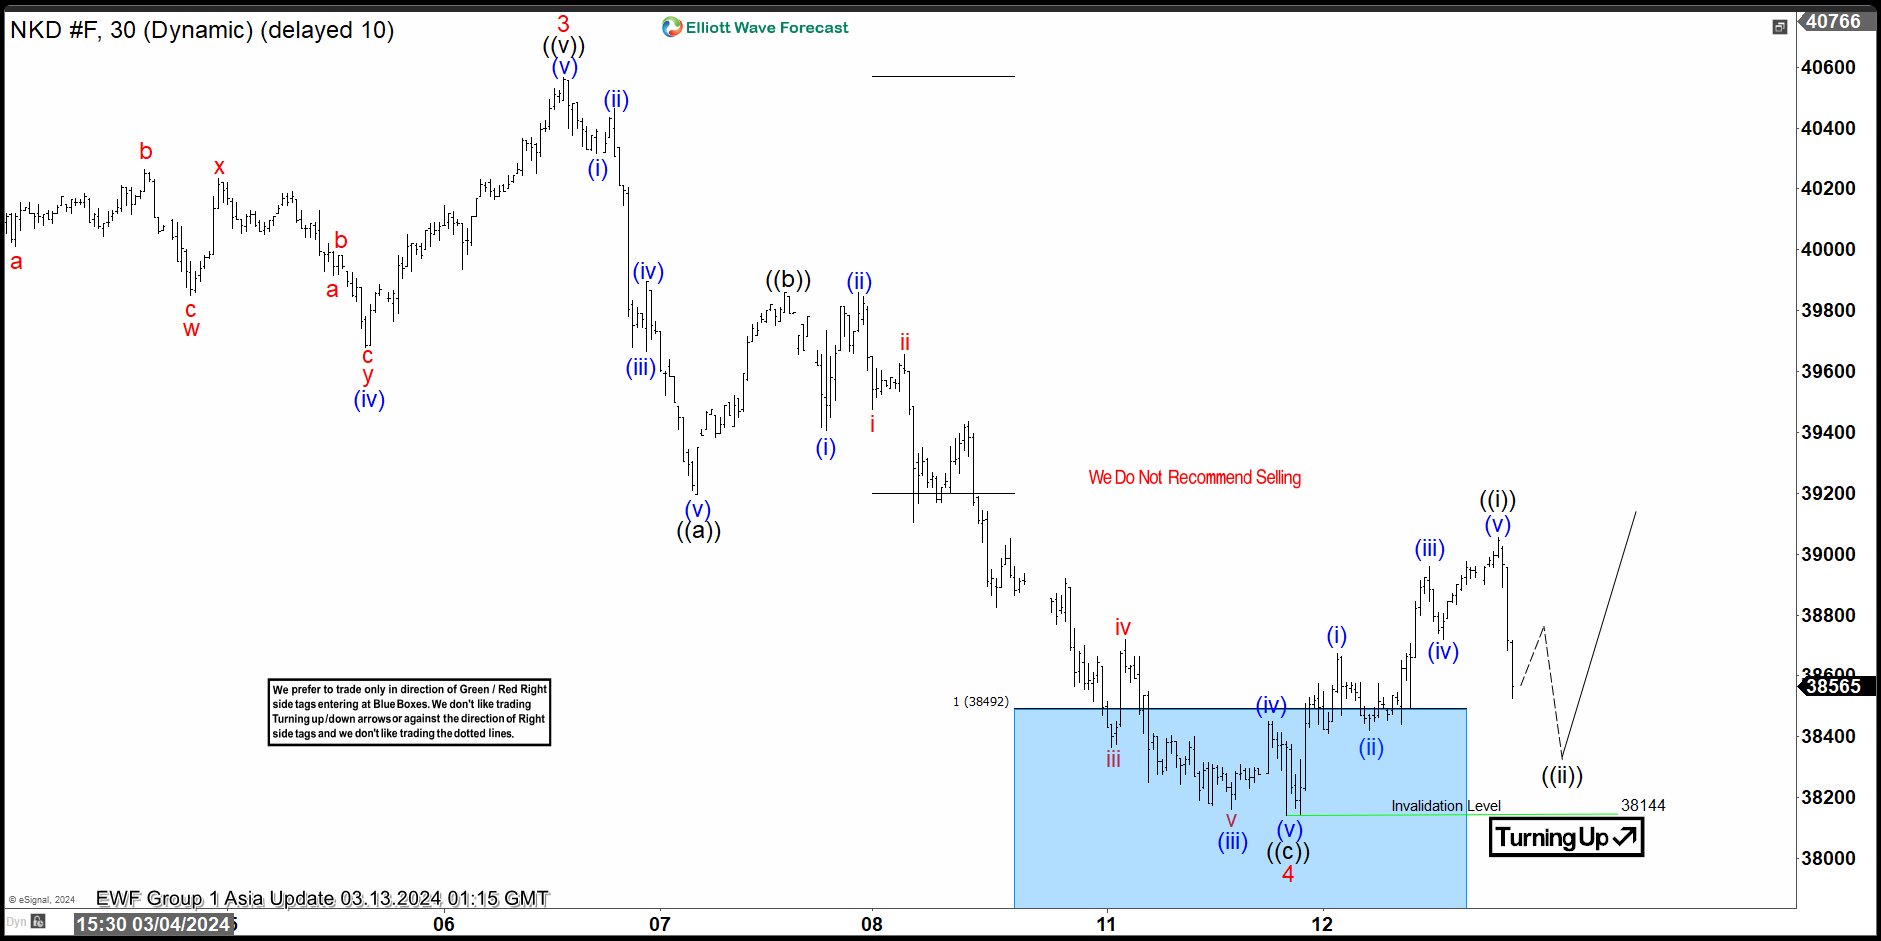
Nikkei (NKD_F) Elliott Wave View: Reacted from the Blue Box
Nikkei NKD_F ended an impulse structure at 40565 high and we called wave 3 and the index started a wave 4 pullback. Down from wave 3, wave (i) ended at 40315 and wave (ii) ended at 40465. Wave (iii) lower ended at 39665. Rally in wave (iv) ended at 39895. The market resumes lower in wave (v) ended 39195 and completed wave ((a)) in higher degree. NKD did a bounce from this levels reaching at 39860 and turning down strongly. At 39860 it ended wave ((b)) correction.
Down from wave ((b)), wave (i) ended at 39405 and wave (ii) ended at 39860. Wave (iii) lower ended at 38160. Rally in wave (iv) ended at 38450. Index resumes lower into the blue box area completing wave (v) at 38140 low. Also completed wave ((c)) and wave 4 in higher degree as a zigzag Elliott Wave structure. Currently, NKD has reacted from the blue box developing an impulse as wave ((i)). As price action stays above 38140 low, we expect to end wave ((ii)) correction and then continuing with the rally or see 3 swings higher at least.
Nikkei (NKD_F) 30 Minutes Elliott Wave Chart
Nikkei (NKD_F) Elliott Wave Video
https://www.youtube.com/watch?v=e7giVP2L89k
Risks for Next Week’s FOMC Meeting Seem Tilted to the Hawkish Side
Markets
US Treasuries sold off yesterday after sticky February US CPI inflation data. Headline inflation accelerated from 0.3% M/M in January to 0.4% M/M with core inflation sticking at that 0.4% M/M pace for a second month running. The Fed’s so-called super-core inflation which zooms in on core services excluding shelter, rose by 0.5% M/M. Although down from a superhot 0.85% in January, that’s still more than double the pre-pandemic pace. Annual paces for topline, core and supercore CPI were 3.2%, 3.8% and 4.3% respectively. Yesterday’s data don’t give Fed Chair Powell the longed-for additional evidence that inflation is on a sustained path to the 2% target. The US Federal Reserve’s data-dependence even risks backfiring in coming months. Base effects make it very likely that headline inflation will return and hold near and above levels of 3.5% Y/Y until at least September. Sticky services inflation and the delayed impact on shelter costs provide a solid “floor” for core CPI. US Treasury yields rose by 5 to 6 bps across the curve yesterday with the belly underperforming the wings. They closed near intraday highs with a tailing $39bn 10-yr Note auction failing to offer some counterweight. The market implied probabilities of a 25 bps rate cut in April and June fell to 15% and 77% respectively. Risks for next week’s FOMC meeting seem tilted to the hawkish side. The dollar initially profited from the interest rate support with EUR/USD sliding from 1.0940 to 1.09. The pair eventually closed unchanged on the back of bullish risk sentiment. Another massive performance by the likes of Nvidia outweighed the inflation scare, pushing major US benchmarks to daily gains of up to 1.54% for Nasdaq.
Japanese bond futures felt some late selling pressure this morning as a wide range of labour unions announced robust pay increases. The Japanese Association of Metal, Machinery and Manufacturing Workers secured an average 5.32%. Rengo, the nation’s biggest union federation, announces first results on Friday. The Japanese yen at USD/JPY 147.70 for now fails to profit further from BoJ normalization bets. Today’s eco calendar is empty apart from a $22bn 30-yr Bond auction. We expect yesterday’s CPI-vibes to remain in play, resulting in an underperformance of US Treasuries and an advantage for the dollar. Especially as more ECB governors, including hawks like ECB Wunsch, center around a June rate cut.
News & Views
The Hungarian forint yesterday weakened to just below EUR/HUF 400. Both political tensions between the government and the central bank and ongoing discussions with the EU on the release of blocked funds are at play. With respect to the former, the Hungarian central bank repeated that new legislation to widen the Supervisory Board’s control will hurt its independence. “While on the surface the current central bank bill is about other tasks, it serves the sole purpose of influencing NBH management's decisions related to basic tasks and other decisions within the scope of NBH independence”. The government indicates that it only serves activities that are unrelated to monetary policy, including the MNB’s investments. On the second subject, a legal Committee of the European Parliament voted to take the European Commission to court as it contests the Commission’s decision in December to release €10.2bn of blocked EU funds. The EP President has the final say whether to proceed with the lawsuit.
The Bank of Spain in its quarterly update upwardly revised its growth outlook. Spanish GDP growth is now only expect to slow from 2.5% in 2023 to 1.9% this year (was 1.6%). This also brings growth more in line with the 2% forecast of the government. The upward revision of Spanish growth contrasts with the ECB last week downwardly revising 2024 EMU growth from 0.8% to 0.6%. The BoS expects 1.9% growth in 2025 and 1.7% growth in 2025. Unemployment is expected to decline further from 12.1% in 2023 to 11.6% this year and to gradually ease further to 11.3% in 2026. Inflation is set to decline over the projection horizon, falling from an average of 3.4% in 2023 to 2.7%, 1.9% and 1.7%, in 2024, 2025 and 2026. The main factors behind the revision this year are lower energy prices and the partial extension of some measures to cope with the inflationary episode. The BoS also cited the contribution of foreign workers to the labour market and European relief funds as factors supporting Spanish economic growth.
Hotter-Than-Expected Inflation Will Likely Call for Caution at Next Week’s FOMC Meeting
Inflation in the US accelerated, not only in terms of monthly headline figure but everywhere, both core and headline, and both yearly and monthly figures came in hotter-than-expected. While gasoline prices counted among the major drivers of monthly inflation, shelter, electricity, used cars, air travel and clothes remained the major drivers of inflation on a yearly basis. That was not an encouraging CPI read. The US 2-year yield spiked past 4.60% on fear that the Federal Reserve (Fed) may not be able to cut the rates as soon as we think it will, and the 10-year advanced to 4.17% after the sale of a $39 billion worth of 10-year notes. The US dollar index made an attempt past the 103 level, and major currencies retreated against a broadly stronger greenback on softer dovish Fed expectations. The EURUSD tested the 1.09 level and gold fell to $2150 per ounce.
Key takeaway: Hotter-than-expected inflation will likely call for caution at next week’s FOMC meeting and get the Fed members to sound cautious about the timing and the number of rate hikes that they have in mind for this year. Happily, we don’t need to speculate much as the new dot plot is due as soon as next week. For now, the June cut expectation remains the base-case scenario – with a slightly lower 66% assessed to it after yesterday’s inflation update, and the Fed is expected to cut three times before the end of the year. But don’t dream rosy, the Fed members will probably sound cautious about the risk of inflation uptick.
Big caps can’t care less
Stock markets shrugged off the bad vibes from the unideal CPI data in a record time. The S&P500 fell as a kneejerk reaction to a hotter-than-expected inflation data but losses remained very short-lived, and the index advanced to a fresh record instead on narrative that, yes, inflation was hotter-than-expected, but it could’ve been worse.
Of course, if we function that way, we don’t need data anymore. So let’s admit that yesterday's stock market reaction to the data was unusual and irrational. The bullish trend is too strong to let go of and FOMO – fear of missing out - the AI rally is the major driver of the big-cap stocks right now.
On the other hand, inflation is not necessarily bad news for AI-related stocks. Higher inflation coupled with decreased pricing power for companies means stronger efforts to cut costs. And there is nothing better than turning to AI to cut costs effectively without necessarily giving up productivity. In this context, AI could be a hedge against an extended period of above-target inflation. But does that justify the 7% jump in Nvidia’s stock price yesterday?
BoE doves reassured
Sterling fell against the dollar as softer-than-expected jobs data in the UK reassured the Bank of England (BoE) doves and boosted the expectation of rate cuts this year to almost three following the data. Cable fell below 1.2750 yesterday but the pair has rebounded since and is ready to test the 1.28 resistance this morning as the BoE is not in a rush to start cutting rates either. Released this morning, GDP numbers came in line with expectations while construction output rose more than expected. The positive data should temper the pound selloff.
Wages, wages
In Japan, all eyes are on wages negotiations as many Japanese unions disclose their pay deals with employers this week. Yen traders are closely watching the news as any pickup in wages should boost inflation expectations and get the Bank of Japan (BoJ) to exit the negative rates sooner rather than later. So far, it seems that big corporations meet wage demands. Japan’s biggest union group Rengo will give its initial count on Friday, and it’s expected to secure a pay rise of above 4% - a thing that has not happened in three decades due to a sticky deflation in Japan. Any positive surprise on the wages front should boost the BoJ hawks and the speculation that the BoJ could hike rates as soon as next week. The USDJPY saw support below the 147 this week but the downside risks prevail. I believe that the BoJ will more likely to give a strong hint that it will hike rates than hike next week. But no one knows how the BoJ will hike rates. Would they rather surprise the market or prepare investors? It’s been so long since the BoJ last hiked rates.
US crude rebounds
US crude tested the 200-DMA to the upside as the API data printed a 5.5-mio barrel fall in US oil inventories last week. OPEC raised its economic outlook for the year and said that oil demand will increase by 2.25mbpd this year and by 1.85mbpd next year. That was unchanged from their previous forecast. Still, oil bulls remained timid above the 200-DMA and the barrel of US crude is trading below this level this morning. A delay in Fed cuts could further reinforce offers above $80pb level.
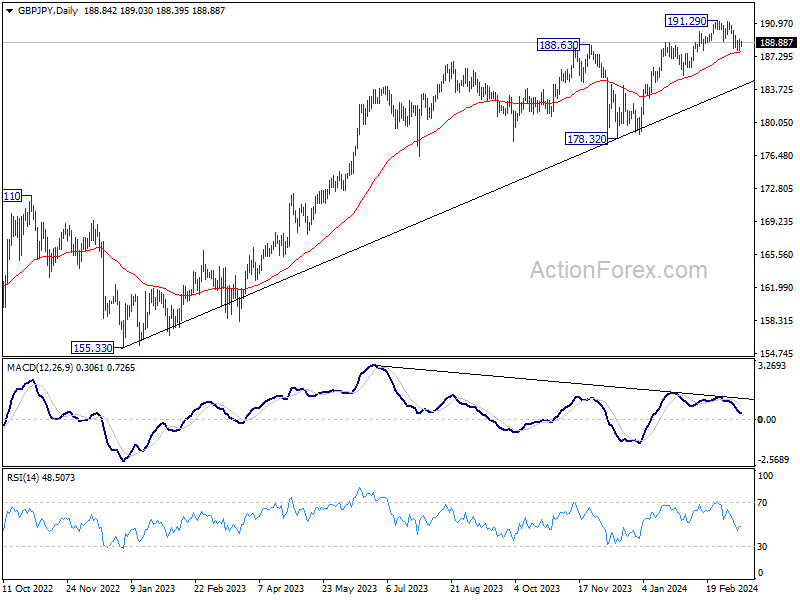
GBP/JPY Daily Outlook
Daily Pivots: (S1) 188.20; (P) 188.70; (R1) 189.42; More.....
Intraday bias in GBP/JPY stays neutral for the moment. On the downside, below 187.94 will resume the decline from 191.29 to 38.2% retracement of 178.32 to 191.29 at 186.33. Sustained break there will raise the chance of larger scale correction and target 61.8% retracement at 183.27. On the upside, though, firm break of 55 4H EMA (now at 189.33) will retain near term bullishness and bring retest of 191.29 high.
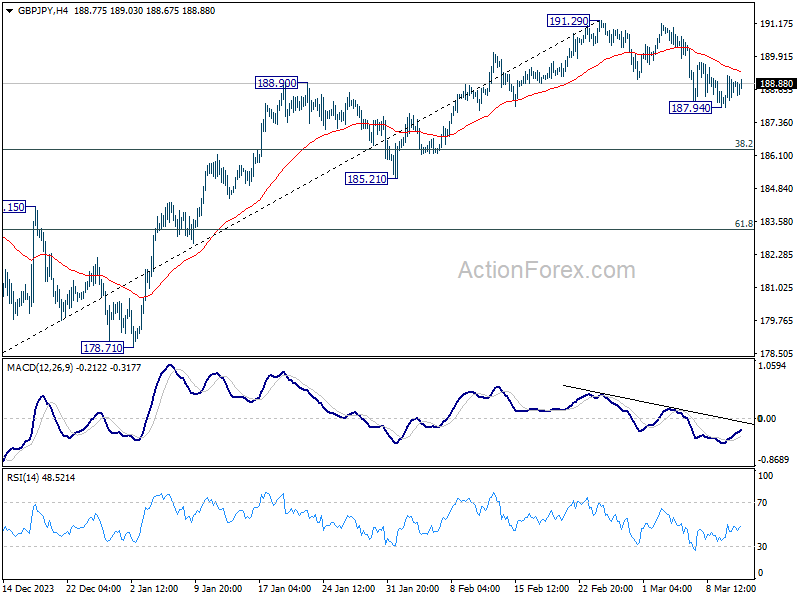
In the bigger picture, up trend from 123.94 (2020 low) is in progress. Medium term outlook will stay bullish as long as 178.32 support holds. Next target is 195.86 long term resistance (2015 high).
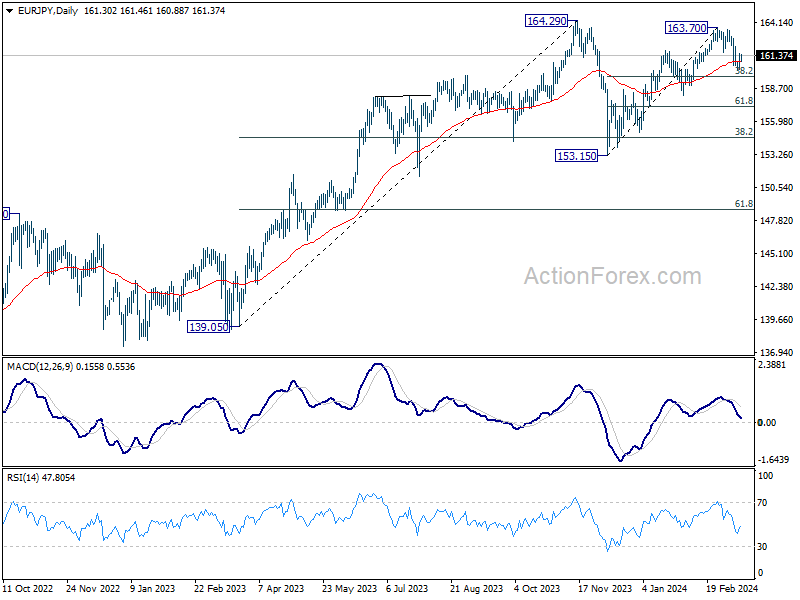
EUR/JPY Daily Outlook
Daily Pivots: (S1) 160.54; (P) 161.08; (R1) 161.88; More...
Intraday bias in EUR/JPY stays neutral at this point. On the downside, below 160.20 will resume the fall from 163.70 to 38.2% retracement of 153.15 to 163.70 at 159.66. Sustained break there will indicate that fall from 163.70 is reversing whole rise from 153.13, and target 61.8% retracement at 157.18. On the upside, though, above 162.16 minor resistance will retain near term bullishness, and bring retest of 163.70.
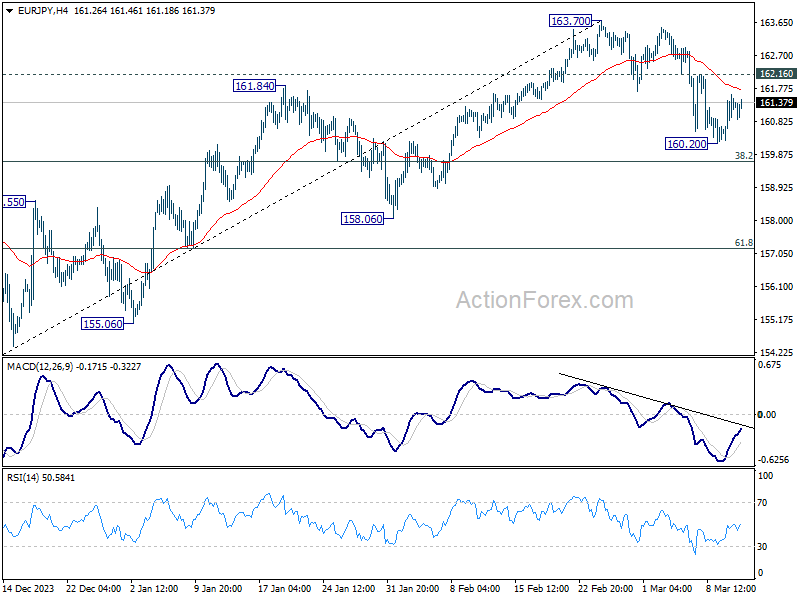
In the bigger picture, price actions from 164.29 medium term top are seen as a correction to rise from 139.05 which could still be extending. As long as 148.38 resistance turned support holds (2022 high), larger up trend from 114.42 (2020 low) is expected to resume through 164.29 at a later stage. Next target would be 169.96 (2008 high).
EUR/GBP Daily Outlook
Daily Pivots: (S1) 0.8521; (P) 0.8538; (R1) 0.8557; More...
Intraday bias in EUR/GBP remains neutral as it's still bounded in range trading. On the downside decisive break of 0.8491/7 support zone will confirm larger down trend resumption and target 0.8464 projection level first. Nevertheless, firm break of 0.8577 will turn bias back to the upside for stronger rebound.
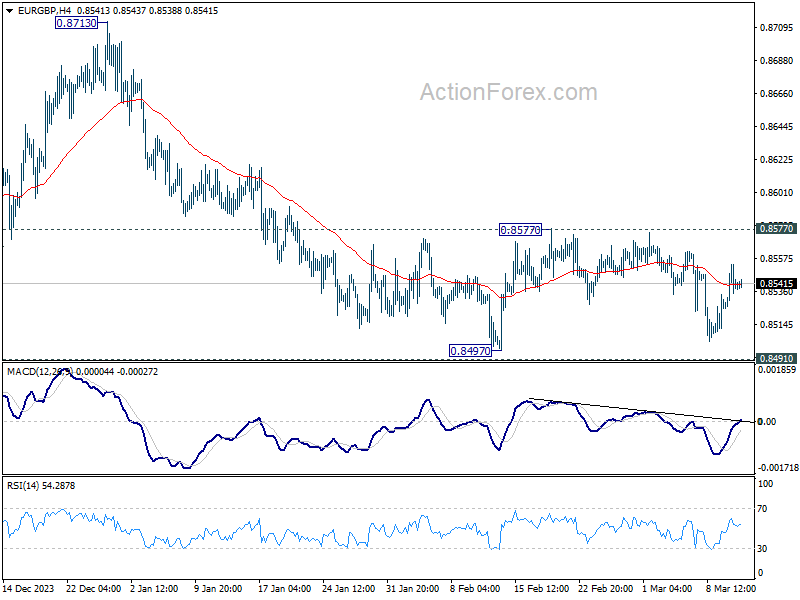
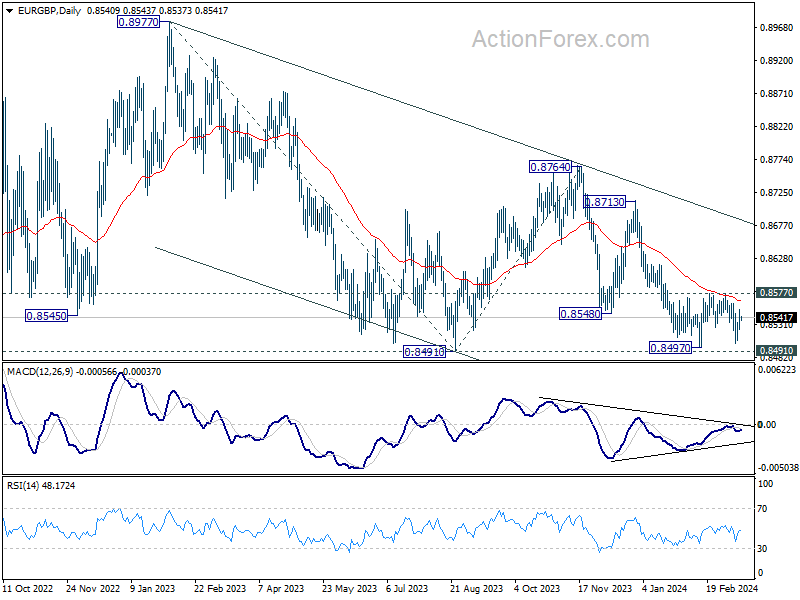
In the bigger picture, fall from 0.8764 is seen as another leg in the whole down trend from 0.9267 (2022 high). Outlook will stay bearish as long as 0.8713 resistance holds. Break of 0.8491 will target 61.8% projection of 0.8977 to 0.8491 from 0.8764 at 0.8464.
EUR/AUD Daily Outlook
Daily Pivots: (S1) 1.6494; (P) 1.6528; (R1) 1.6573; More...
Intraday bias in EUR/AUD remains neutral as range trading continues. On the downside, decisive break of 1.6450 support will argue that whole rebound from 1.6127 has completed with three waves up to 1.6742 already. Near term outlook will be turned bearish for 1.6127 again, to extend the whole corrective pattern from 1.7062. Nevertheless, strong rebound from current level, followed by break of 1.6606 minor resistance, will retain near term bullishness and bring retest of 1.6742.
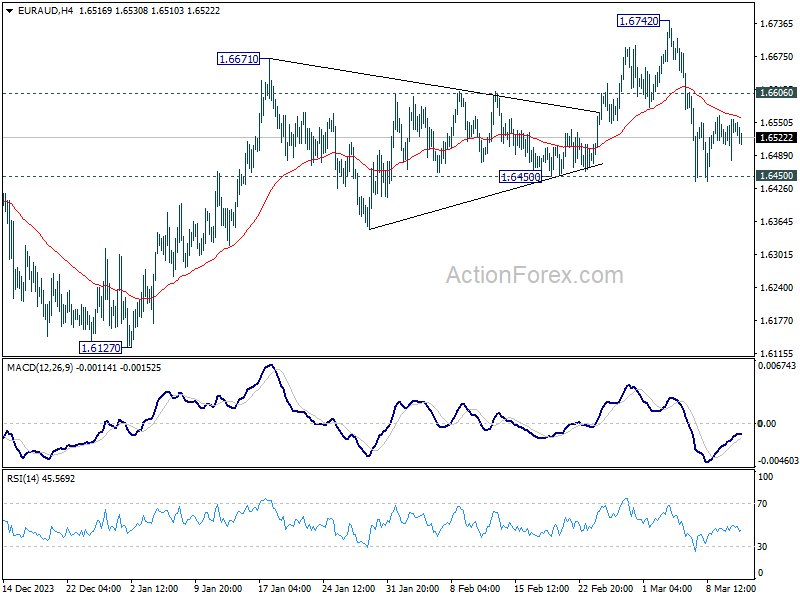
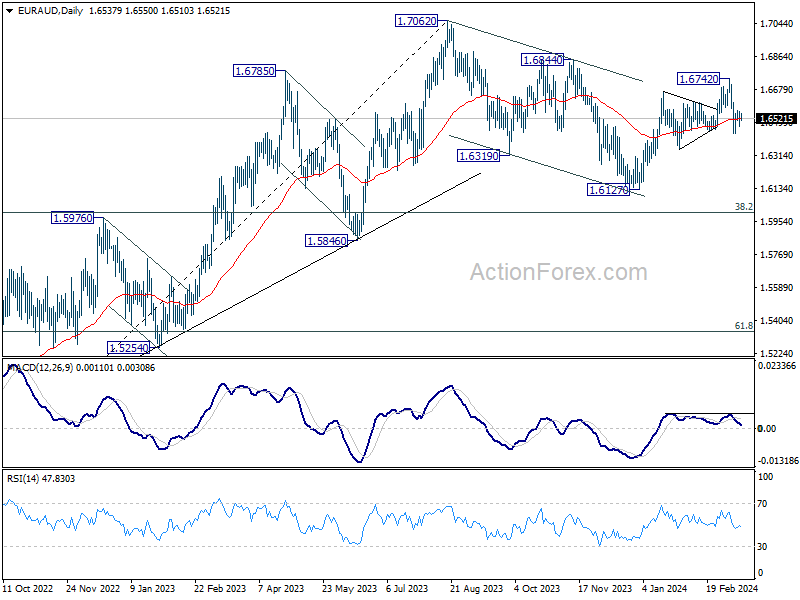
In the bigger picture, fall from 1.7062 medium term top is seen as a correction to the up trend from 1.4281 (2022 low). Break of 1.6844 resistance will argue that this up trend is ready to resume through 1.7062 high. In case of another fall, strong support should be seen around 1.5846 and 38.2% retracement of 1.4281 to 1.7062 at 1.6000 to bring rebound.
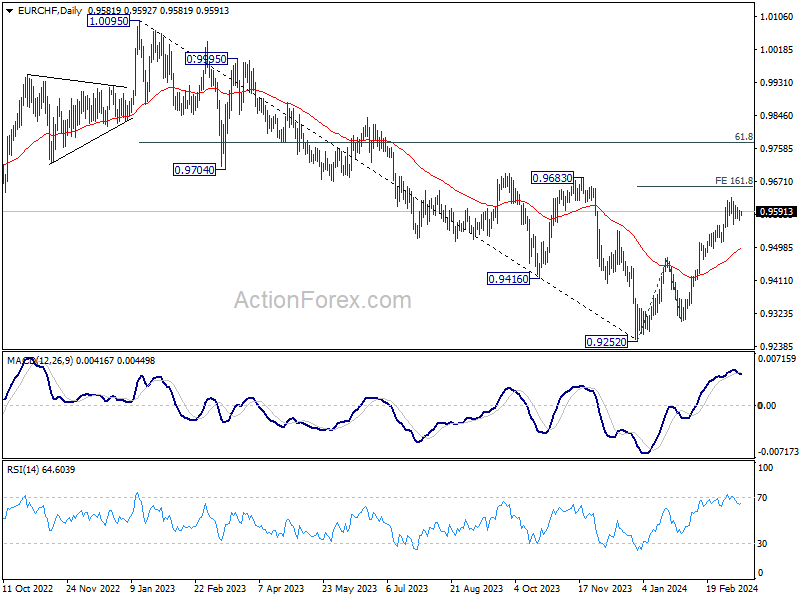
EUR/CHF Daily Outlook
Daily Pivots: (S1) 0.9572; (P) 0.9585; (R1) 0.9598; More...
EUR/CHF is still extending the consolidation from 0.9630 and intraday bias stays neutral. As long as 0.9510 support holds, further rally is still expected. On the upside, break of 0.9630 will resume the rise from 0.9252 and target 161.8% projection of 0.9252 to 0.9471 from 0.9304 at 0.9658 next. However, considering bearish divergence condition in 4H MACD, firm break of 0.9510 will turn bias back to the downside for deeper fall.
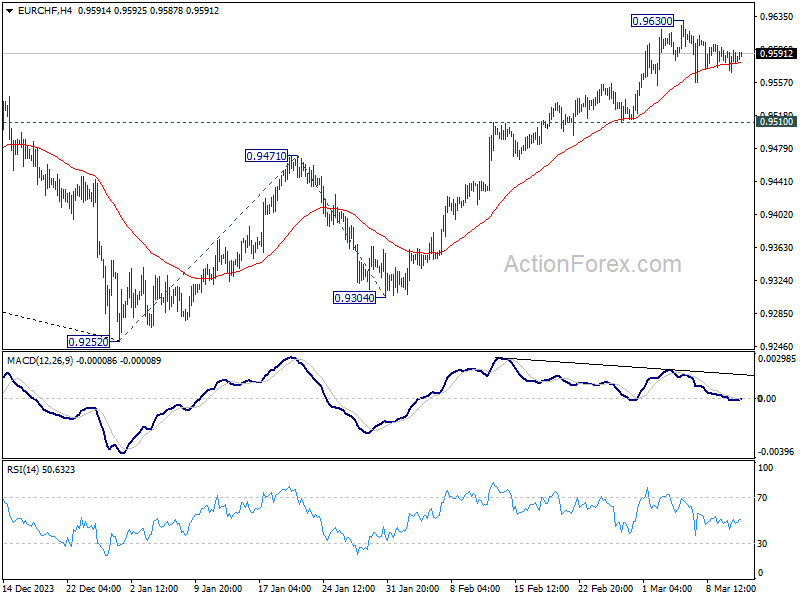
In the bigger picture, as long as 0.9683 resistance holds, rebound from 0.9252 are seen as a corrective move only. Larger down trend is expected to resume through 0.9252 after the correction completes. However, firm break of 0.9683 and sustained trading above 55 W EMA (now at 0.9620) will argue that 0.9252 is already a medium term bottom. Stronger rise would then be seen 61.8% retracement of 1.0095 to 0.9252 at 0.9773 and above.