
Sample Category Title
Gold Regains Traction After a Shallow Pullback as June Rate Cut Expectations Remain in Play
Gold price rose on Wednesday, reversing a part of Tuesday’s 1.1% drop, sparked by hotter-than-expected US inflation data, which temporarily cooled expectations for rate cut in June.
Fresh gains suggest that markets believe, after digesting the data, that elevated inflation won’t have stronger negative impact on current expectations for the start of monetary policy easing.
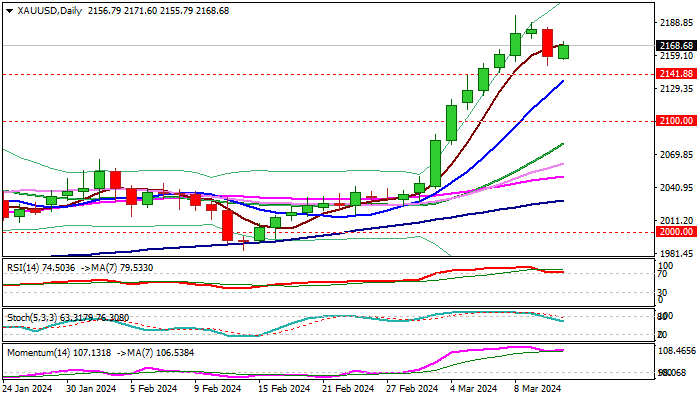
Tuesday’s drop found ground above the initial support at $2141 (former record high of Dec 4), adding to signals of shallow correction before bulls regain control, as overall technical picture is firmly bullish.
Fresh recovery needs daily close above $2170 zone (5DMA / near 50% retracement of $2195/$2150 pullback) to validate renewed bulls and signal higher low at $2150.
However, strong rally in past three weeks when the metal gained over 8%, may prompt traders to collect some profits, keeping the possibility of deeper correction on the table.
Res: 2178; 2188; 2195; 2200.
Sup: 2150; 2141; 2136; 2114.
Sunset Market Commentary
Markets:
The ECB released a statement on the changes to the operational framework for implementing monetary policy. In the new framework (cf infra), the ECB will provide liquidity through a mix of instruments including the main refinancing operations (MRO’s), new structural longer-term refinancing operations and a structural portfolio of securities. However, the deposit rate facility will remain the main instrument to steer the monetary policy stance . For now, the announcement has little impact on money and bond markets. There were no eco data to guide trading in US and EMU today. Over the previous days, several ECB members indicated that the ECB was coming closer to the point where it can start cutting rates. Bank of France governor Villeroy recently indicated that the ECB could cut rates in spring, with the ECB having upcoming meetings in April and June. Villeroy keeps a data-dependent approach but today clarified that June is probably more likely, again aligning with the guidance from ECB Lagarde at the press conference last week. The June guidance is currently putting a floor for EMU yields with German yields in technical trading rising 1-2 bps. Similar dynamics on US interest rate markets. The 0.4% monthly CPI inflation pace (February), suggests that there is no room for the Fed to turn softer in its policy assessment/dots at next week’s policy meeting. On the contrary. US yields maintain yesterday’s gain even adding another 2-3 bps. European equities still succeed some catching-up gains after yesterday’s rally on WS (Eurostoxx 50 +0.5%). US indices take a breather, but are still holding within reach of recent peak levels.
In most major FX cross rates, volatility remains (very) low with little directional momentum. DXY eases marginally (102.85). The euro beats the dollar on points (EUR/USD 1.0935). The yen slightly underperforms the dollar even as anecdotic evidence suggests a rather strong outcome of Japanese wage negotiations (USD/JPY 147.9 from 147.7). Sterling is losing slightly further ground against the euro, with EUR/GBP again hovering near the 0.855 pivot. After a soft UK labour market report yesterday, the January monthly GDP (0.2% M/M) and production data were not strong enough to give sterling additional momentum. The potential test of the key EUR/GBP 0.85/0.8493 support is called off, at least for now. A return above 0.858 is needed to put the pair again in more neutral territory.
News & Views:
The ECB announced its new framework to steer short-term money market rates in line with monetary policy decisions as the Eurosystem balance sheet normalizes. The central bank will continue steering monetary policy rate by adjusting the deposit rate. Short-term money market rates are expected to evolve in vicinity of the deposit rate. Main refinancing operations (MRO’s) and longer-term refinancing operations (LTRO’s) continue to be conducted through fixed-rate tenders with full allotment against broad collateral. In a later stage, new structural LTRO’s and a structural portfolio of securities will be introduced taking into account legacy bond holdings. On September 18, the ECB will narrow the 50 bps spread between the main refinancing rate and the deposit rate to 15 bps by lowering the MRO rate by 35 bps. The spread between the MRO rate and the marginal lending facility will remain unchanged at 25 bps. The reserve ratio for determining banks’ minimum reserve requirements remains unchanged at 1%. The remuneration of minimum reserves remains unchanged at 0%. The Governing Council will review the key parameters of the operational framework in 2026 and stands ready to adjust the design and parameters of the framework earlier, if necessary.
EMU industrial production decreased by 3.2% M/M in January according to first estimates from Eurostat. Details showed declines in capital goods (-14.5% M/M), durable consumer goods (-1.2%) and non-durable consumer goods (-0.3%) while energy (+0.5% M/M) and intermediate goods (+2.6% M/M) increased. In Y/Y-terms, productions fell by 6.7%.
XAUUSD: In Bearish Correction With Key Levels on H4
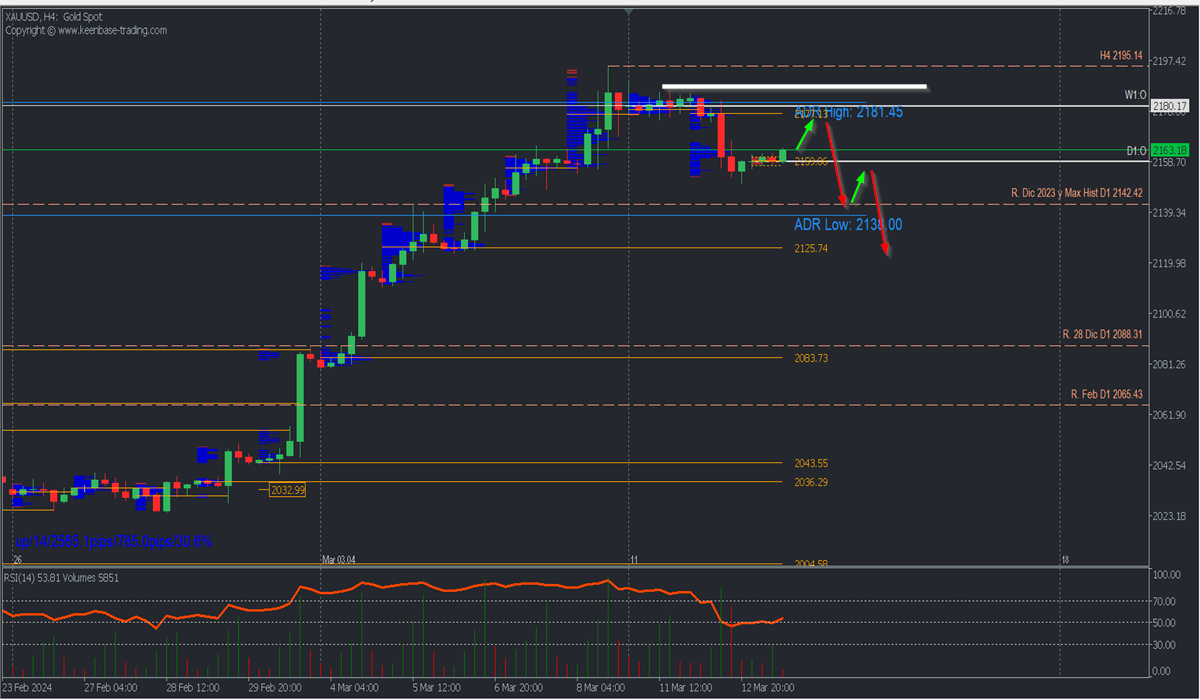
- Bullish scenario: Intraday buys above 2160.00 with TP: 2171 and TP2: 2177, with S.L. below 2155.00 or at least 1% of account capital*. Apply trailing stop.
- Bearish scenario: Sells below 2177 with TP1: 2150, TP2: 2142, and 2126 with S.L. above 2185 or at least 1% of account capital*.
Scenario from the H4 chart:
The trend remains bullish, but a correction has started, which could extend as long as prices stay below the last selling zone.
The price corrects below 2200 after reaching a historic high on Friday at 2195.14, leaving a selling zone after the weekly opening around 2177, where the price is expected to return in search of liquidity, and where it is expected that bears will reactivate to extend sales towards the level 2142.42 and the next buying zone at the uncovered POC* 2125.74.
This bearish scenario will be invalidated if prices decisively break the selling zone above 2180, demonstrating the renewed strength of the bulls to seek a new historic high above 2195.14.
The RSI indicator maintains its position in positive territory after bouncing from the midpoint, so the ascent accompanied by decreasing vertical volume and subsequent break of the midpoint with higher volume will be favourable signals supporting the current short-term bearish idea.
*Uncovered POC: POC = Point of Control: It is the level or zone where the highest volume concentration occurred. If there was a bearish movement from it previously, it is considered a selling zone and forms a resistance zone. On the other hand, if there was a bullish impulse previously, it is considered a buying zone, usually located at lows, thus forming support zones.
**Consider this risk management suggestion
**It is very important that risk management is based on capital and traded volume. Therefore, a maximum risk of 1% of the capital is recommended. It is suggested to use risk management indicators such as Easy Order.
Gold: Correction is Fuel for Growth
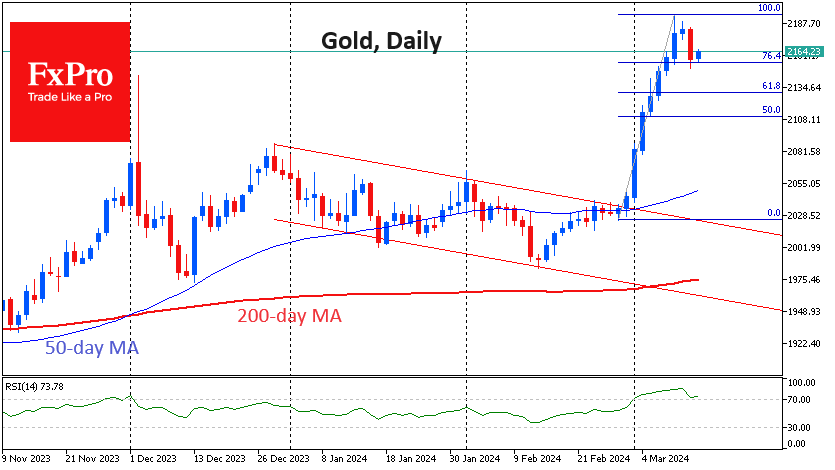
Gold lost over 1% on Tuesday, its first daily decline after nine days of gains, six of which were all-time highs.
Signs of consolidation were already evident on Monday and Tuesday, which began with a moderate decline, accelerated by the release of US inflation data. While the rush out of risk assets on this news was very short-lived, the sell-off in gold was more sustained but did not go beyond a short-term fixation.
A number of factors suggest that this is a corrective pullback rather than a reversal.
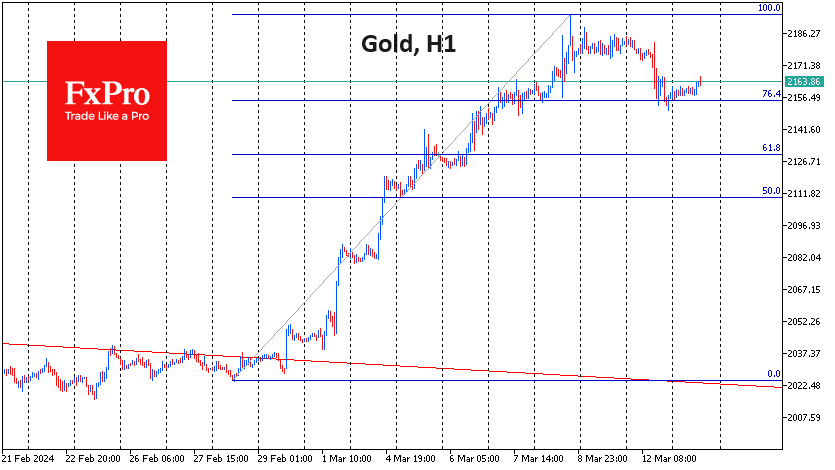
Firstly, the sell-off has come to an end near $2150, where there was a consolidation at the end of last week before the latest upside momentum. This level also coincides with the 76.4% Fibonacci retracement of the $175 rally of the last fortnight, when gold broke out of a bearish trading range. Such shallow corrective pullbacks are a sign of a strong bull market.
Second, gold’s weakness is not supported by a general decline in risk appetite. Bitcoin briefly lost 6.5% during Tuesday’s sell-off, but by Wednesday morning, it was already at all-time highs. As I write this, the Dollar Index has given back all the gains from the CPI release. The S&P500 closed at a new high on Tuesday, and the European indices are moving further into their all-time high territory on Wednesday. The correlation between European indices and gold has become very high since the second half of December.
Separately, we note the break of multi-month resistance in copper and the rise in oil, pointing to increased risk appetite, which is also favourable for gold.
All of this suggests that we may have seen a quick recharge of the bulls yesterday, allowing them to build up liquidity – fuel for further buying and renewal of all-time highs.
GBP/USD Shrugs as UK Economy Shows Slight Growth
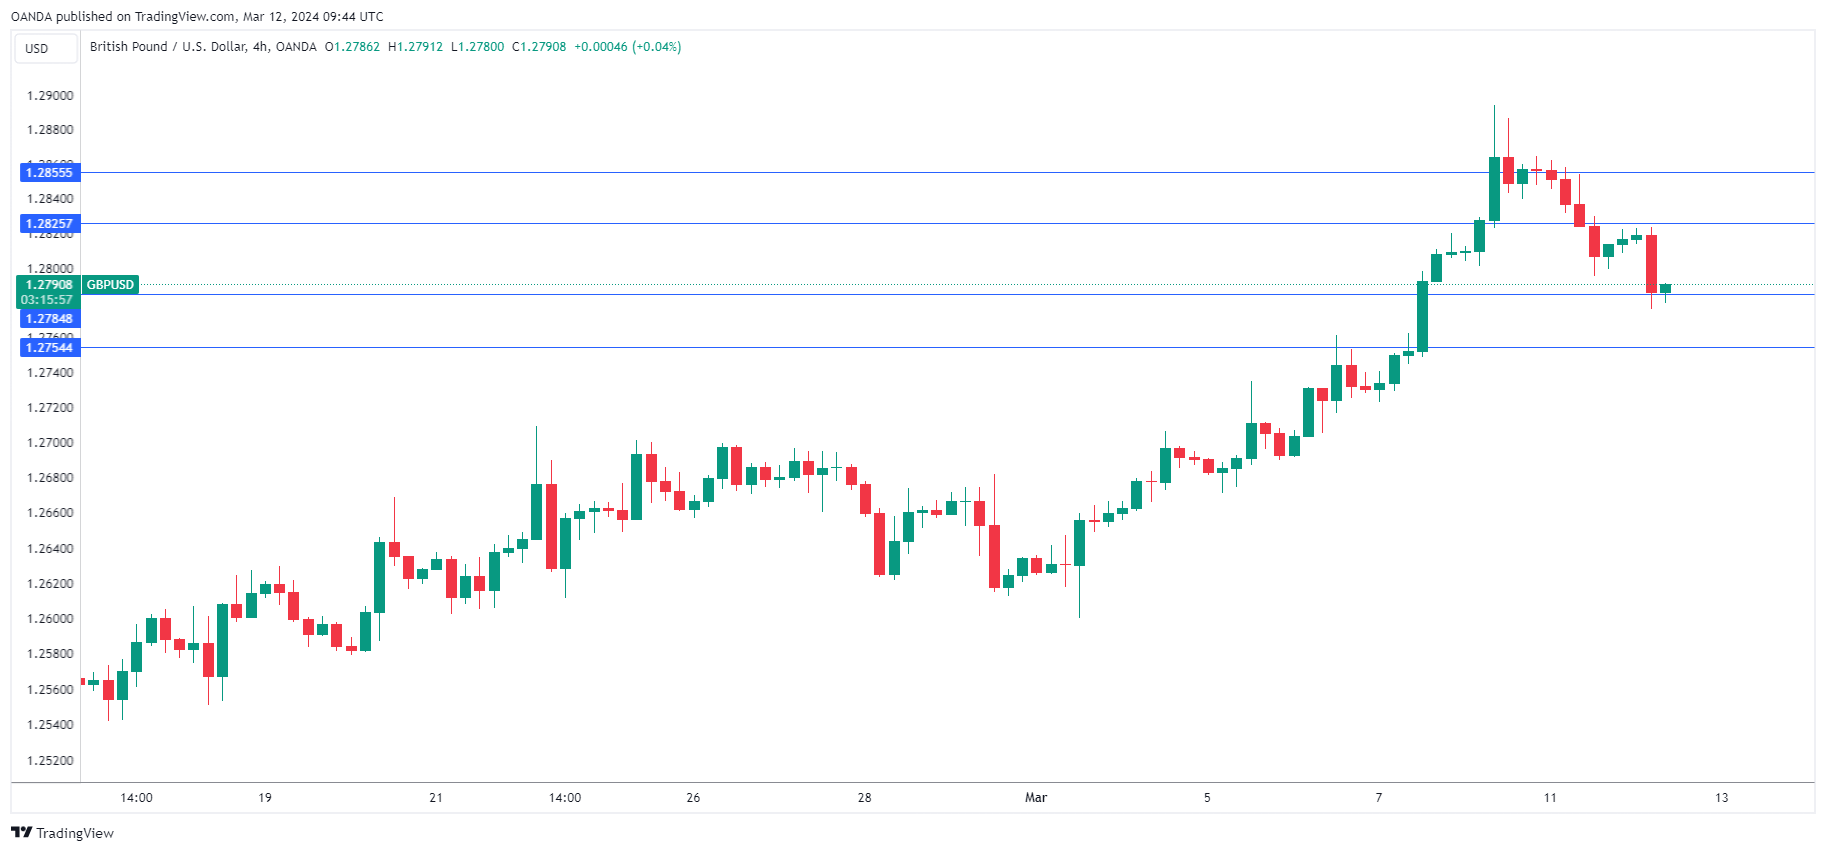
The British pound is drifting on Wednesday. In the European session, GBP/USD is trading at 1.2784, down 0.06%.
UK GDP expands 0.2% in January
It wasn’t a spectacular rebound but the UK economy showed some slight improvement, with GDP rising 0.2% m/m in January. This modest gain was in line with market expectations and followed a 0.1% decline in December. The main drivers behind the gain were retail trade and construction.
Over the past three months, GDP painted a gloomier picture. On an annualized basis, GDP declined by 0.3% decline, while GDP in the three months to January was down 0.1%.
The UK economy experienced a shallow recession in the second half of 2023, as the third and fourth quarters showed negative growth. The small gain in January shows that economy remains stagnant and could still be in a recession, but could point to the economy slowly finding its feet.
The Bank of England has projected that GDP for the first quarter will edge higher by 0.1% and the markets have priced in rate cut later in the year – August is the most likely date for a first rate cut but June is also a possibility. Inflation has dropped to 4% and consumers are feeling less of a squeeze on their wallets. Still, inflation remains double the 2% target and the battle against inflation is far from over.
Like other major central banks, the BoE is wary about lowering rates until it is convinced that inflation will not jump higher after it cuts rates. The BoE meets on March 21st and is widely expected to hold rates at 5.25% for a fifth straight time.
GBP/USD Technical
- GBP/USD tested support earlier at 1.2788. Below, there is support at 1.2751
- There is resistance at 1.2829 and 1.2866
EUR/USD Mid-Day Outlook
Daily Pivots: (S1) 1.0904; (P) 1.0924; (R1) 1.0946; More...
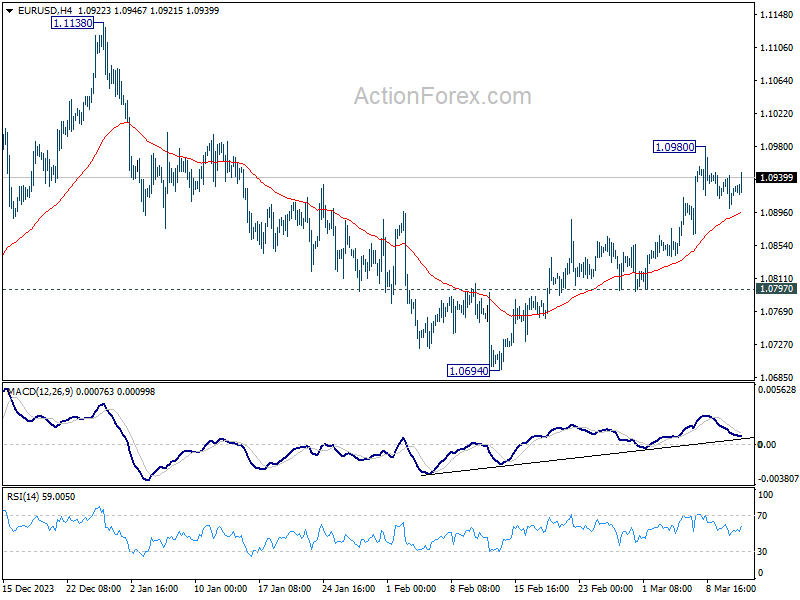
Outlook in EUR/USD is unchanged and intraday bias stays neutral at this point. Further rise is in favor as long as 55 4H EMA (now at 1.0894) holds. Above 1.0980 will resume the rally from 1.0694 to retest 1.1138 high. However, sustained break of the EMA will turn bias to the downside for 1.0797 support instead.
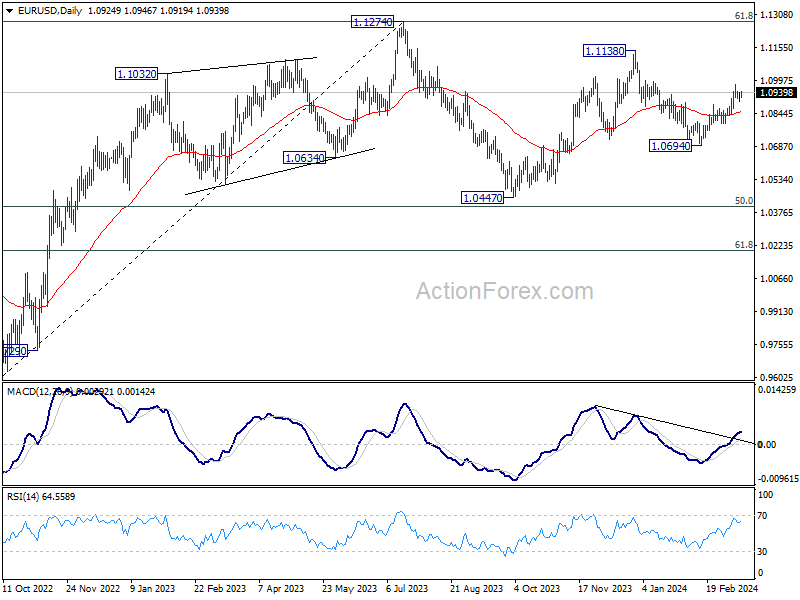
In the bigger picture, price actions from 1.1274 are viewed as a corrective pattern to rise from 0.9534 (2022 low). Rise from 1.0447 is seen as the second leg. While further rally could cannot be ruled out, upside should be limited by 1.1274 to bring the third leg of the pattern. Meanwhile, sustained break of 1.0694 support will argue that the third leg has already started for 1.0447 and possibly below.
GBP/USD Mid-Day Outlook
Daily Pivots: (S1) 1.2751; (P) 1.2788; (R1) 1.2829; More...
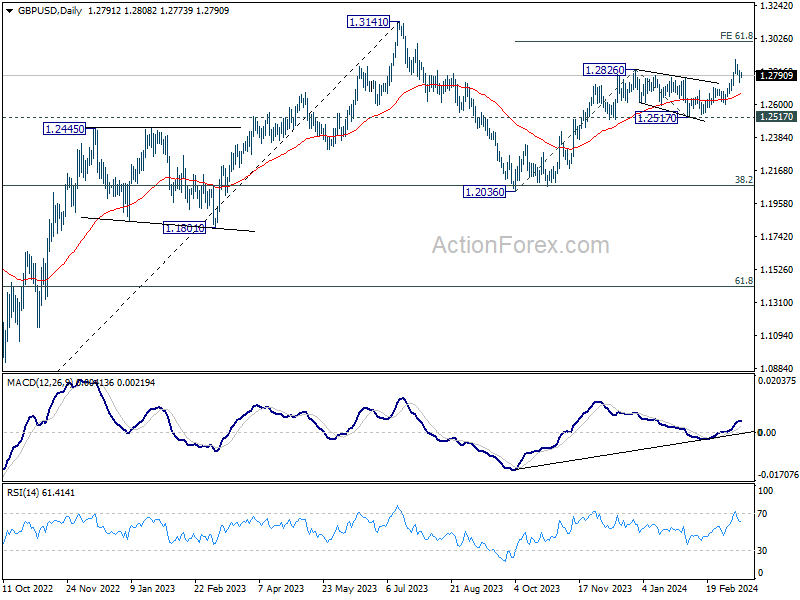
Outlook in GBP/USD remains unchanged and intraday bias stays neutral. Further rally will remain in favor as long as 55 4H EMA (now at 1.2755) holds. On the upside, above 1.2892 will resume larger rise from 1.2063 and target 61.8% projection of 1.2036 to 1.2826 from 1.2517 at 1.3005. However, sustained break of 55 4H EMA will bring deeper fall back towards 55 D EMA (now at 1.2662), and possibly further to 1.2517 structural support.
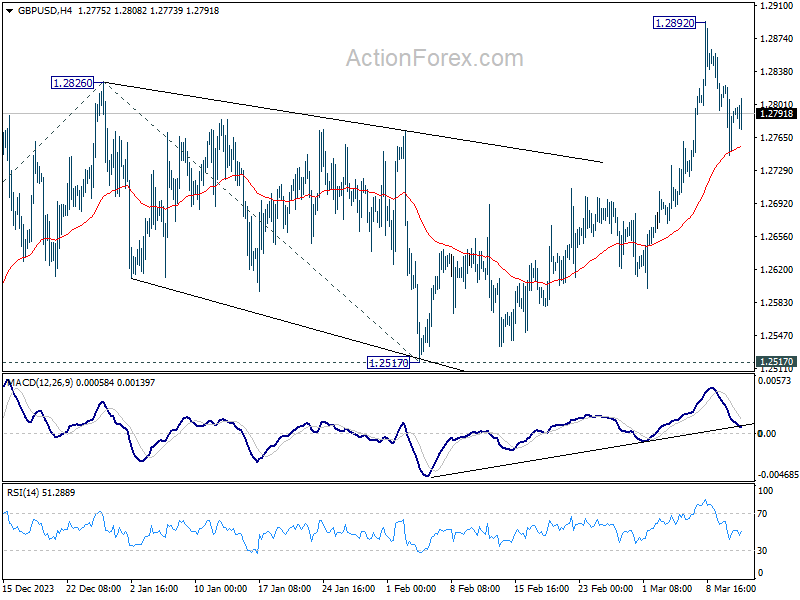
In the bigger picture, price actions from 1.3141 medium term top are seen as a corrective pattern to up trend from 1.0351 (2022 low). Rise from 1.2036 is seen as the second leg, which is still in progress. But upside should be limited by 1.3141 to bring the third leg of the pattern. Meanwhile, break of 1.2517 support will argue that the third leg has already started for 38.2% retracement of 1.0351 (2022 low) to 1.3141 at 1.2075 again.
USD/CHF Mid-Day Outlook
Daily Pivots: (S1) 0.8748; (P) 0.8772; (R1) 0.8796; More....
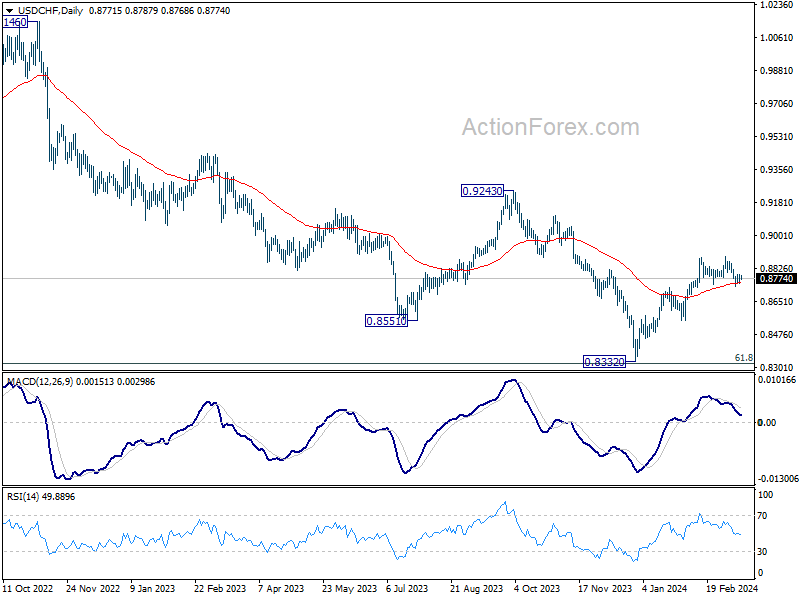
Intraday bias in USD/CHF remains neutral at this point. On the downside, sustained break of 0.8741 will argue that the whole rebound from 0.8332 might have completed, and bring deeper fall to 0.8550 support. Nevertheless, strong bounce from current level will retain near term bullishness. Further break of 0.8891 will resume the rise from 0.8332.
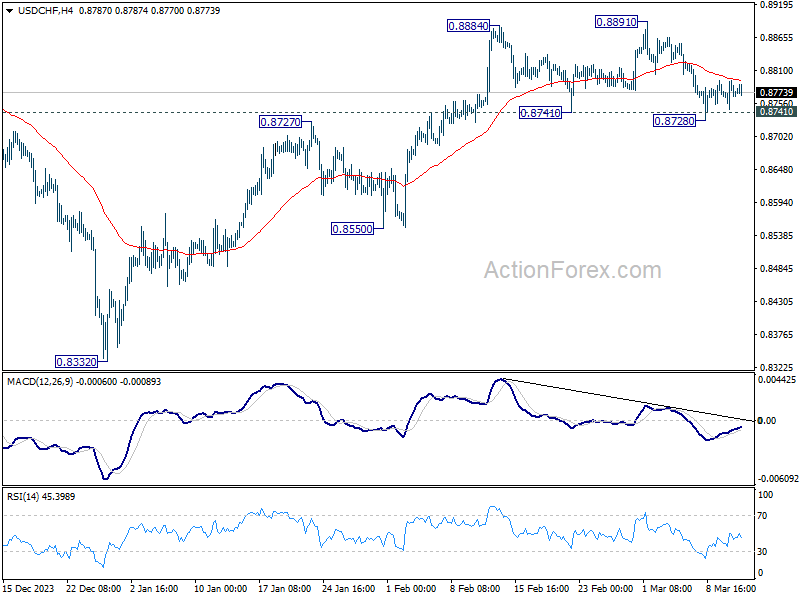
In the bigger picture, price actions from 0.8332 medium term bottom as seen as developing into a corrective pattern to the down trend from 1.0146 (2022 high). Further rise would be seen as long as 0.8555 support holds. But upside should be limited by 0.9243 resistance, at least on first attempt.
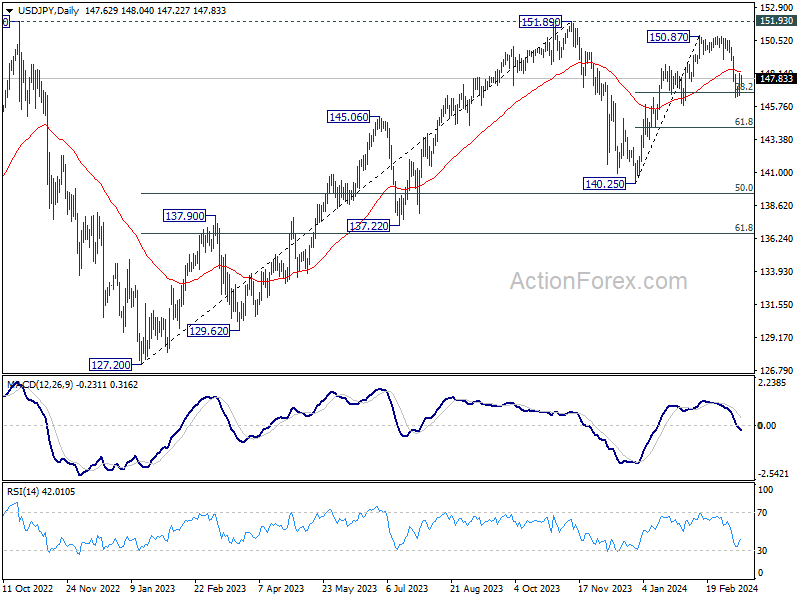
USD/JPY Mid-Day Outlook
Daily Pivots: (S1) 146.85; (P) 147.44; (R1) 148.27; More...
USD/JPY is staying in range between 146.47 and 148.29 and intraday bias remains neutral. On the downside, sustained break of 38.2% retracement of 140.25 to 150.87 at 146.81 will argue that fall from 150.87 is reversing the whole rally from 140.25. In this case, deeper decline would be seen to 61.8% retracement at 144.30 and below. Nevertheless, strong support from 146.81, followed by break of 148.29 minor resistance resistance, will argue that fall from 150.87 is merely a correction, which has completed already. Retest of 150.87 should be seen next.
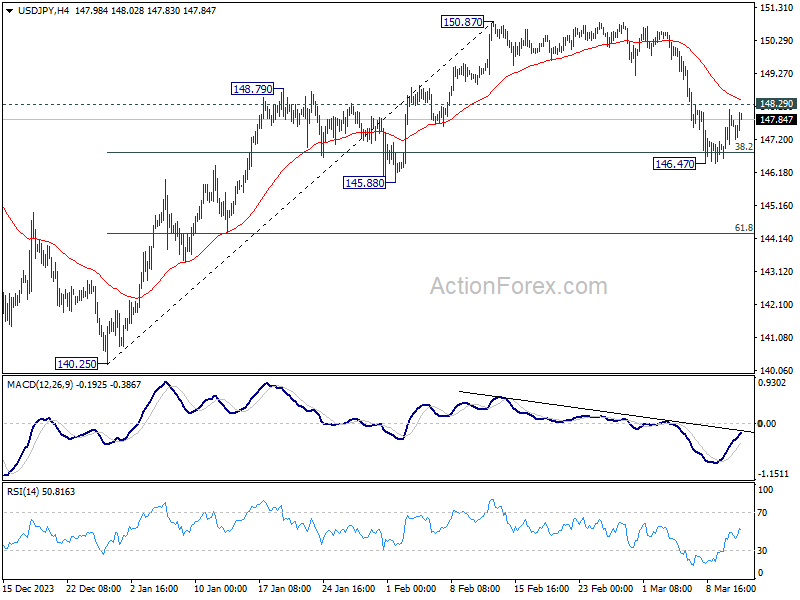
In the bigger picture, no change in the view that price action from 151.89 (2023 high) are correction to up trend from 127.20 (2023 low). The question is whether this correction has completed at 140.25, or extending with fall from 150.87 as the third leg. Sustained break of above mentioned 146.81 fibonacci level will favor the latter case. But even so, downside should be contained by 50% retracement of 127.20 to 151.89 at 139.54.
Yen Back Under Pressure, Copper Surges
Yen declined notably during the European session and stays weak as markets enter into US session. The selloff comes in the wake of rebound in European and US benchmark yields. Despite positive news from Japan, where large corporations have committed to significant wage increases for the first time in decades, the Yen struggled to find support. BoJ Governor Kazuo Ueda's remarks to the parliament underscored the importance of this year's wage negotiations, stating, "we hope to reach an appropriate decision (at next week's meeting) looking comprehensively at these results," along with other economic data.
Overall for the day, Yen is the weakest current, with Swiss Franc and the Dollar also underperforming. On the flip side, Euro led the strength chart, followed by Australian Dollar and New Zealand Dollar. Pound and Canadian Dollar are mixed in the middle. In particular, Sterling showed indifference to GDP data that aligned with expectations and hinted at the UK's exit from last year's recession.
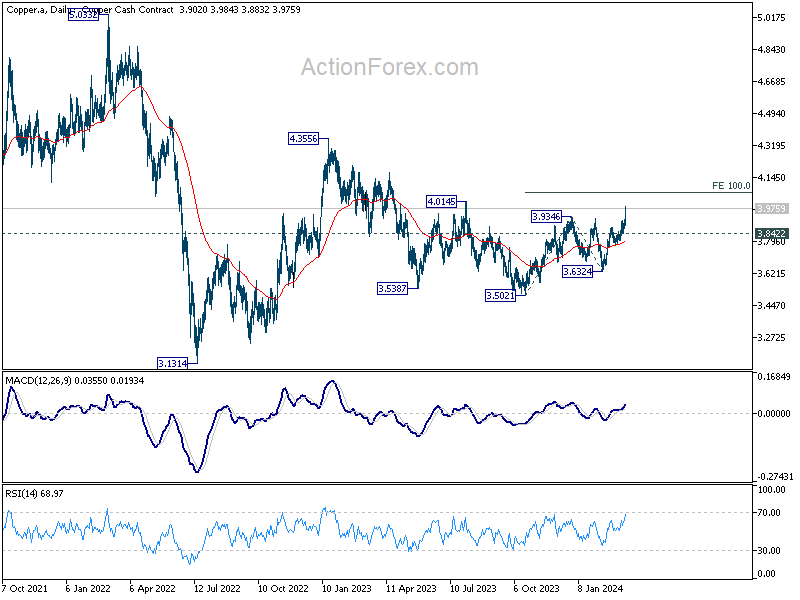
Technically, Copper surges sharply higher today, and the break of 3.9346 resistance confirms resumption of whole rebound from 3.5021. Further rise is now in favor as long as 3.8422 support holds, for 100% projection of 3.5021 to 3.9346 from 3.6324 at 4.0649. Decisive break there with strong momentum will raise the chance that it's resuming the rise from 3.1314 too, and target 4.3556 resistance next. Meanwhile, rejection by 4.0649 will keep the rebound corrective, and suggest that consolidation from 4.3556 is still on-going. Also, firm break of 4.0649 in Copper could give Aussie a lift.
In Europe, at the time of writing, FTSE is up 0.10%. DAX is up 0.02%. CAC is up 0.55%. UK 10-year yield is up 0.0397 at 4.086. Germany 10-year yield is up 0.0107 at 2.343. Earlier in Asia,Nikkei fell -0.26%. Hong Kong HSI fell -0.07%. China Shanghai SSE fell -0.40%. Singapore Strait Times rose 0.61%. Japan 10-year JGB yield fell -0.0074 to 0.761.
Eurozone industrial production falls -3.2% mom in Jan, EU down -2.1% mom
Eurozone industrial production fell -3.2% mom in January, much worse than expectation of -1.0% mom. Production increased by 2.6% for intermediate goods, increased by 0.5% for energy, decreased by -14.5% for capital goods, decreased by -1.2% for durable consumer goods, decreased by -0.3% for non-durable consumer goods.
EU industrial production fell -2.1% mom. Among Member States for which data are available, the largest monthly decreases were recorded in Ireland (-29.0%), Malta (-9.4%) and Estonia (-6.6%). The highest increases were observed in Poland (+13.3%), Slovenia (+10.6%) and Lithuania (+7.2%).
ECB's Kazaks: Inflation dragon nearly defeated, rate cuts on horizon
ECB Governing Council member Martins Kazaks likened the fight against inflation to battling a dragon, stating in a blog post, "The dragon of inflation is pinned to the ground, a little more and it will be defeated." This vivid metaphor reflects a growing confidence within ECB that the persistent inflationary pressures which have challenged Eurozone economy are finally coming under control.
Kazaks further suggested that "if the economy roughly follows" the bank's forecasts, "then the decision to start reducing interest rates could be made within the next few meetings."
Kazaks also acknowledged the delicate balance the ECB has had to maintain: the risk of premature rate cuts that could reignite inflation versus the risk of delaying rate reductions too long. However, he noted that these risks are now beginning to "level out," there is "no need to delay the rate reduction too much"
Complementing Kazaks's insights, ECB Governing Council member Francois Villeroy de Galhau told France Info radio, "We will probably cut rates in spring, and spring in Europe is from April to June 21."
"It's perhaps more probable in June — we are very pragmatic and will see depending on the data," Villeroy added.
UK GDP grows 0.2% mom in Jan, matches expectations
UK GDP expanded by 0.2% mom in January, matched expectations. Services was up 0.2% mom, and was the largest contributor to growth. Production fell -0.2% mom while construction grew 1.1% mom.
In the three months to January, GDP has fallen by -0.1% 3mo3m. Services was flat. Production fell -0.2% 3mo3m. Construction fell -0.9% 3mo3m.
NIESR forecasts 0.3% UK GDP growth in Q1
NIESR forecast UK GDP to grow by 0.3% in Q1, aligns with a pattern of "low, but stable economic growth," suggesting a potential "turning point" for the nation after slipping into a technical recession in the latter half of 2023.
The forecast comes with a critical analysis of UK's economic stagnation, emphasizing the necessity for "structural changes" to break free from the so-called low-growth trap. The institute's recommendation underscores the importance of bolstering public investment, particularly in pivotal areas such as infrastructure, education, and health.
USD/JPY Mid-Day Outlook
Daily Pivots: (S1) 146.85; (P) 147.44; (R1) 148.27; More...
USD/JPY is staying in range between 146.47 and 148.29 and intraday bias remains neutral. On the downside, sustained break of 38.2% retracement of 140.25 to 150.87 at 146.81 will argue that fall from 150.87 is reversing the whole rally from 140.25. In this case, deeper decline would be seen to 61.8% retracement at 144.30 and below. Nevertheless, strong support from 146.81, followed by break of 148.29 minor resistance resistance, will argue that fall from 150.87 is merely a correction, which has completed already. Retest of 150.87 should be seen next.
In the bigger picture, no change in the view that price action from 151.89 (2023 high) are correction to up trend from 127.20 (2023 low). The question is whether this correction has completed at 140.25, or extending with fall from 150.87 as the third leg. Sustained break of above mentioned 146.81 fibonacci level will favor the latter case. But even so, downside should be contained by 50% retracement of 127.20 to 151.89 at 139.54.
Economic Indicators Update
| GMT | Ccy | Events | Actual | Forecast | Previous | Revised |
|---|---|---|---|---|---|---|
| 07:00 | GBP | GDP M/M Jan | 0.20% | 0.20% | -0.10% | |
| 07:00 | GBP | Manufacturing Production M/M Jan | 0.00% | 0.00% | 0.80% | |
| 07:00 | GBP | Manufacturing Production Y/Y Jan | 2.00% | 2.00% | 2.30% | |
| 07:00 | GBP | Industrial Production M/M Jan | -0.20% | 0.00% | 0.60% | |
| 07:00 | GBP | Industrial Production Y/Y Jan | 0.50% | 0.70% | 0.60% | |
| 07:00 | GBP | Goods Trade Balance (GBP) Jan | -14.5B | -15.0B | -14.0B | |
| 10:00 | EUR | Eurozone Industrial Production M/M Jan | -3.20% | -1.00% | 2.60% | 1.60% |
| 13:00 | GBP | NIESR GDP Estimate (3M) Feb | 0.00% | -0.10% | ||
| 14:30 | USD | Crude Oil Inventories | 0.9M | 1.4M |